

The background to my portfolio
Back in March 2015 I decided to invest £50,000 of my own money using 80-20 Investor. The purpose was twofold, firstly to show how you can use 80-20 Investor to invest and outperform the market with only a few minutes effort every now and then. Secondly, no other investment commentator, journalist or research provider invests their own money for fear of failing. This is a sorry state of affairs and is precisely why I committed to openly running my own portfolio for 80-20 Investor members to see.
Since then I have periodically changed my portfolio using the fund suggestions provided by the 80-20 Investor algorithm and associated research. I always disclose the changes at the time they are made.
Performance update
As is usual in my portfolio reviews, the chart below shows how my portfolio has outperformed since I started the challenge in March 2015, which is over six years ago. The green line is the performance of my portfolio while the red line is the benchmark showing the average return achieved by professional fund managers given the same asset mix. To accurately calculate this I have used the average return for each sector in which my portfolio invested. The blue line shows what the average multi-asset fund with comparable equity content achieved. In other words, the red line would show the extra performance added by just the asset mix of my portfolio (where I was invested i.e European equities etc) over picking a typical multi-asset fund (the blue line). While the green line (which is my actual performance) shows the impact of being in the right funds at the right time, as identified by the 80-20 Investor algorithm.
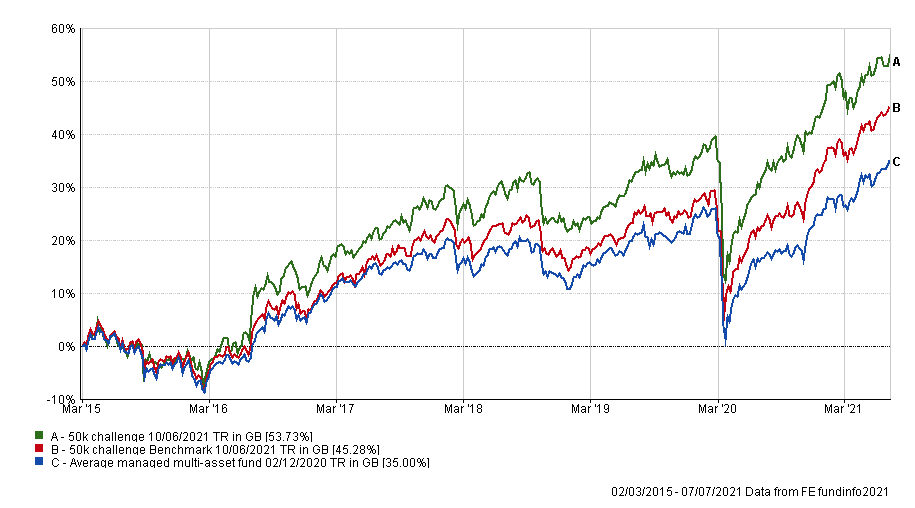
My £50k portfolio remains near its all-time high which is obviously good to see. However, as the chart below shows, the performance of my portfolio versus its benchmarks during June has disappointed on a relative basis. Ever since the US Federal Reserve's (the Fed) hawkish turn on the 15th June my portfolio has made little progress.
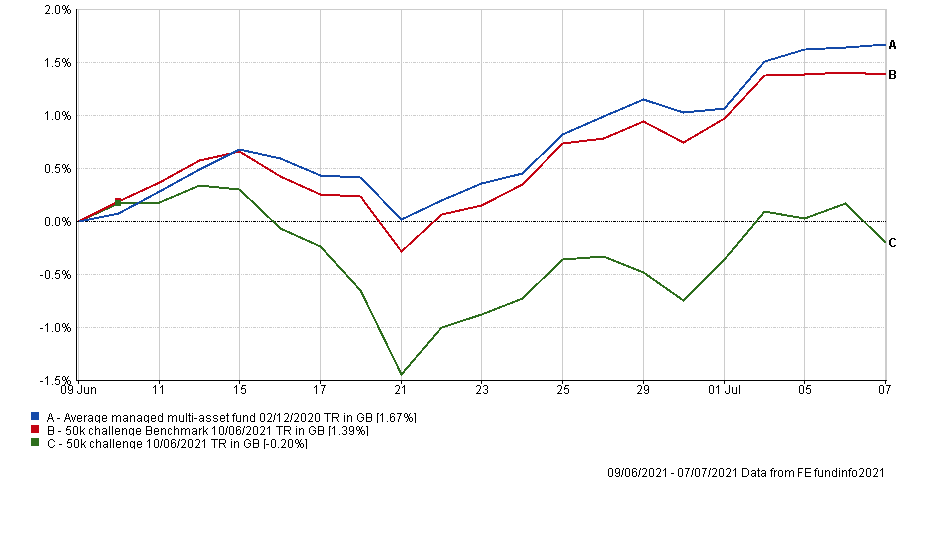
This is reflective of the fortunes of the reflation trade where value stocks have lagged growth stocks as shown in the chart below, which covers the same time period.
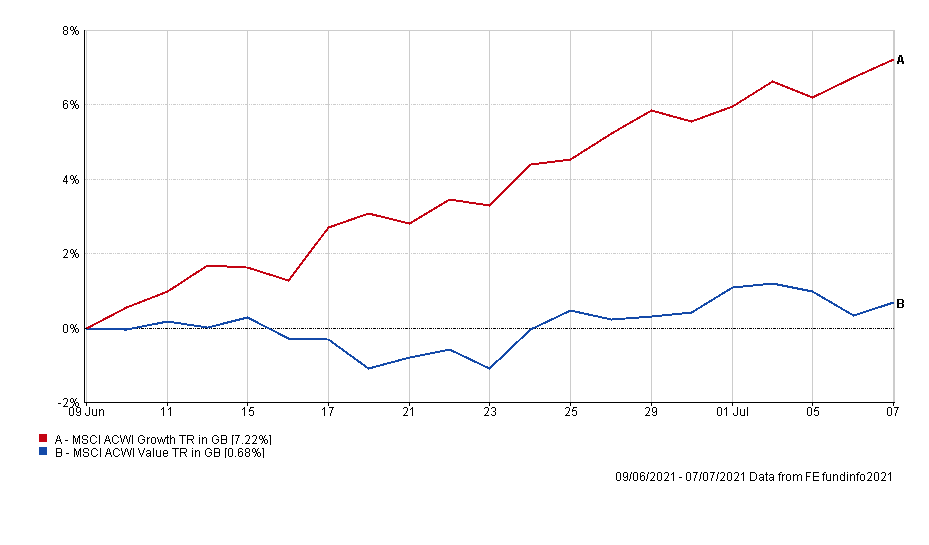
And while growth stocks still lag value stocks, year to date, they have made up lost ground as shown below.
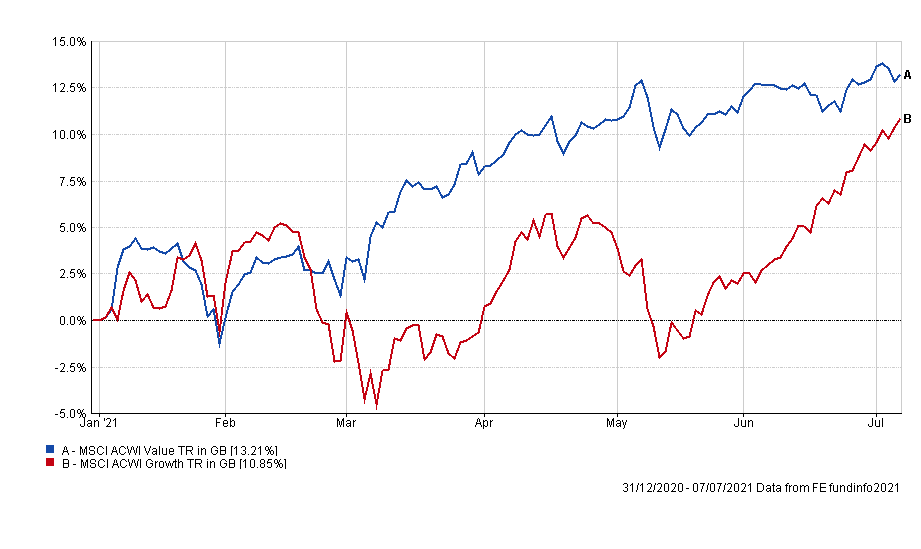
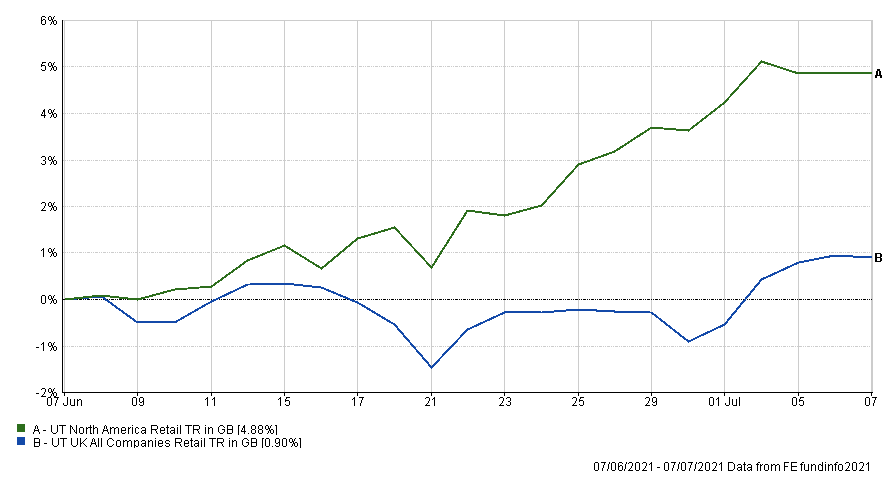
The shift in stance by the Fed has meant that the reflation trade has lost momentum as investors have begun viewing inflationary pressures as transitory while also questioning the sustainability of the global economic recovery. It doesn't mean that value plays can't push higher but it explains why we've started to see funds with growth exposure coming back into the BOTB. Of course, as the chart above shows, the market has been prone to strong rotations in and out of growth/value stocks and that is likely to continue. The other thing that has hampered my portfolio's performance is its large exposure to UK stocks versus US stocks. The chart below shows the performance of the average UK equity fund versus that of the average North American fund. The latter has been boosted by the almost 3% rise in the value of the dollar against the pound.
The table below shows which funds within my current portfolio are in the current BOTB or BFBS tables and which are not. Those funds in green are still in the BOTB while those in orange are not in the BOTB but remain in the BFBS list. Meanwhile, any funds in red have dropped out of both shortlists.
|
Name |
Allocation % (rounded) | Risk | Sector | ISIN Code |
| Artemis Global Equity | 5 | Medium | Global | GB00B2PLJP95 |
| ASI Strategic Bond | 15 | Low | Sterling Strategic Bond |
GB00BWK27X12
|
| ES R&M UK Recovery | 6 | Medium | UK All Companies | GB00B614J053 |
| Fidelity American Special Situations | 5.5 | High | North America | GB00B89ST706 |
| Fidelity Global High Yield | 8 | Low | Sterling High Yield |
GB00B7K7SQ18
|
| Fidelity UK Smaller Companies | 9.5 | High | UK Smaller Companies |
GB00B7VNMB18
|
| Invesco Global Emerging Markets (UK) | 7 | Medium | Global Emerging Markets |
GB00B3RW7S64
|
| iShares Physical Gold ETC | 4 | Medium | Commodity & Energy ETF | IE00B4ND3602 |
| JPM Natural Resources | 5 | High | Specialist | GB0031835118 |
| Jupiter Income Trust | 6 | Medium | UK Equity Income | GB0004791389 |
| Marlborough European Multi-Cap | 3.5 | High | Europe Excluding UK | GB0001719730 |
| Premier Diversified Growth | 10 | Medium | Mixed Investment 40-85% Shares | GB00B8BJV423 |
| Wise Multi-Asset Growth | 8.5 | Medium | Flexible Investment | GB0034272533 |
| Schroder Global Equity Income | 7 | Medium | Global Equity Income |
GB00B76V7M69
|
Despite the slowing of momentum in areas of the market that benefit from the reflation narrative and the falling pound, most of the funds within my portfolio remain in the BFBS and the BOTB tables, with the exception of ASI Strategic Bond.
While of course, I'd love my portfolio to keep pushing higher and higher and to catch every trend, that isn't realistic. The latest rotation really took hold after the Fed meeting, little over three weeks ago. In these portfolio reviews I have pointed out that if the market narrative was to flip on its head my portfolio would be hampered as a result. That's effectively what we have seen. The table below shows the performance of funds within my portfolio since my last review, almost a month ago.
| Fund | % 1-month performance |
| Premier Miton Diversified Growth | 1.15 |
| Wise Funds Limited TB Wise Multi-Asset Growth | 0.63 |
| Fidelity Global High Yield | 0.56 |
| ASI Strategic Bond | 0.39 |
| Marlborough European Multi-Cap | 0.23 |
| Fidelity UK Smaller Companies | -0.25 |
| Invesco Global Emerging Markets (UK) | -1.07 |
| Artemis Global Equity | -1.61 |
| Schroder Global Equity Income | -2.06 |
| Jupiter Income Trust | -2.29 |
| iShares Physical Gold ETC | -2.35 |
| Fidelity American Special Situations | -2.35 |
| ES R&M UK Recovery | -2.75 |
| JPM Natural Resources | -3.77 |
Those funds with the greatest exposure to commodities and value stocks dragged on performance, while those with exposure to growth/bonds outperformed. With the market still in a state of flux it is too early to say if now is the time to make wholesale changes, especially given that most funds remain in the BFBS tables for now. While the ASI Strategic Bond fund is not in either the BFBS tables or the BOTB I am keeping it for now given its positive performance during the recent bond market moves. In addition, I have decided to introduce a number of funds from this month's BOTB into my portfolio, which will help to diversify the portfolio's underlying style i.e. reducing its value focus. As such I want to minimise the portion of my portfolio that will be out of the market, given that the fund switches will impact approximately 24% of my portfolio. So for now the ASI Strategic Bond fund will stay within my portfolio.
Fund switches
Following this review, I have made the following fund switches:
100% out of ES R&M UK Recovery and 100% into Slater Recovery - this is a like for like UK equity fund switch but the latter has less exposure to cyclical sectors such as banking.
100% out of Fidelity American Special Situations and 100% into BMO North American Equity - this is a like for like US equity fund switch but the latter has more exposure to tech stocks.
100% out of Invesco Global Emerging Markets (UK) and 100% into Fidelity Emerging Europe Middle East and Africa - again a like for like switch but with less focus on Asian, and in particular Chinese equities.
100% out of Jupiter Income Trust and 100% into Premier Diversified Growth - the latter has been one of the best performers within my portfolio in recent months. Jupiter Income has lost momentum because of its significant exposure to UK banks.
So overall my portfolio does still have a value bias but if the recent rotation into growth stocks and bonds continues then this will ultimately be reflected in my portfolio over time. My portfolio's asset mix still remains in line with the BOTB which does mean that if the pound keeps weakening then my portfolio won't receive as big a boost, given its exposure to UK equities.
My portfolio
My portfolio now looks like this:
|
Name |
Allocation % (rounded) | Risk | Sector | ISIN Code |
| Artemis Global Equity | 5 | Medium | Global | GB00B2PLJP95 |
| ASI Strategic Bond | 15 | Low | Sterling Strategic Bond |
GB00BWK27X12
|
| BMO North American Equity | 5.5 | Medium | North America | GB0030281405 |
| Fidelity Emerging Europe Middle East and Africa | 6.5 | High | Specialist | GB00B87Z7808 |
| Fidelity Global High Yield | 8 | Low | Sterling High Yield |
GB00B7K7SQ18
|
| Fidelity UK Smaller Companies | 9.5 | High | UK Smaller Companies |
GB00B7VNMB18
|
| iShares Physical Gold ETC | 4 | Medium | Commodity & Energy ETF | IE00B4ND3602 |
| JPM Natural Resources | 5 | High | Specialist | GB0031835118 |
| Marlborough European Multi-Cap | 4 | High | Europe Excluding UK | GB0001719730 |
| Premier Diversified Growth | 16 | Medium | Mixed Investment 40-85% Shares | GB00B8BJV423 |
| Schroder Global Equity Income | 7 | Medium | Global Equity Income |
GB00B76V7M69
|
| Slater Recovery | 6 | Medium | UK All Companies | GB0031554248 |
| Wise Multi-Asset Growth | 8.5 | Medium | Flexible Investment | GB0034272533 |
My Portfolio asset mix
My portfolio asset mix is as shown below which has around a 59% exposure to equities which is down slightly on last month's 61%. The numbers in brackets are last month's equivalent figures.
-
- UK Equities 21% (23%)
- North American Equities 13% (11%)
- Asian/Emerging Market Equities 7% (5%)
- Japanese Equities 0% (0%)
- European Equities 5% (4%)
- Chinese equities 0% (2%)
- Other equity 7% (9%)
- Commodities and energy 9% (9%)
- UK Fixed Interest 6% (6%)
- Global Fixed Interest 16% (16%)
- Cash 5% (5%)
- Alternative Investment Strategies 11% (10%)
Damien's higher risk and lower risk portfolios
Using the logic described in my post: Update to Damien’s alternative risk portfolios I created hypothetical higher and lower risk versions of my portfolio below:
Higher risk
| Fund | Allocation % |
| Artemis Global Equity | 7 |
| BMO North American Equity | 7 |
| Fidelity Emerging Europe Middle East and Africa | 8 |
| Fidelity UK Smaller Companies | 12 |
| iShares Physical Gold ETC | 5 |
| JPM Natural Resources | 7 |
| Marlborough European Multi-Cap | 5 |
| Premier Diversified Growth | 21 |
| Schroder Global Equity Income | 9 |
| Slater Recovery | 8 |
| Wise Multi-Asset Growth | 11 |
Lower risk
| Fund | Allocation % |
| Artemis Global Equity | 7 |
| ASI Strategic Bond | 20 |
| BMO North American Equity | 7 |
| Fidelity Global High Yield | 12 |
| iShares Physical Gold ETC | 5 |
| Premier Diversified Growth | 21 |
| Schroder Global Equity Income | 9 |
| Slater Recovery | 8 |
| Wise Multi-Asset Growth | 11 |

£200 Pension Cashback Offer
Make a qualifying deposit or transfer a pension to our partner Interactive Investor.
- Deposit or transfer a pension of at least £20k and you could earn £200 cashback
- Terms and Fees apply, Capital at risk
- New & Existing customers opening a SIPP
- Offer ends 31st July 2026
Before starting your transfer, check you won't lose any valuable benefits (such as guaranteed annuity rates or a lower protected pension age) and find out what exit fees you might have to pay
