

The background to my portfolio
Back in March 2015 I decided to invest £50,000 of my own money using 80-20 Investor. The purpose was twofold, firstly to show how you can use 80-20 Investor to invest and outperform the market with only a few minutes effort every now and then. Secondly, no other investment commentator, journalist or research provider invests their own money for fear of failing. This is a sorry state of affairs and is precisely why I committed to openly running my own portfolio for 80-20 Investor members to see.
Since then I have periodically changed my portfolio using the fund suggestions provided by the 80-20 Investor algorithm and associated research. I always disclose the changes at the time they are made.
Performance update
As is usual in my portfolio reviews, the chart below shows how my portfolio has outperformed since I started the challenge in March 2015, which is over seven years ago. The green line is the performance of my portfolio while the red line is the benchmark showing the average return achieved by professional fund managers given the same asset mix. To accurately calculate this I have used the average return for each sector in which my portfolio invested. The blue line shows what the average multi-asset fund with comparable equity content achieved. In other words, the red line would show the extra performance added by just the asset mix of my portfolio (where I was invested i.e European equities etc) over picking a typical multi-asset fund (the blue line). While the green line (which is my actual performance) shows the impact of being in the right funds at the right time, as identified by the 80-20 Investor algorithm.
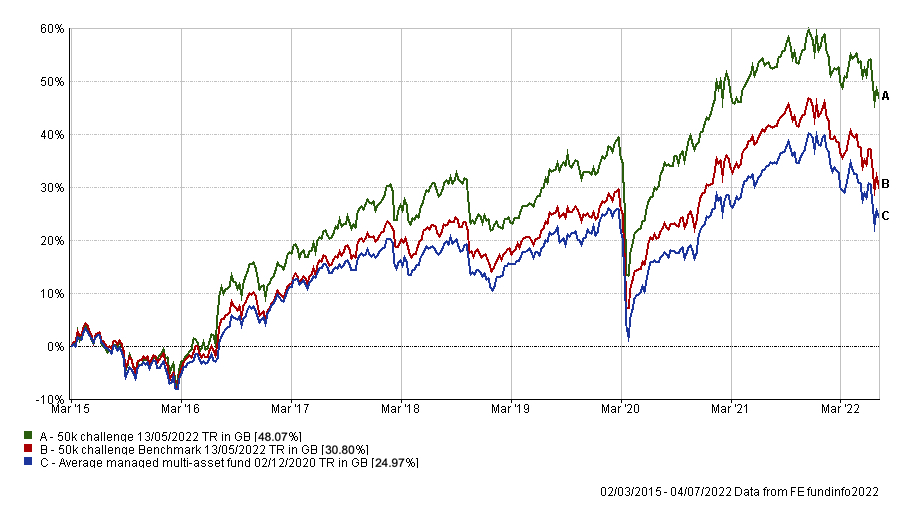
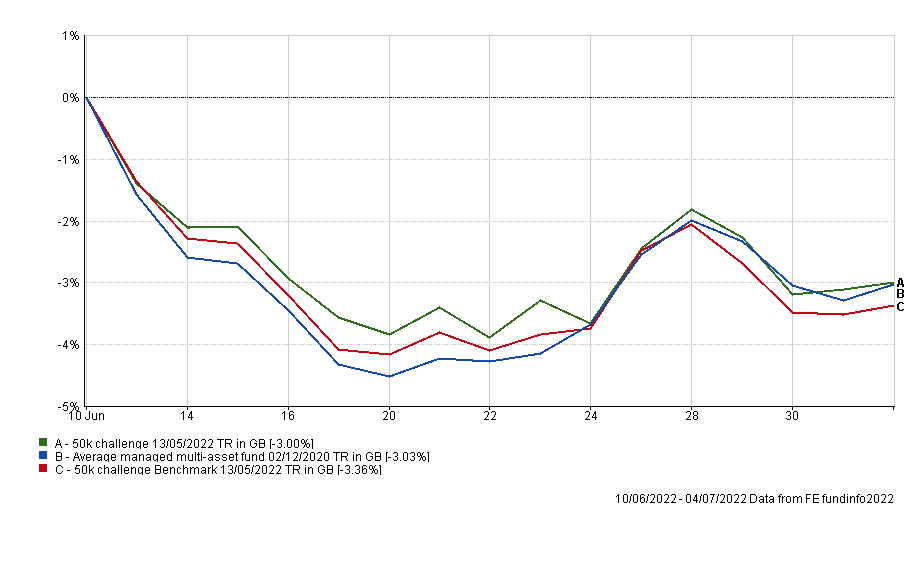
As you can see below, since my last review my £50k portfolio has outperformed its benchmarks, albeit marginally. In doing so my portfolio maintains its long-term outperformance.
The table below shows the individual performance of each holding in my portfolio since my last review a month ago. The table is almost the inverse of what we saw last time with gold now outperforming while funds with commodity or energy exposure falling heavily. The performance of the individual funds reflects what is shown in the latest 80-20 Investor Growth heatmap with the lower risk funds faring best.
| Holding | % performance (since last review on 10th June) |
| iShares Physical Gold ETC | 0.66 |
| Thesis TM Tellworth UK Select | 0.4 |
| Cash | 0.07 |
| Premier Miton Defensive Growth | -0.39 |
| Fidelity Global Property | -0.48 |
| Troy Asset Management Ltd Trojan Ethical | -0.76 |
| Fidelity Index US | -2.33 |
| Fidelity American Special Situations | -2.7 |
| Invesco UK Opportunities (UK) | -4 |
| BM SVS Brooks Macdonald Defensive Capital | -4.23 |
| Invesco High Yield (UK) | -5.27 |
| M&G Global Dividend | -6.84 |
| BlackRock Natural Resources Growth & Income | -13.51 |
As usual, the table below shows which funds within my portfolio are in the current BOTB or BFBS tables and which are not. Those funds in green are still in the BOTB while those in orange are not in the BOTB but remain in the BFBS list. Meanwhile, any funds in red have dropped out of both shortlists.
| Name | Allocation % (rounded) | Risk | Sector | ISIN Code |
| BlackRock Natural Resources Growth & Income | 6% | High | Commodity/Natural Resource | GB00B6865B79 |
| BM SVS Brooks Macdonald Defensive Capital | 10% | Low | Targeted Absolute Return | GB00B61MR835 |
| Cash | 6.5% | Low | ||
| Fidelity American Special Situations | 8.5% | Medium | North America | GB00B89ST706 |
| Fidelity Global Property | 8% | High | Property Other | GB00B7K2NZ09 |
| Fidelity Index US | 11% | High | North America | GB00BJS8SH10 |
| Invesco High Yield (UK) | 3.5% | Low | Sterling High Yield | GB00B3RW7649 |
| Invesco UK Opportunities (UK) | 7.5% | Medium | UK All Companies | GB00B1W7HM62 |
| iShares Physical Gold ETC | 5% | Medium | Commodity & Energy ETF | IE00B4ND3602 |
| M&G Global Dividend | 9% | Medium | Global Equity Income | GB00B46J9127 |
| Premier Miton Defensive Growth | 12% | Low | Targeted Absolute Return | GB00B832BD89 |
| Thesis TM Tellworth UK Select | 5% | Low | Targeted Absolute Return | GB00BNY7YM73 |
| Troy Asset Management Ltd Trojan Ethical | 8% | Low | Flexible Investment | GB00BJP0XX17 |
In recent months I reduced my portfolio's bond exposure and increased my cash weighting which proved a positive move as stagflation fears grew. The absolute return funds within my portfolio helped insulate the lower-risk end of my portfolio from the carnage in bond markets. However, as shown in the earlier performance table the BM SVS Brooks Macdonald Defensive Capital has now fallen out of the BOTB and BFBS tables and its performance has disappointed of late. At the same time, the following funds remain outside of both shortlists and are also coloured red in the table above.
- Fidelity Global Property
- Invesco High Yield (UK)
- Fidelity US Index
- Troy Asset Management Ltd Trojan Ethical
Last month I made no changes to my portfolio, instead preferring to wait for the dust to settle on another bout of extreme bond and equity market volatility. I acknowledged at the time that the risks to my portfolio were "that bonds could suddenly rally as inflation fears subside and fears of a recession increase. My portfolio has limited exposure to bonds - which is one of the reasons why it has outperformed - but also has exposure to gold and other commodities. If we have a global economic growth shock then bonds could rally strongly, while equity markets could fall along with commodities. That would be negative for my portfolio. So while my portfolio is outperforming significantly right now I am humble enough to realise that could change if the market narrative suddenly pivots".
Interestingly the earlier performance table shows how during June we saw the early stages of such a global economic growth shock as recession fears took hold. By way of example, BlackRock Natural Resources Growth & Income fell 13.51% since my last portfolio review. Despite this slump in performance, you can see that the fund is still up over 14% since I first invested into it back in November 2021.
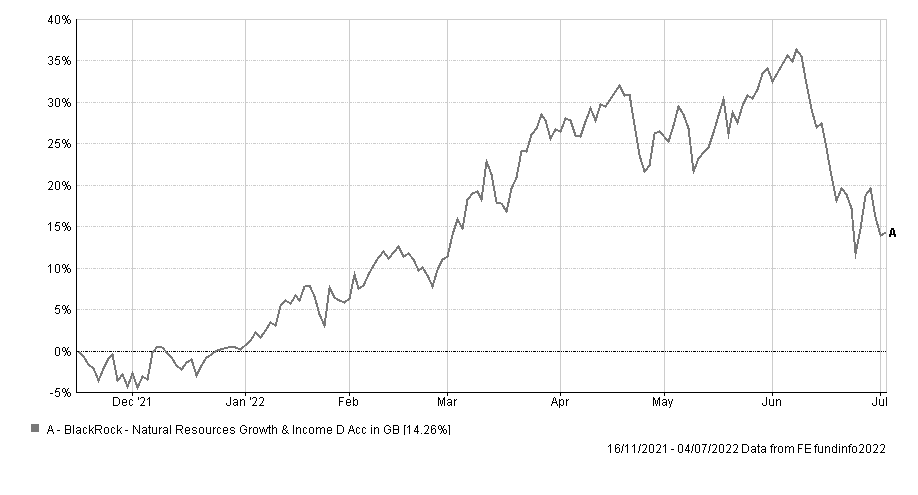
During June, most commodities entered a bear market, falling more than 20% from their recent highs which hurt the BlackRock fund and ultimately proved a drag on my portfolio's overall performance. But once again it remains true that if my portfolio was to reside in the Mixed Investment 40-85% Shares sector of professionally managed funds it would be ranked in the top quartile for Alpha and Sharpe ratios since the portfolio's inception 7 years ago. Not only that but it would also still rank in the top quartile for performance too (despite its relatively modest equity exposure). I explained what Alpha and Sharpe are and how they work in May's monthly review.
Overall, it means that my portfolio is not broken, far from it in fact as it is still performing well. There's no rush to tear it apart, despite its asset mix now differing more significantly from that of the new BOTB. The latest BOTB is the most diversified we've seen in a while with new (albeit small) exposure to Asian and Chinese equities as well as Japanese equities. However, with markets still volatile, I plan to morph my portfolio's asset mix towards that of the BOTB over time. In the past, this has proved prudent, as it ensures that any new trends (such as the outperformance of Chinese equities) become more entrenched before replicating it in my own portfolio. Having said that, I am going to make several relatively small changes to my portfolio this month to help diversify the portfolio both in terms of geographical exposure and also to reduce the recession risk mentioned earlier. That means reintroducing some bond exposure and also reducing the portfolio's commodity exposure in favour of more defensive equity sectors as highlighted in my research article "How to invest for a recession".
Looking at the funds individually, Fidelity Global Property has had an upturn in fortunes in the last month and as I'm keeping the changes within my portfolio to a minimum I will keep the fund on my watchlist and review its position again next month. The same goes for Troy Asset Management Ltd Trojan Ethical which has been one of my portfolio's better performers over the last month, thanks in part to its exposure to gold and index linked bonds.
You will recall that I've been reducing my exposure to Invesco High Yield (UK) over time and the fund continues to disappoint so I now plan to remove it from my portfolio entirely in favour of reintroducing some direct bond exposure to my portfolio for the first time this year. Meanwhile, I will reduce my exposure to Fidelity US Index (which was already on my watchlist last month) in favour of exposure to more defensive sectors within global equities, to balance out the portfolio's exposure to cyclical assets and cyclical equity sectors.
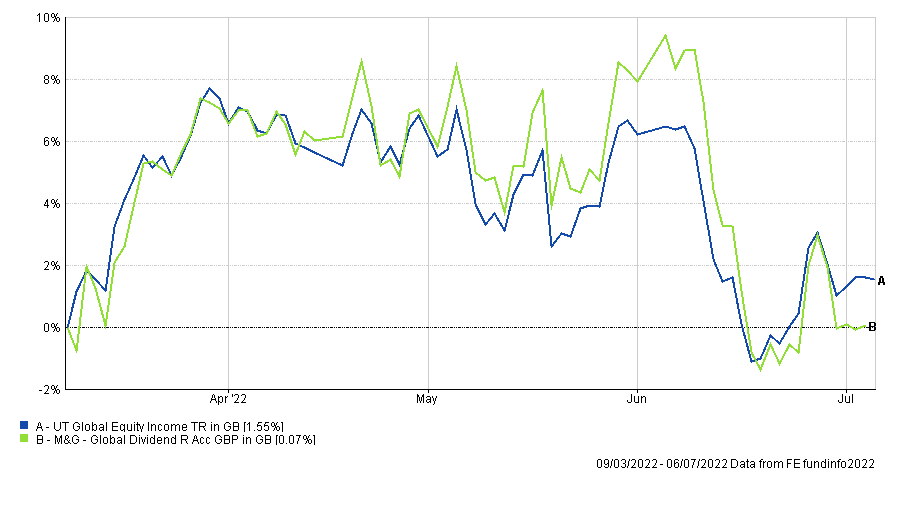
The other fund I will reduce my exposure to is the M&G Global Dividend fund which has disappointed since its inclusion in my portfolio. As the chart below shows it has largely tracked its sector average so now I think it's time to reduce my holding, especially as its recent performance continues to disappoint.
Below I list the fund switches I am making this month.
Fund switches
Below I list the fund switches I am making this month.
- 100% out of Invesco High Yield and 50% into Premier Miton Defensive Growth and 50% into Janus Henderson Inst Overseas Bond
- 50% out of BM SVS Brooks Macdonald Defensive Capital and 100% into Janus Henderson Inst Overseas Bond
- 33% out of BlackRock Natural Resources Growth & Income and 100% into JOHCM Global Opportunities
- 33% out of Fidelity Index US and 100% into JOHCM Global Opportunities
- 25% out of M&G Global Dividend and 100% into JOHCM Global Opportunities
The switches only impact just over 16% of my portfolio and almost half of that relates to the low-risk portion of my portfolio. You can see that in moving out of the high yield bond fund I am backing a fund within the portfolio that is already performing well (namely Premier Miton Defensive Growth) as well as introducing new exposure to global bonds via Janus Henderson Inst Overseas Bond. This fund is in the current BOTB but is also highlighted in my research piece titled "Funds for a bond market rally".
In terms of my equity exposure, the switches help diversify my exposure by slightly reducing my commodities exposure and increasing my exposure to defensive equity sectors via JOHCM Global Opportunities. The fund is in the current BOTB but is also featured in my research piece "Funds for a recession".
My portfolio
My portfolio now looks like this:
| Name | Allocation % (rounded) | Risk | Sector | ISIN Code |
| BlackRock Natural Resources Growth & Income | 4.00% | High | Commodity/Natural Resource | GB00B6865B79 |
| BM SVS Brooks Macdonald Defensive Capital | 5.00% | Low | Targeted Absolute Return | GB00B61MR835 |
| Cash | 6.75% | Low | ||
| Fidelity American Special Situations | 8.25% | Medium | North America | GB00B89ST706 |
| Fidelity Global Property | 8.00% | High | Property Other | GB00B7K2NZ09 |
| Fidelity Index US | 7.00% | High | North America | GB00BJS8SH10 |
| Invesco UK Opportunities (UK) | 7.50% | Medium | UK All Companies | GB00B1W7HM62 |
| iShares Physical Gold ETC | 5.00% | Medium | Commodity & Energy ETF | IE00B4ND3602 |
| Janus Henderson Inst Overseas Bond | 7.00% | Low | Global Bonds | GB0007673055 |
| JOHCM Global Opportunities | 8.00% | Medium | Global | GB00BJ5JMC04 |
| M&G Global Dividend | 6.50% | Medium | Global | GB00B46J9127 |
| Premier Miton Defensive Growth | 14.00% | Low | Targeted Absolute Return | GB00B832BD89 |
| Thesis TM Tellworth UK Select | 5.00% | Low | Targeted Absolute Return | GB00BNY7YM73 |
| Troy Asset Management Ltd Trojan Ethical | 8.00% | Low | Flexible Investment | GB00BJP0XX17 |
The change means that my portfolio now has an additional fund in it (a total of 13) which is the most for some time, and reflects the volatile nature of markets at the moment. In addition, around 45% of my portfolio is now sitting in low-risk funds or cash, which is possibly one of the largest low-risk exposures I've had since running the portfolio.
My Portfolio asset mix
My portfolio asset mix still has around 60% exposure to equities. Last month's figures are shown in brackets.
-
- UK Equities 15% (13%)
- North American Equities 20% (19%)
- Asian/Emerging Market Equities 0% (0%)
- Japanese Equities 0% (0%)
- European Equities 4% (2%)
- Chinese equities 0% (0%)
- Other equity 8% (9%)
- Commodities and energy 10% (15%)
- UK Fixed Interest 0% (0%)
- Global Fixed Interest 10% (8%)
- Cash 6% (6%)
- Alternative Investment Strategies 19% (20%)
- Property 8% (8%)
Damien's higher risk and lower risk portfolios
Using the logic described in my post: Update to Damien’s alternative risk portfolios I created hypothetical higher and lower risk versions of my portfolio below:
Lower risk
| Fund | Allocation % |
| BM SVS Brooks Macdonald Defensive Capital | 7 |
| Cash | 8 |
| Fidelity American Special Situations | 10 |
| Invesco UK Opportunities (UK) | 9 |
| iShares Physical Gold ETC | 6 |
| Janus Henderson Inst Overseas Bond | 9 |
| JOHCM Global Opportunities | 10 |
| M&G Global Dividend | 8 |
| Premier Miton Defensive Growth | 17 |
| Thesis TM Tellworth UK Select | 6 |
| Troy Asset Management Ltd Trojan Ethical | 10 |
Higher risk
| Fund | Allocation % |
| BlackRock Natural Resources Growth & Income | 7 |
| Fidelity American Special Situations | 15 |
| Fidelity Global Property | 15 |
| Fidelity Index US | 13 |
| Invesco UK Opportunities (UK) | 14 |
| iShares Physical Gold ETC | 9 |
| JOHCM Global Opportunities | 15 |
| M&G Global Dividend | 12 |

£200 Pension Cashback Offer
Make a qualifying deposit or transfer a pension to our partner Interactive Investor.
- Deposit or transfer a pension of at least £20k and you could earn £200 cashback
- Terms and Fees apply, Capital at risk
- New & Existing customers opening a SIPP
- Offer ends 31st July 2026
Before starting your transfer, check you won't lose any valuable benefits (such as guaranteed annuity rates or a lower protected pension age) and find out what exit fees you might have to pay
