

The background to my portfolio
Back in March 2015 I decided to invest £50,000 of my own money using 80-20 Investor. The purpose was twofold, firstly to show how you can use 80-20 Investor to invest and outperform the market with only a few minutes effort every now and then. Secondly, no other investment commentator, journalist or research provider invests their own money for fear of failing. This is a sorry state of affairs and is precisely why I committed to openly running my own portfolio for 80-20 Investor members to see.
Since then I have periodically changed my portfolio using the fund suggestions provided by the 80-20 Investor algorithm and associated research. I always disclose the changes at the time they are made.
Performance update
As is usual in my portfolio reviews, the chart below shows how my portfolio has outperformed since I started the challenge in March 2015. The green line is the performance of my portfolio while the red line is the benchmark showing the average return achieved by professional fund managers given the same asset mix. To accurately calculate this I have used the average return for each sector in which my portfolio invested. The blue line shows what the average multi-asset fund with comparable equity content achieved. In other words, the red line would show the extra performance added by just the asset mix of my portfolio (where I was invested i.e European equities etc) over picking a typical multi-asset fund (the blue line). While the green line (which is my actual performance) shows the impact of being in the right funds at the right time, as identified by the 80-20 Investor algorithm.
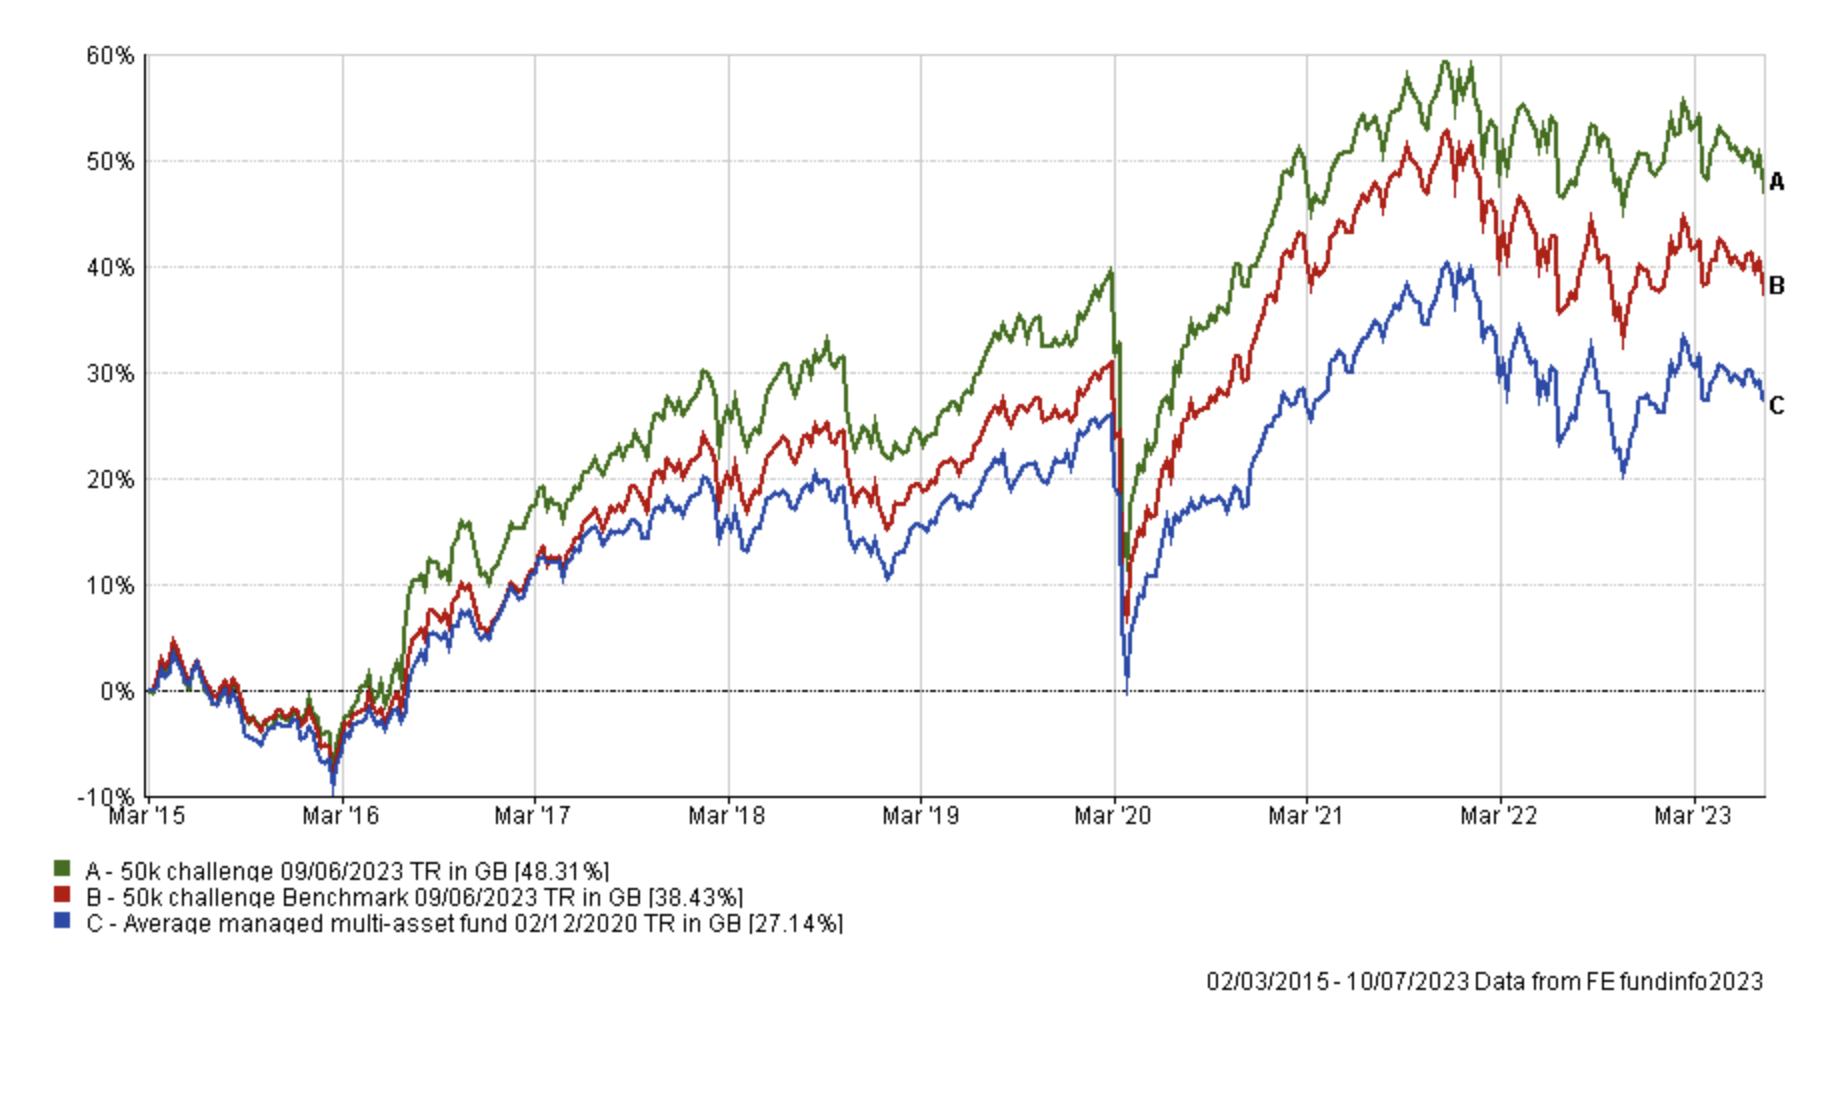
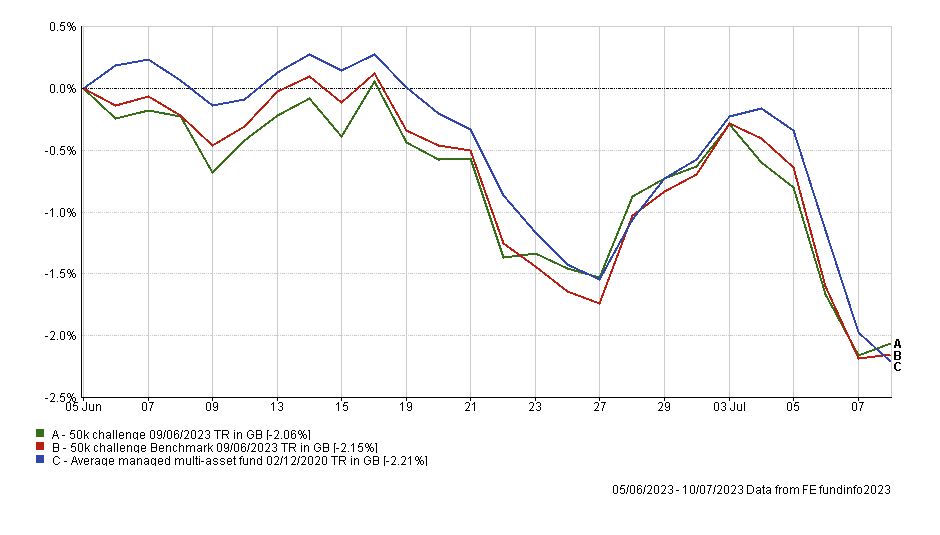
As the chart above shows, my portfolio continues to outperform its benchmarks over the last 8 years. Meanwhile since my last review, my portfolio has marginally beat its benchmarks, during a difficult period for UK investors.

Before I move on to looking at the performance of individual funds within my portfolio it's worth looking at the chart below which shows the return for key stock markets since my last review, taking into account the stronger pound as well. Or in other words, the chart is reflective of what UK investors experienced when investing in equities over the last month.
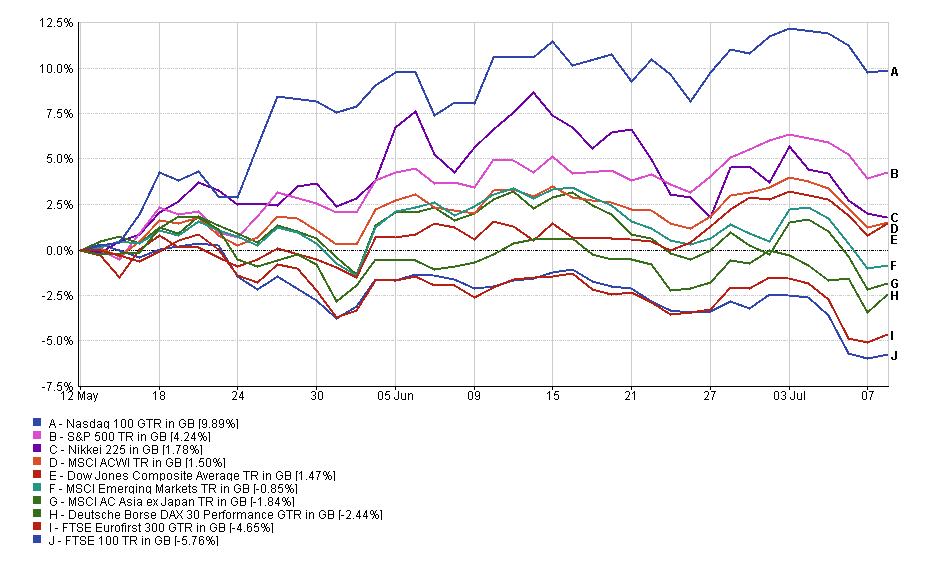
As I highlighted in July's monthly newsletter, the performance of equity markets has reflected the divergence in outlook for respective central bank monetary policy. Those central banks that are deemed the furthest from easing monetary policy have struggled in recent months. If you factor in the effect of a stronger pound, which is also partly a function of a more hawkish outlook for the Bank of England (BOE), June was a difficult month unless you were invested solely in US equities or cash.
With the above chart in mind, the table below shows the individual performance of each fund in my portfolio since the 5th June (when I carried out my last review).
|
Fund |
Performance % since last review on 5th June |
| Cash | 0.24 |
| BNY Mellon Global Dynamic Bond | -0.35 |
| abrdn High Yield Bond | -0.64 |
| Thesis TM Tellworth UK Select | -1.11 |
| Fundsmith Equity | -1.54 |
| TB Saracen Global Income & Growth | -1.94 |
| BNY Mellon Multi-Asset Balanced | -2.82 |
| M&G Global Dividend | -2.99 |
| TB Evenlode Global Income | -3.49 |
| IFSL Marlborough Extra Income | -4.0% |
| CT European Select | -4.1 |
| Fidelity Index Japan | -4.12 |
| AXA Framlington UK Equity Income | -4.44 |
| iShares Physical Gold ETC | -5.01 |
As you can see, the performance of the individual funds within my portfolio can largely be explained by the market moves shown in the chart. Gold props up the performance table as a result of the currency exposure when investing in the gold ETF (a stronger pound hampered performance). Funds heavily exposed to UK equities (AXA Framlington UK Equity Income and IFSL Marlborough Extra Income) performed poorly, although AXA Framlington UK Equity Income was still one of the best performing UK Equity Income funds during the month. In recent months, momentum has weakened for UK equities as the market has become more negative on the outlook for the UK economy. Elsewhere, funds with high European exposure also lagged, while those with significant US equity exposure performed strongest (i.e. those funds from the Global and Global Equity Income sectors). Meanwhile cash and bonds were the best performing asset classes.
Before I get into any fund changes I will make this month, as usual the table below shows which funds within my portfolio are in the current BOTB or BFBS tables and which are not. Those funds in blue are still in the BOTB while those in orange are not in the BOTB but remain in the BFBS list. Meanwhile, any funds in red have dropped out of both shortlists.
| Fund | Allocation | Risk | Sector | ISIN |
| abrdn High Yield Bond | 12 | Low | Sterling High Yield | GB00B79RR984 |
| AXA Framlington UK Equity Income | 5 | Medium | UK Equity Income | GB00B7KBNV36 |
| BNY Mellon Global Dynamic Bond | 6 | Low | Targeted Absolute Return | GB00B8K10865 |
| BNY Mellon Multi-Asset Balanced | 6.5 | Medium | Mixed Investment 40-85% Shares | GB00B8K9JZ06 |
| Cash | 7 | Low | ||
| CT European Select | 8.5 | High | Europe Excluding UK | GB0001529345 |
| Fidelity Index Japan | 5 | Medium | Japan | GB00BHZK8872 |
| Fundsmith Equity | 10 | Medium | Global | GB00B4Q5X527 |
| IFSL Marlborough Extra Income | 6.5 | Medium | Mixed Investment 40-85% Shares | GB0005662894 |
| iShares Physical Gold ETC | 5 | Medium | Commodity & Energy ETF | IE00B4ND3602 |
| M&G Global Dividend | 7 | Medium | Global Equity Income | GB00B46J9127 |
| TB Evenlode Global Income | 6.5 | Medium | Global Equity Income | GB00BF1QMV61 |
| TB Saracen Global Income & Growth | 9.5 | Medium | Global Equity Income | GB00B5B35X02 |
| Thesis TM Tellworth UK Select | 5.5 | Low | Targeted Absolute Return | GB00BNY7YM73 |
The good news is that only 3 funds have fallen out of the BOTB and BFBS tables and are coloured in red. These are:
- Fundsmith Equity
- IFSL Marlborough Extra Income
- BNY Mellon Multi-Asset Balanced
Recently I have increased the diversification of my portfolio which is why, despite a number of holdings falling 4% during June, overall the portfolio value only fell just 2% which was in line with its benchmarks and therefore the wider market. The portfolio benefited from the fact that the worst performers (with the exception of CT European Select) individually only accounted for around 5% of my portfolio's assets. In addition, the top performers during the month were largely those funds with the largest allocation in my portfolio.
While only three funds have fallen out of the 80-20 Investor lists I plan to make a couple of minor changes this month with the aim of reducing my UK equity exposure, a move we saw in this month's BOTB. IFSL Marlborough Extra Income has been an awful performer over the two months since I've held it, as shown in the chart below which compares its performance versus its peer group average.
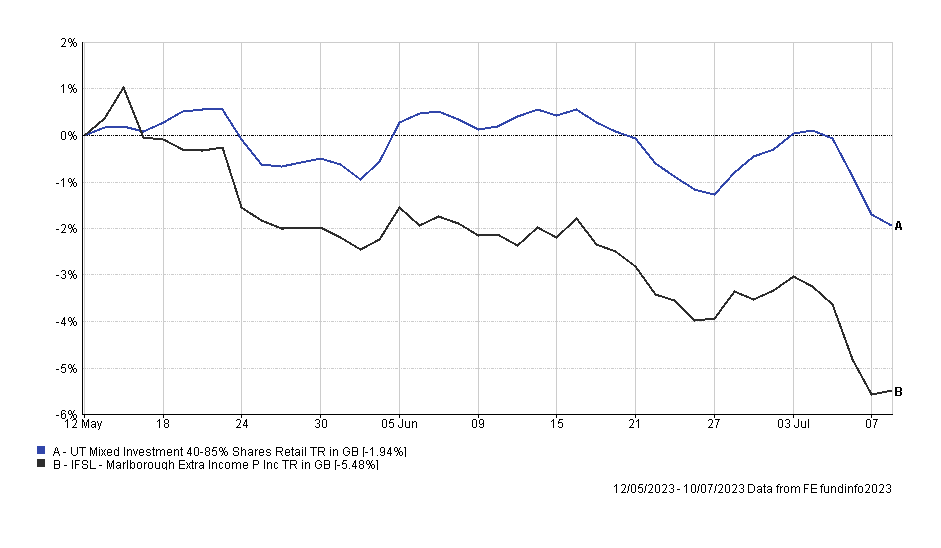
In any event, clearly the high UK equity exposure in my portfolio has been a drag on recent performance so by selling out of IFSL Marlborough Extra Income now, rather than hoping for a turnaround, I will reduce my portfolio's UK equity exposure if I reinvest the proceeds in overseas equities.
The two other funds that are coloured red above are BNY Mellon Multi-Asset Balanced and Fundsmith Equity. The former is a new entrant to my portfolio and it's too early to judge its position in my portfolio. Fundsmith Equity was the best performing equity fund in my portfolio over the last month and it was in the BFBS as recently as June. So for now I will leave the fund within my portfolio and review its position in a few weeks' time when August's BOTB is published.
As an aside, two funds were given a stay of execution last month, namely M&G Global Dividend and TB Saracen Global Income & Growth and although they are down over the last month, along with pretty much most equity funds out there, they were among the better performing equity funds within my portfolio. So far the decision seems justified.
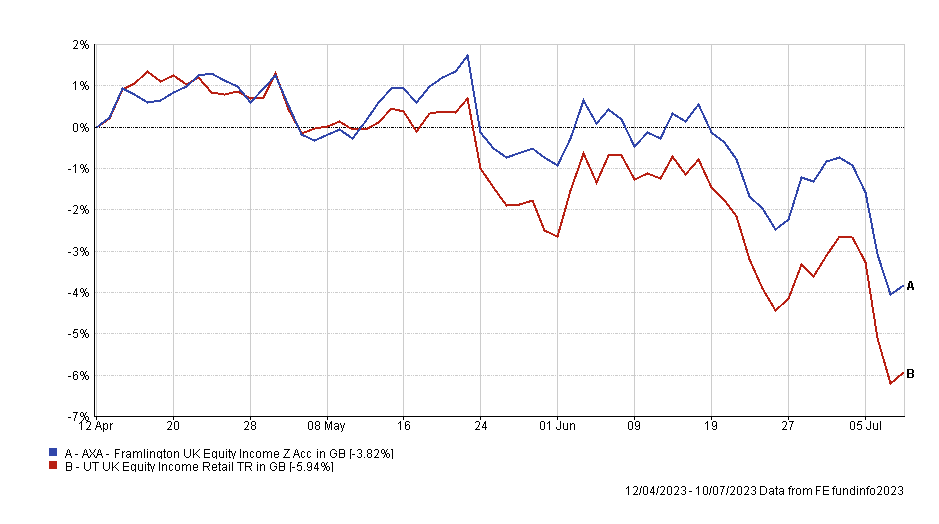
The other funds within my portfolio remain in the BOTB and BFBS tables, but I do plan to make one final change and that is to switch out of the AXA UK Equity Income fund. While the fund has significantly outperformed its peers over that time, as shown below I want to reduce the significant UK equity exposure in my portfolio further. The AXA fund is a relatively small holding but by switching out of the fund into a global equity fund it will bring my UK equity exposure down further to around 11%.
Fund switches
- 100% out of IFSL Marlborough Extra Income and 100% into Troy Asset Management Ltd Trojan Global Equity
- 100% out of AXA Framlington UK Equity Income and 50% into BNY Mellon Global Dynamic Bond and 50% into Troy Asset Management Ltd Trojan Global Equity
The fund changes mean that I have reduced the number of holdings within my portfolio by one while the changes only impact 11-12% of my portfolio. The switches maintain my portfolio's equity exposure at 64% but moves my asset mix so that it is more in line with that of the BOTB (i.e. less UK equity exposure). The European equity exposure is still higher than the BOTB but I will review this next time.
I have chosen the Troy Asset Management Ltd Trojan Global Equity fund because it is in the BOTB and has been a regular in recent months. I have also chosen to put part of the AXA proceeds into the BNY Mellon Global Dynamic Bond to bolster and diversify the low-risk part of my portfolio further. Don't forget that the IFSL Marlborough Extra Income which I replaced had a small bond exposure (around 20% of its assets).
My portfolio
My portfolio now looks like this:
| Fund | Allocation | Risk | Sector | ISIN |
| abrdn High Yield Bond | 12 | Low | Sterling High Yield |
GB00B79RR984
|
| BNY Mellon Global Dynamic Bond | 8.5 | Low | Targeted Absolute Return | GB00B8K10865 |
| BNY Mellon Multi-Asset Balanced | 6 | Medium | Mixed Investment 40-85% Shares | GB00B8K9JZ06 |
| Cash | 7.5 | Low | ||
| CT European Select | 8.5 | High | Europe Excluding UK | GB0001529345 |
| Fidelity Index Japan | 5 | Medium | Japan |
GB00BHZK8872
|
| Fundsmith Equity | 10 | Medium | Global |
GB00B4Q5X527
|
| iShares Physical Gold ETC | 5 | Medium | Commodity & Energy ETF | IE00B4ND3602 |
| M&G Global Dividend | 7 | Medium | Global Equity Income | GB00B46J9127 |
| TB Evenlode Global Income | 7 | Medium | Global Equity Income |
GB00BF1QMV61
|
| TB Saracen Global Income & Growth | 9.5 | Medium | Global Equity Income | GB00B5B35X02 |
| Thesis TM Tellworth UK Select | 5.5 | Low | Targeted Absolute Return |
GB00BNY7YM73
|
| Troy Asset Management Ltd Trojan Global Equity | 8.5 | Medium | Global | GB00B0ZJ5S47 |
My Portfolio asset mix
My portfolio asset mix has around 64% exposure to equities. Last month's figures are shown in brackets.
-
- UK Equities 11% (20%)
- North American Equities 23% (18%)
- Asian/Emerging Market Equities 0% (0%)
- Japanese Equities 6% (6%)
- European Equities 20% (20%)
- Chinese equities 0% (0%)
- Other equity 4% (0%)
- Commodities and energy 5% (5%)
- UK Fixed Interest 0% (3%)
- Global Fixed Interest 20% (17%)
- Cash 8% (8%)
- Alternative Investment Strategies 3% (3%)
- Property 0% (0%)
Damien's higher risk and lower risk portfolios
Using the logic described in my post: Update to Damien’s alternative risk portfolios I created hypothetical higher and lower risk versions of my portfolio below:
Lower risk
| Fund | Allocation % |
| abrdn High Yield Bond | 13 |
| BNY Mellon Global Dynamic Bond | 9 |
| BNY Mellon Multi-Asset Balanced | 7 |
| Cash | 9 |
| Fidelity Index Japan | 5 |
| Fundsmith Equity | 11 |
| iShares Physical Gold ETC | 5 |
| M&G Global Dividend | 8 |
| TB Evenlode Global Income | 8 |
| TB Saracen Global Income & Growth | 10 |
| Thesis TM Tellworth UK Select | 6 |
| Troy Asset Management Ltd Trojan Global Equity | 9 |
Higher risk
| Fund | Allocation % |
| BNY Mellon Multi-Asset Balanced | 9 |
| CT European Select | 13 |
| Fidelity Index Japan | 8 |
| Fundsmith Equity | 15 |
| iShares Physical Gold ETC | 8 |
| M&G Global Dividend | 10 |
| TB Evenlode Global Income | 10 |
| TB Saracen Global Income & Growth | 14 |
| Troy Asset Management Ltd Trojan Global Equity | 13 |

£200 Pension Cashback Offer
Make a qualifying deposit or transfer a pension to our partner Interactive Investor.
- Deposit or transfer a pension of at least £20k and you could earn £200 cashback
- Terms and Fees apply, Capital at risk
- New & Existing customers opening a SIPP
- Offer ends 31st July 2026
Before starting your transfer, check you won't lose any valuable benefits (such as guaranteed annuity rates or a lower protected pension age) and find out what exit fees you might have to pay
