

The background to my portfolio
Back in March 2015 I decided to invest £50,000 of my own money using 80-20 Investor. The purpose was twofold, firstly to show how you can use 80-20 Investor to invest and outperform the market with only a few minutes effort every now and then. Secondly, no other investment commentator, journalist or research provider invests their own money for fear of failing. This is a sorry state of affairs and is precisely why I committed to openly running my own portfolio for 80-20 Investor members to see.
Since then I have periodically changed my portfolio using the fund suggestions provided by the 80-20 Investor algorithm and associated research. I always disclose the changes at the time they are made.
Performance update
As is usual in my portfolio reviews, the chart below shows how my portfolio has outperformed since I started the challenge in March 2015. The green line is the performance of my portfolio while the red line is the benchmark showing the average return achieved by professional fund managers given the same asset mix. To accurately calculate this I have used the average return for each sector in which my portfolio invested. The blue line shows what the average multi-asset fund with comparable equity content achieved. In other words, the red line would show the extra performance added by just the asset mix of my portfolio (where I was invested i.e European equities etc) over picking a typical multi-asset fund (the blue line). While the green line (which is my actual performance) shows the impact of being in the right funds at the right time, as identified by the 80-20 Investor algorithm.
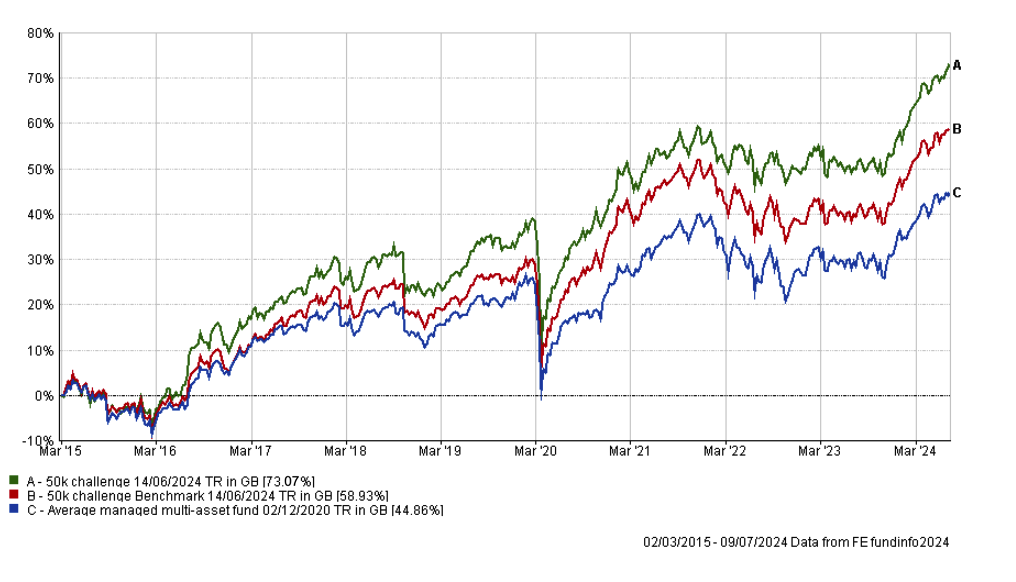
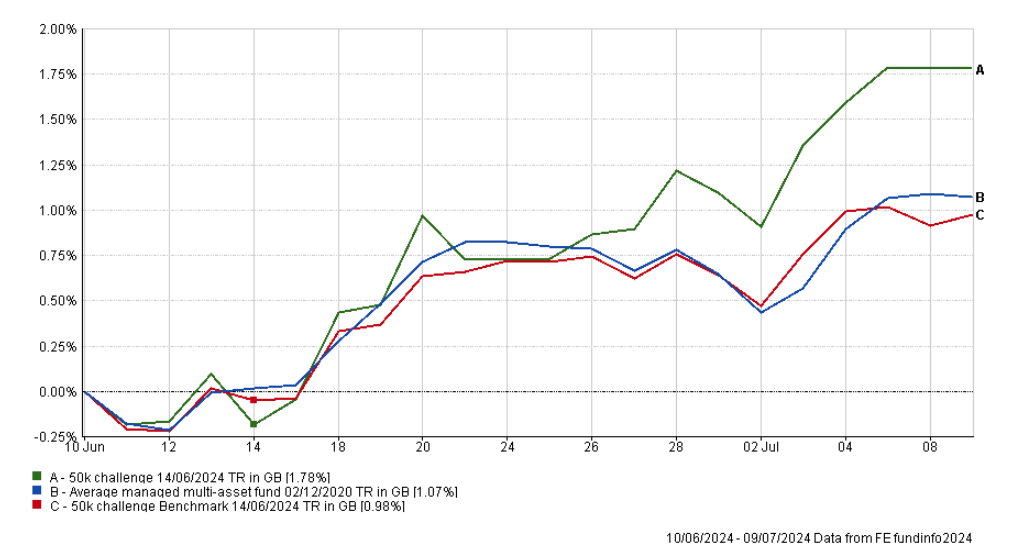
You can see how my portfolio continues to push higher and sits at a new all-time high while extending its lead over its benchmarks. The chart below shows how my portfolio significantly outperformed its benchmarks since my last review a month ago, which is great to see.
Turning my attention to how individual funds performed over the last month, as you can see from the table below, only two funds from my portfolio did not make money over the last month.
| Name | % return over the last month (since June's review) |
| T. Rowe Price US Large Cap Growth Equity | 5.80 |
| Liontrust India | 4.88 |
| Artemis Global Income | 3.58 |
| Artemis US Select | 3.25 |
| iShares Physical Gold ETC | 2.10 |
| BNY Mellon Multi-Asset Balanced | 1.20 |
| Fidelity Index Japan | 1.19 |
| Ninety One UK Special Situations | 0.96 |
| Schroder Strategic Credit | 0.73 |
| abrdn High Yield Bond | 0.61 |
| Thesis TM Tellworth UK Select | 0.07 |
| WS Saracen Global Income and Growth | -0.84 |
| Janus Henderson European Mid and Large Cap | -1.82 |
Liontrust India was among the top performers once again, joined by those funds with significant US equity exposure. At the other end of the scale my sole European equity fund struggled, however it only accounts for around 5% of my total allocation so the impact was muted. Interestingly, while the performance of Janus Henderson European Mid and Large Cap (which I only added last month) was disappointing, the fund it replaced (Artemis European Select) fared marginally worse, falling -1.91%.
Meanwhile, WS Saracen Global Income and Growth endured another tricky month due to the fund having almost 50% exposure to European equities, unlike most global income funds. Those of you who have been reading my newsletters will be aware of how political instability emanating from France has negatively impacted European equities of late.
As usual, the table below shows which funds within my portfolio are in the current BOTB or BFBS tables and which are not. Those funds in blue are still in the BOTB while those in orange are not in the BOTB but remain in the BFBS list. Meanwhile, any funds in red have dropped out of both shortlists.
| Fund | Allocation | Risk | Sector | ISIN |
| abrdn High Yield Bond | 14 | Lower | Sterling High Yield | GB00B79RR984 |
| Artemis Global Income | 11 | Medium | Global Equity Income | GB00B5N99561 |
| Artemis US Select | 5 | Medium | North America | GB00BMMV5105 |
| BNY Mellon Multi-Asset Balanced | 8 | Medium | Mixed Investment 40-85% Shares | GB00B8K9JZ06 |
| Fidelity Index Japan | 5.5 | Medium | Japan | GB00BHZK8872 |
| iShares Physical Gold ETC | 5.5 | Medium | Commodity & Energy ETF | IE00B4ND3602 |
| Janus Henderson European Mid & Large Cap | 5 | Higher | Europe Excluding UK | GB00BJ0LFG67 |
| Liontrust India | 6 | Higher | India/Indian Subcontinent | GB00B1L6DV51 |
| Ninety One UK Special Situations | 5 | Higher | UK All Companies | GB00B1XFJS91 |
| Schroder Strategic Credit | 8 | Lower | Sterling Strategic Bond | GB00BJZ2ZC09 |
| T. Rowe Price US Large Cap Growth Equity | 11 | Higher | North America | GB00BD5FHW12 |
| Thesis TM Tellworth UK Select | 5.5 | Lower | Targeted Absolute Return | GB00BNY7YM73 |
| WS Saracen Global Income & Growth | 10.5 | Medium | Global Equity Income | GB00B5B35X02 |
There are only two funds that have fallen out of the BOTB and BFBS tables this month (and are coloured in red). Perhaps this shouldn't be a surprise given how well my portfolio is performing in the current environment. The two funds in question are:
- BNY Mellon Multi-Asset Balanced
- WS Saracen Global Income & Growth
You may recall that last month Thesis TM Tellworth UK Select was in the 'red list' and was given a stay of execution as it was the top-performing lower risk fund within my portfolio during April/May. That proved a wise move as the fund has reentered the BOTB this month, something that I anticipated was likely.
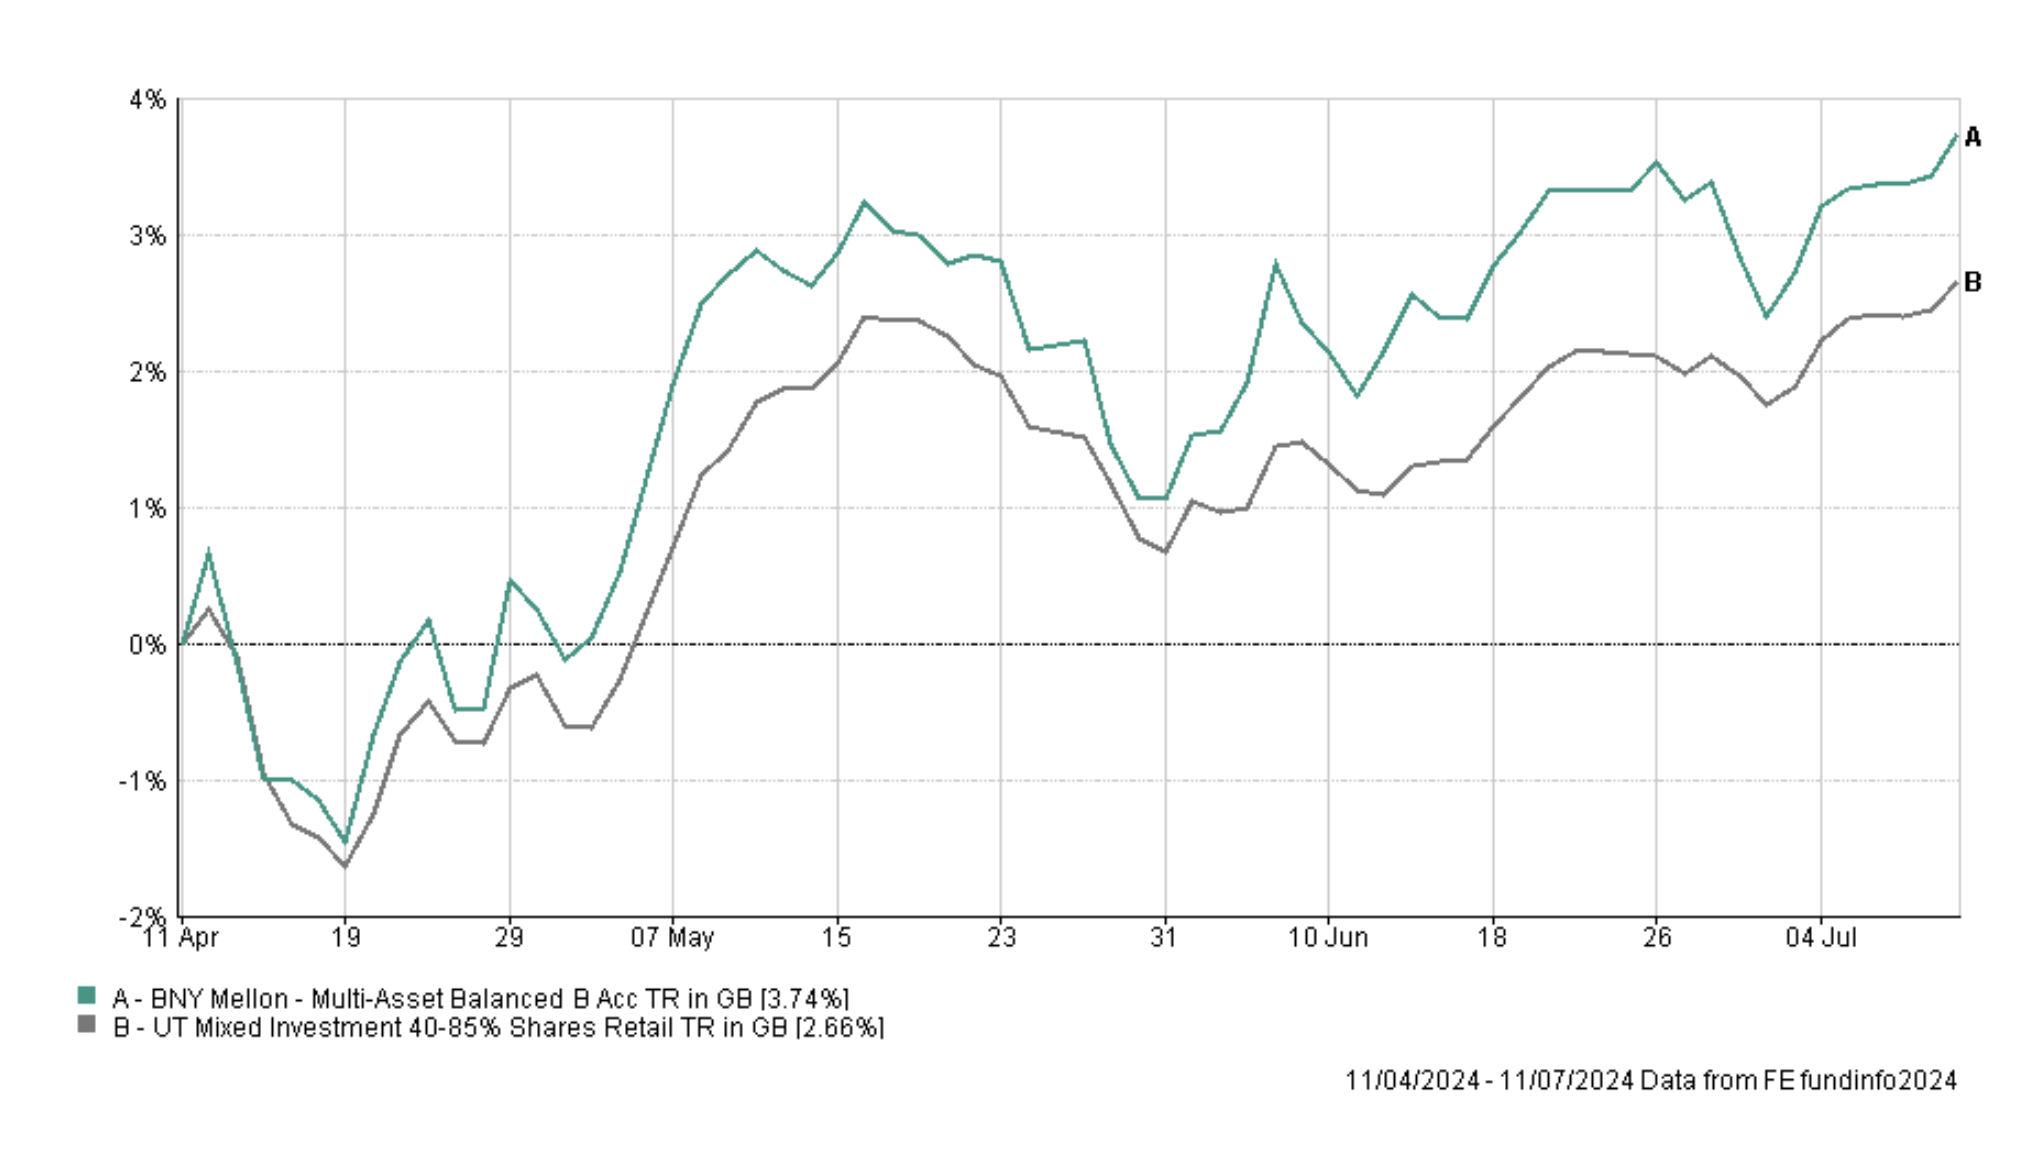
BNY Mellon Multi-Asset Balanced was also given a stay of execution last time around. BNY Mellon Multi-Asset Balanced is a fund that only recently dropped off the 80-20 Investor consistent funds list (and it only narrowly missed out on being included) but its recent performance has remained strong. The fund remains in the top quartile of the performance tables over almost every timeframe for the Mixed Investment 40-85% Shares sector. Yet again none of its peers make the BOTB list this month and those that make the BFBS list are either not available on my platform or have not outperformed the fund over the short term. The chart below shows just how much the fund has outperformed its sector average over the last 3 months.
As long-term 80-20 Investor members know, I don't make knee-jerk reactions and while I am looking to potentially replace BNY Mellon Multi-Asset Balanced it continues to perform well. So again, I will leave it be, especially given the performance of the portfolio as a whole. There really is little need to make unnecessary changes.
The only other 'red' fund this month is WS Saracen Global Income & Growth. The fund has only dropped out of the BOTB and BFBS tables this month, and while I might usually look to give it time, its performance over the last two months has been disappointing as shown below. While it was one of only two funds within my portfolio to lose money over the last month, it was the worst performing fund the previous month, having fallen over 4%. As such the poor performance versus its peers is showing little signs of turning around and the fund is the biggest drag on my portfolio's performance at the moment.
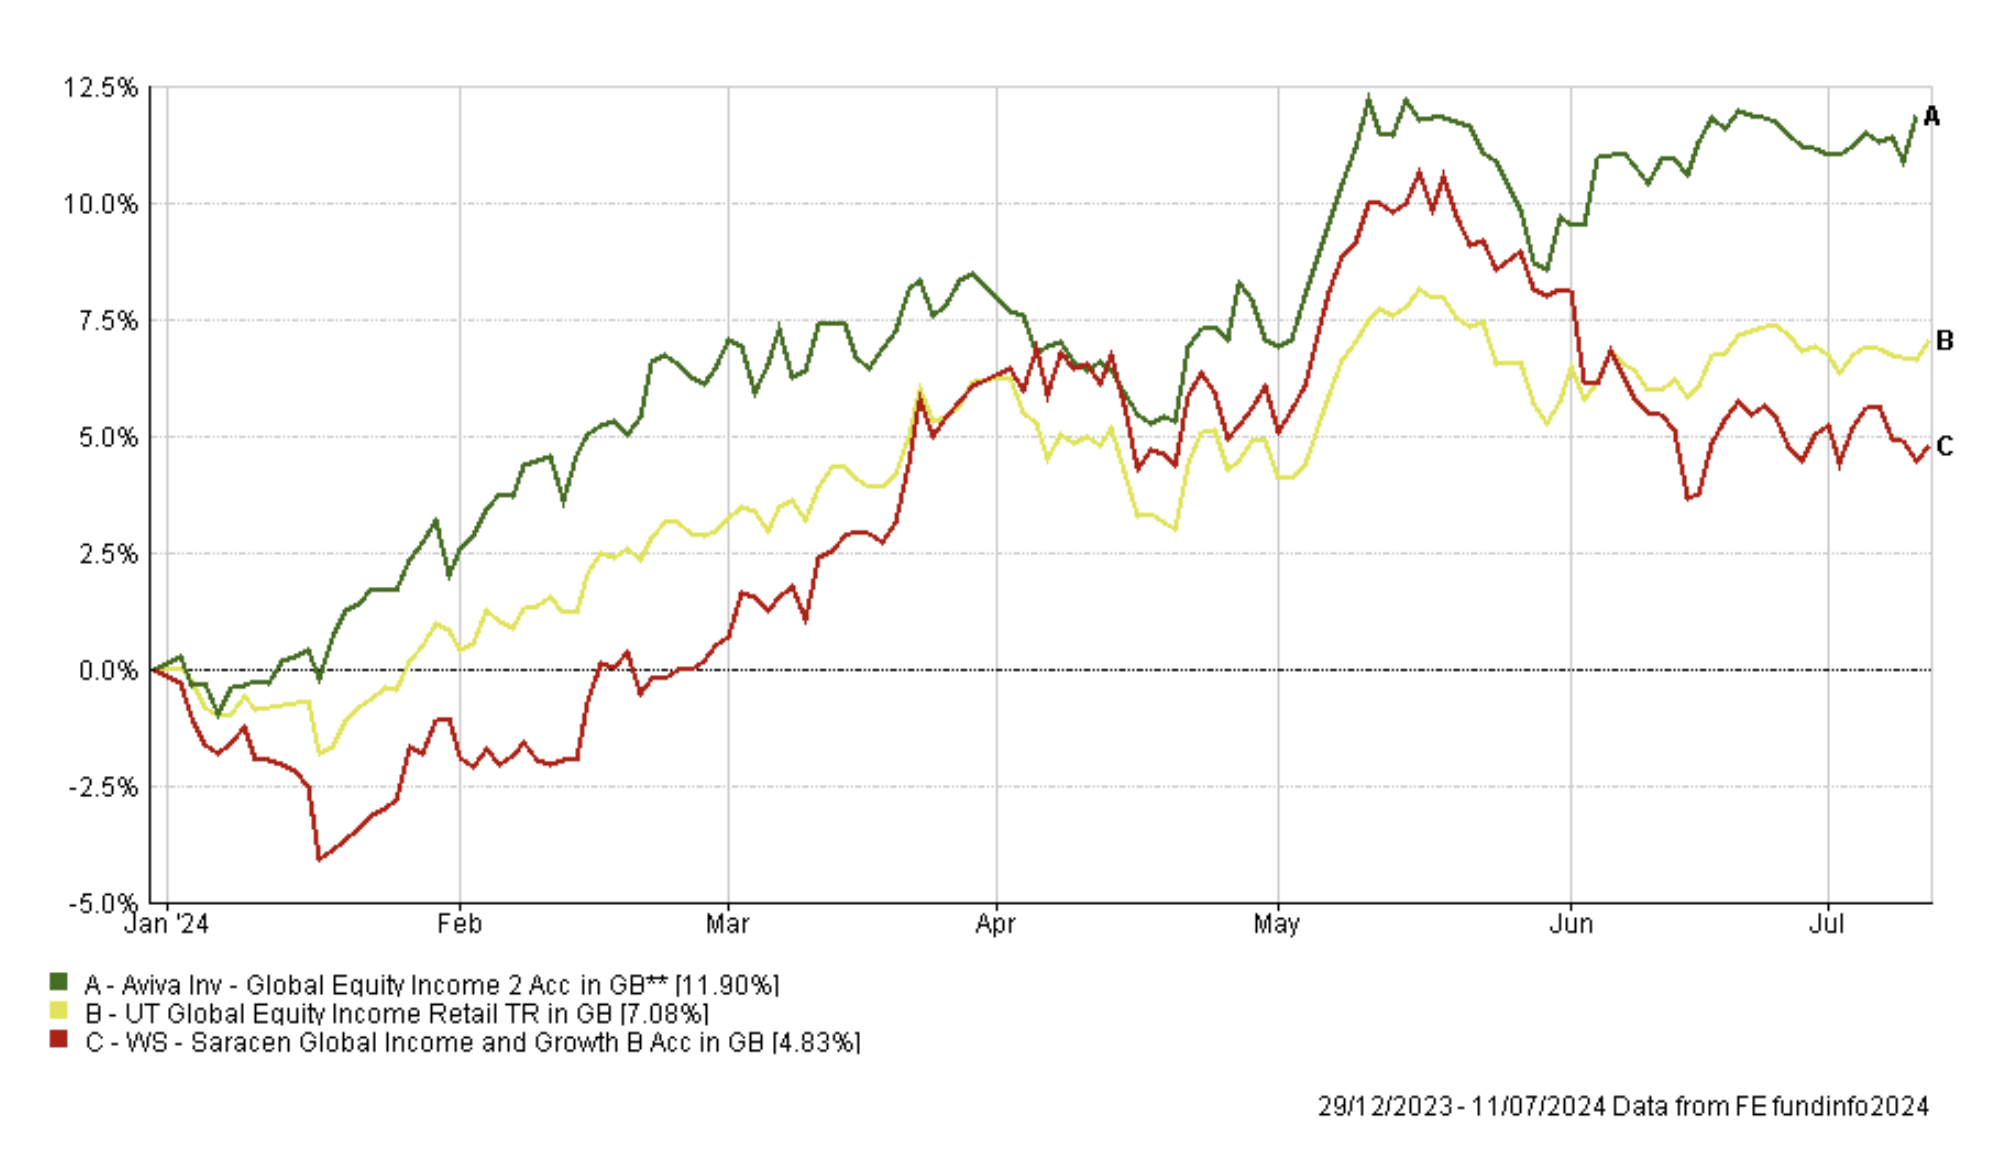
I have therefore decided to make a like-for-like switch, replacing it with Aviva Global Equity Income from this month's BOTB.
It means that the asset mix of my portfolio remains largely unchanged, which I am happy with. For the moment my asset mix differs from that of the BOTB, which this month has taken on some emerging market exposure and more US equity exposure at the expense of European equity exposure. However, I am happy to let things run for a bit before making any more changes.
Fund switches
100% out of WS Saracen Global Income & Growth and 100% into the Aviva Inv Global Equity Income
My portfolio
My portfolio looks like this:
| Fund | Allocation | Risk | Sector | ISIN |
| abrdn High Yield Bond | 14 | Lower | Sterling High Yield | GB00B79RR984 |
| Artemis Global Income | 11 | Medium | Global Equity Income | GB00B5N99561 |
| Artemis US Select | 5 | Medium | North America | GB00BMMV5105 |
| BNY Mellon Multi-Asset Balanced | 8 | Medium | Mixed Investment 40-85% Shares | GB00B8K9JZ06 |
| Aviva Inv Global Equity Income | 10 | Medium | Global Equity Income | GB0030441918 |
| Fidelity Index Japan | 5.5 | Medium | Japan | GB00BHZK8872 |
| iShares Physical Gold ETC | 5.5 | Medium | Commodity & Energy ETF | IE00B4ND3602 |
| Janus Henderson European Mid & Large Cap | 5 | Higher | Europe Excluding UK | GB00BJ0LFG67 |
| Liontrust India | 6 | Higher | India/Indian Subcontinent | GB00B1L6DV51 |
| Ninety One UK Special Situations | 5 | Higher | UK All Companies | GB00B1XFJS91 |
| Schroder Strategic Credit | 8 | Lower | Sterling Strategic Bond | GB00BJZ2ZC09 |
| T. Rowe Price US Large Cap Growth Equity | 11.5 | Higher | North America | GB00BD5FHW12 |
| Thesis TM Tellworth UK Select | 5.5 | Lower | Targeted Absolute Return | GB00BNY7YM73 |
My Portfolio asset mix
My portfolio asset mix has approximately 65% exposure to equities. Last month's figures are shown in brackets.
-
- UK Equities 14% (12%)
- North American Equities 26% (25%)
- Asian/Emerging Market Equities 7% (6%)
- Japanese Equities 8% (7%)
- European Equities 12% (13%)
- Other equity 0% (2%)
- Commodities and energy 5% (5%)
- UK Fixed Interest 5% (4%)
- Global Fixed Interest 18% (18%)
- Cash 1% (1%)
- Alternative Investment Strategies 4% (7%)
Damien's higher risk and lower risk portfolios
Using the logic described in my post: Update to Damien’s alternative risk portfolios I created hypothetical higher and lower risk versions of my portfolio below:
Lower risk
| Fund | Allocation % |
| abrdn High Yield Bond | 19 |
| Artemis Global Income | 15 |
| Artemis US Select | 7 |
| BNY Mellon Multi-Asset Balanced | 11 |
| Aviva Inv Global Equity Income | 13 |
| Fidelity Index Japan | 8 |
| iShares Physical Gold ETC | 8 |
| Schroder Strategic Credit | 11 |
| Thesis TM Tellworth UK Select | 8 |
Higher risk
| Fund | Allocation % |
| Artemis Global Income | 15 |
| Artemis US Select | 7 |
| BNY Mellon Multi-Asset Balanced | 11 |
| Aviva Inv Global Equity Income | 14 |
| Fidelity Index Japan | 8 |
| iShares Physical Gold ETC | 8 |
| Janus Henderson European Mid & Large Cap | 7 |
| Liontrust India | 8 |
| Ninety One UK Special Situations | 7 |
| T. Rowe Price US Large Cap Growth Equity | 15 |

£200 Pension Cashback Offer
Make a qualifying deposit or transfer a pension to our partner Interactive Investor.
- Deposit or transfer a pension of at least £20k and you could earn £200 cashback
- Terms and Fees apply, Capital at risk
- New & Existing customers opening a SIPP
- Offer ends 31st July 2026
Before starting your transfer, check you won't lose any valuable benefits (such as guaranteed annuity rates or a lower protected pension age) and find out what exit fees you might have to pay
