

The background to my portfolio
Back in March 2015 I decided to invest £50,000 of my own money using 80-20 Investor. The purpose was twofold, firstly to show how you can use 80-20 Investor to invest and outperform the market with only a few minutes effort every now and then. Secondly, no other investment commentator, journalist or research provider invests their own money for fear of failing. This is a sorry state of affairs and is precisely why I committed to openly running my own portfolio for 80-20 Investor members to see.
Since then I have periodically changed my portfolio using the fund suggestions provided by the 80-20 Investor algorithm and associated research. I always disclose the changes at the time they are made.
Performance update
As is usual in my portfolio reviews, the chart below shows how my portfolio has outperformed since I started the challenge in March 2015, which is five years ago. The green line is the performance of my portfolio while the red line is the benchmark showing the average return achieved by professional fund managers given the same asset mix. To accurately calculate this I have used the average return for each sector in which my portfolio invested. The blue line shows what the average multi-asset fund with comparable equity content achieved. In other words, the red line would show the extra performance added by just the asset mix of my portfolio (where I was invested i.e European equities etc) over picking a typical multi-asset fund (the blue line). While the green line (which is my actual performance) shows the impact of being in the right funds at the right time, as identified by the 80-20 Investor algorithm.
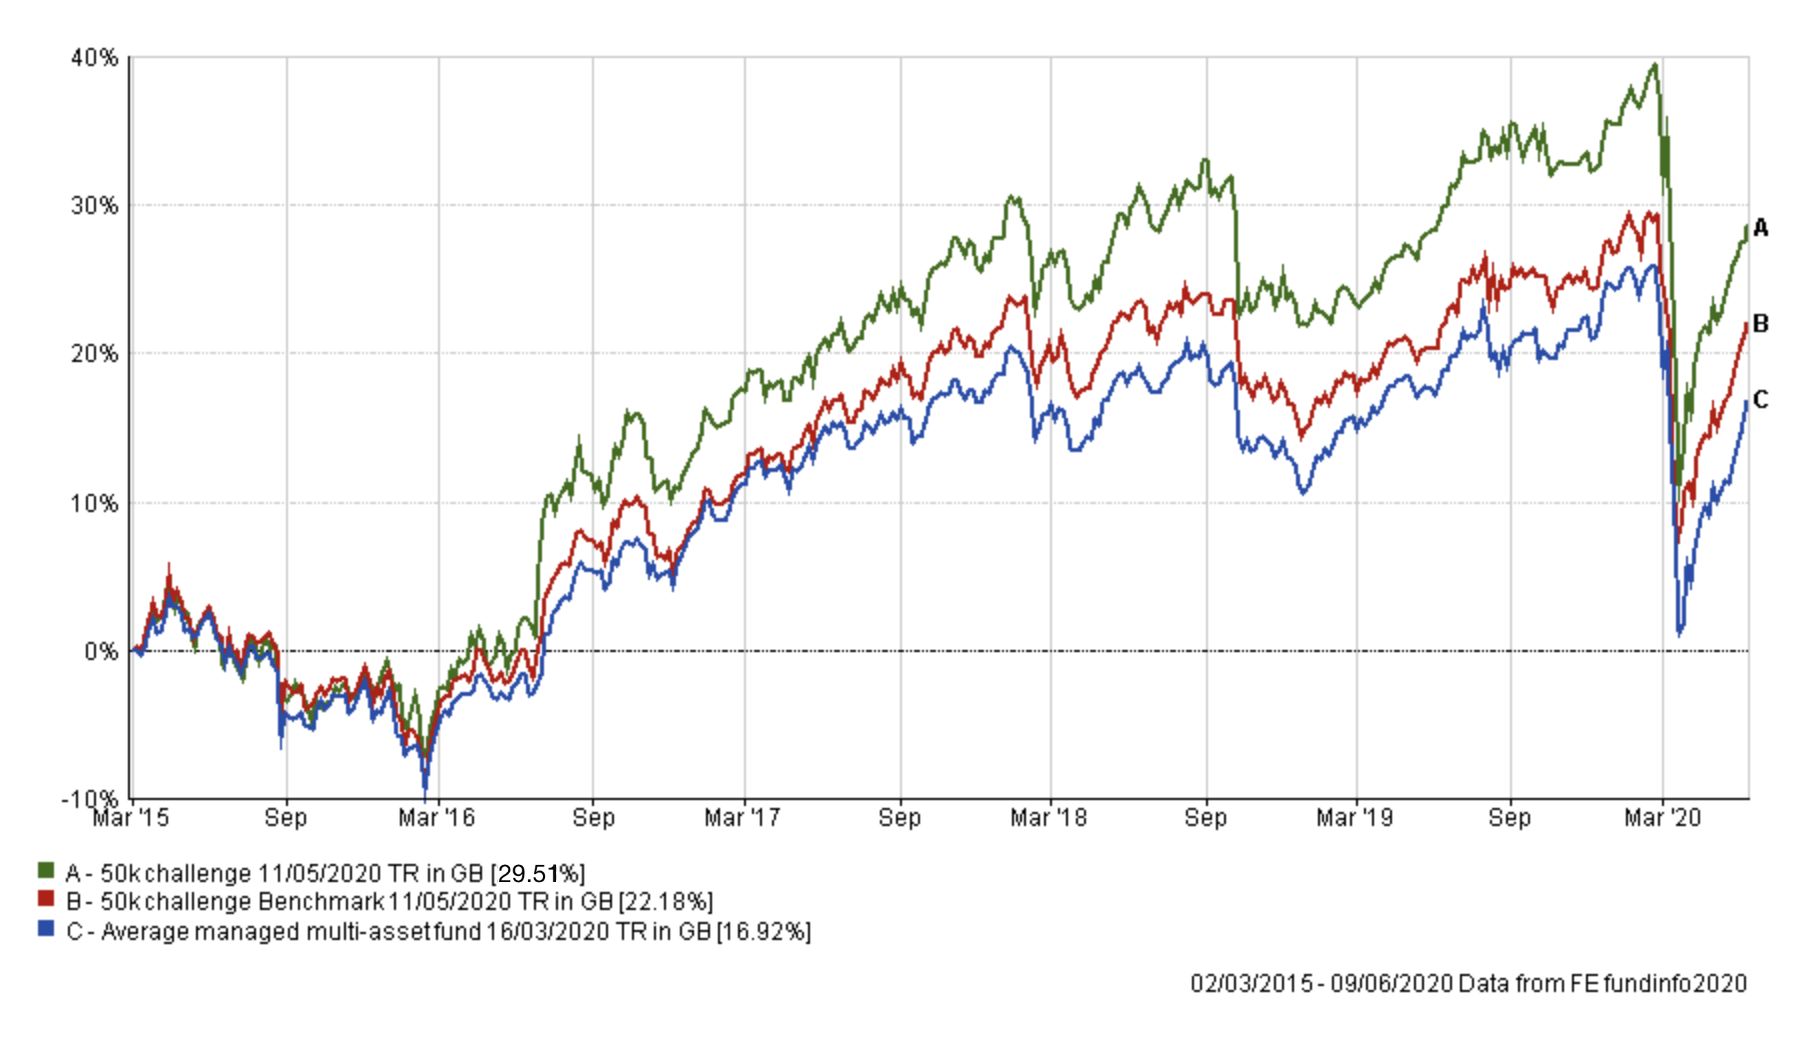
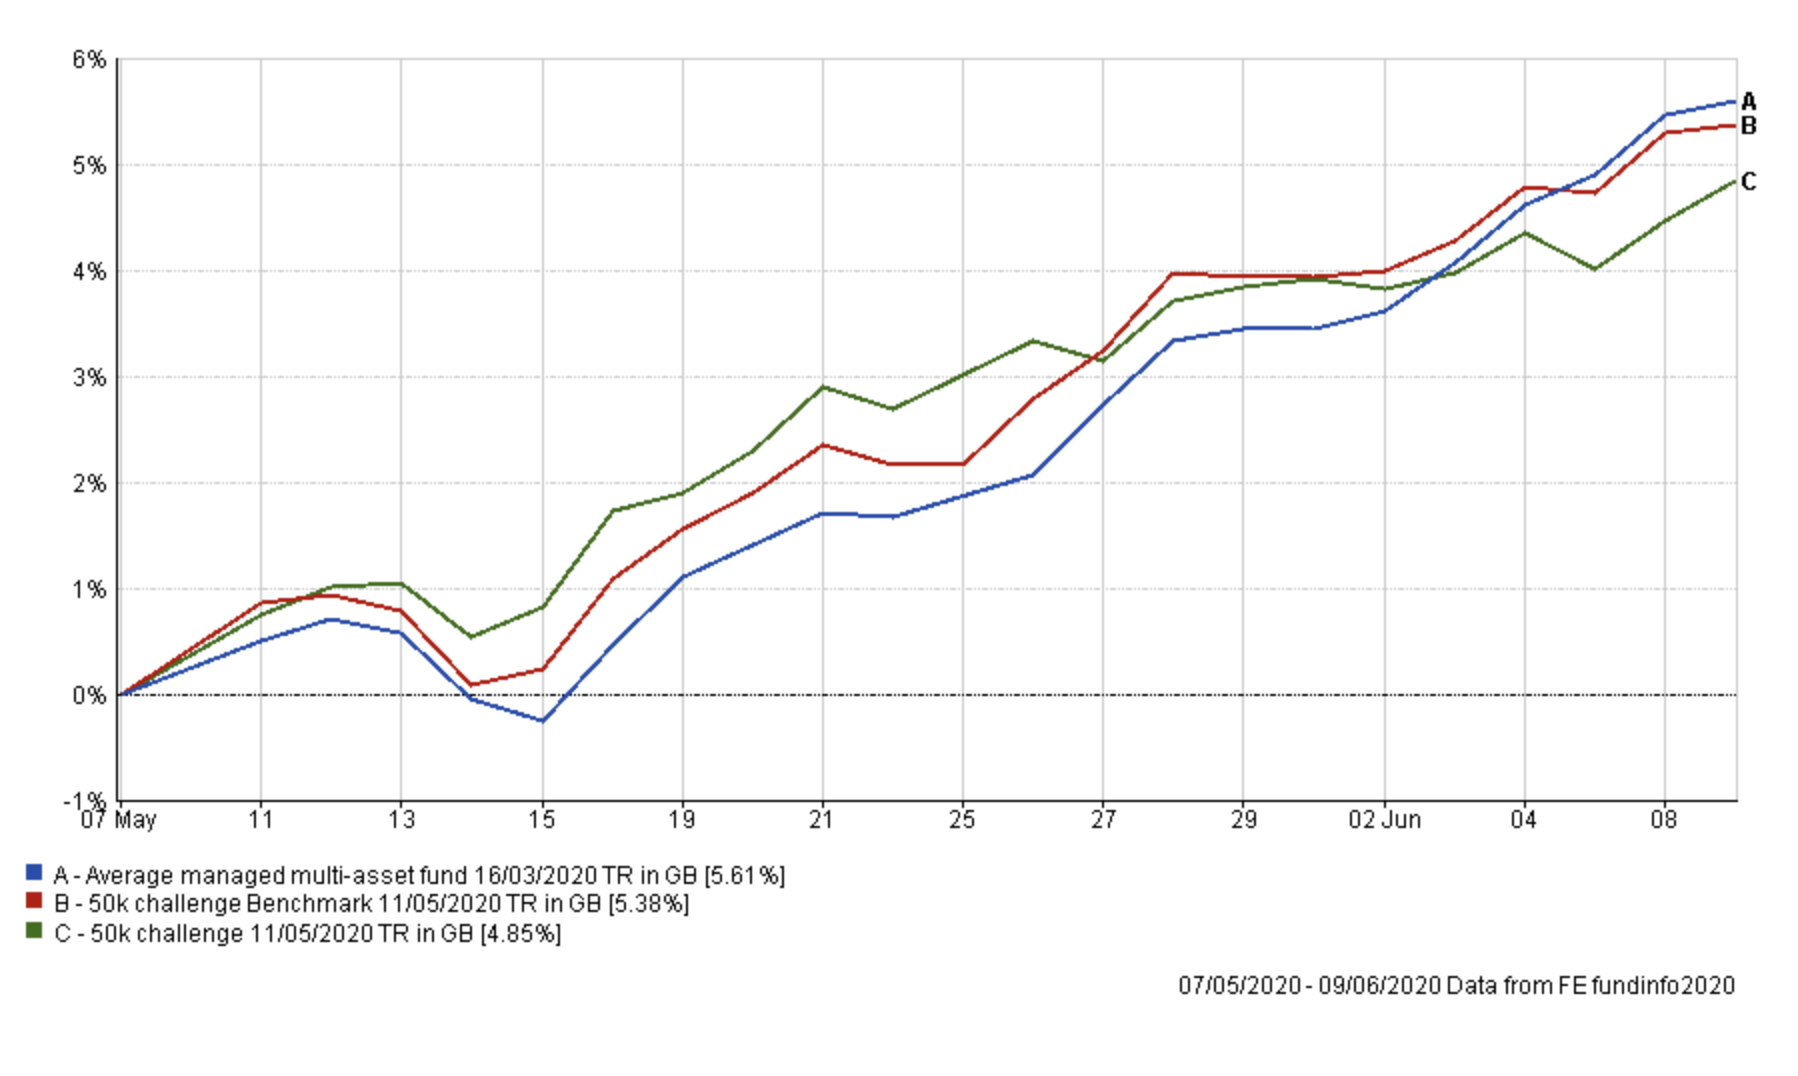
My portfolio continues to outperform its benchmarks since inception. The chart below shows the performance of my portfolio versus its benchmarks since my portfolio review a month ago Initially my portfolio outperformed during the early part of May until the benchmarks played catchup.
I thought it would be an interesting exercise to look at how my portfolio would have performed since the start of the year (and across the recent sell-off) had I not made any changes during the winter period versus how it actually performed. The changes were fairly minor, slightly reducing my equity exposure and then moving out of bonds when the bond market was imploding and back in again once the dust had settled. The chart below shows this comparison with my actual portfolio in green and my portfolio at the start of February in orange.
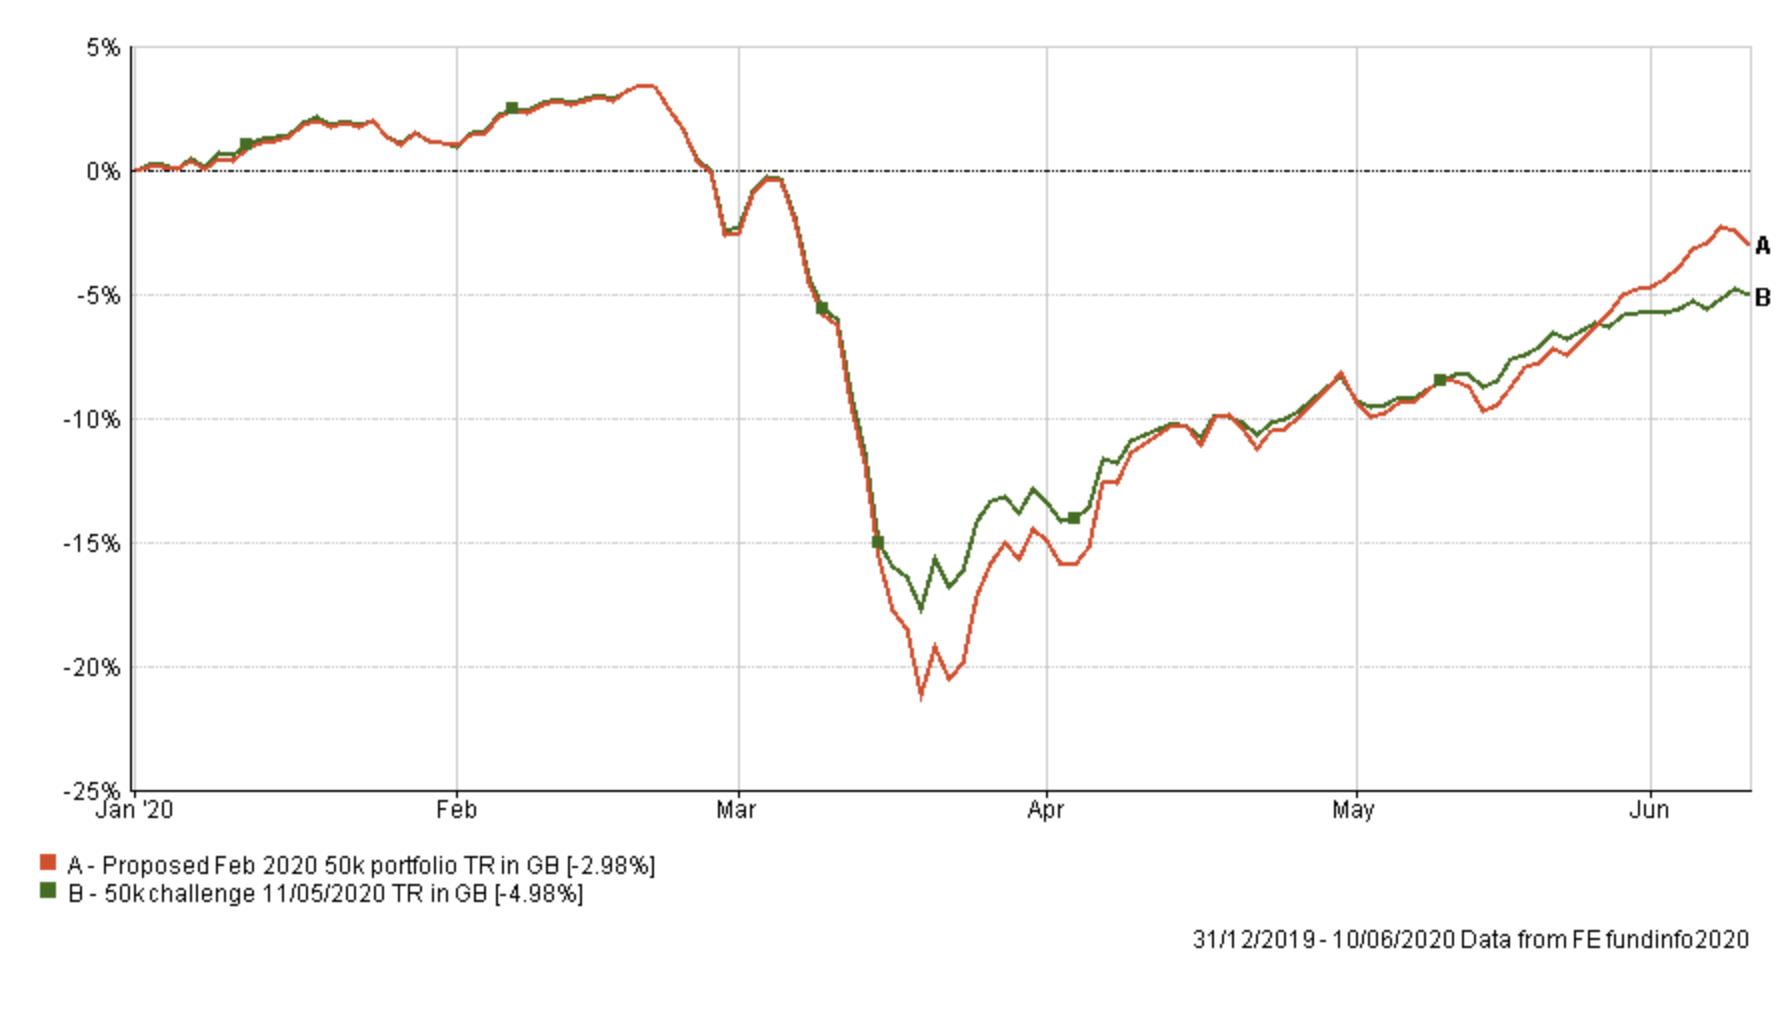
You can see how the changes significantly arrested the descent of the portfolio. Had I made no changes at all my portfolio would have been down as much as 21.13% versus -17.7%. Don't forget at the March low, there was the realistic chance that the market could have fallen even further. With hindsight, we know that the market rebounded. Yet despite the rebound had I maintained my portfolio throughout (the orange line) you can see that the portfolio would have still lagged mine up until the end of May, when equity markets finally burst higher. Yet despite this the 'do nothing portfolio' is only 1.93% ahead of my portfolio despite the higher investment risk the 'do nothing portfolio' possesses.
But what would have happened had the market instead crashed further? In such a hypothetical situation, my portfolio was positioned to provide much more protection if we saw an exact repeat of the recent sell-off. Back-tested over the same period my current asset mix would have performed as shown by the purple line below. Of course, history never exactly repeats.
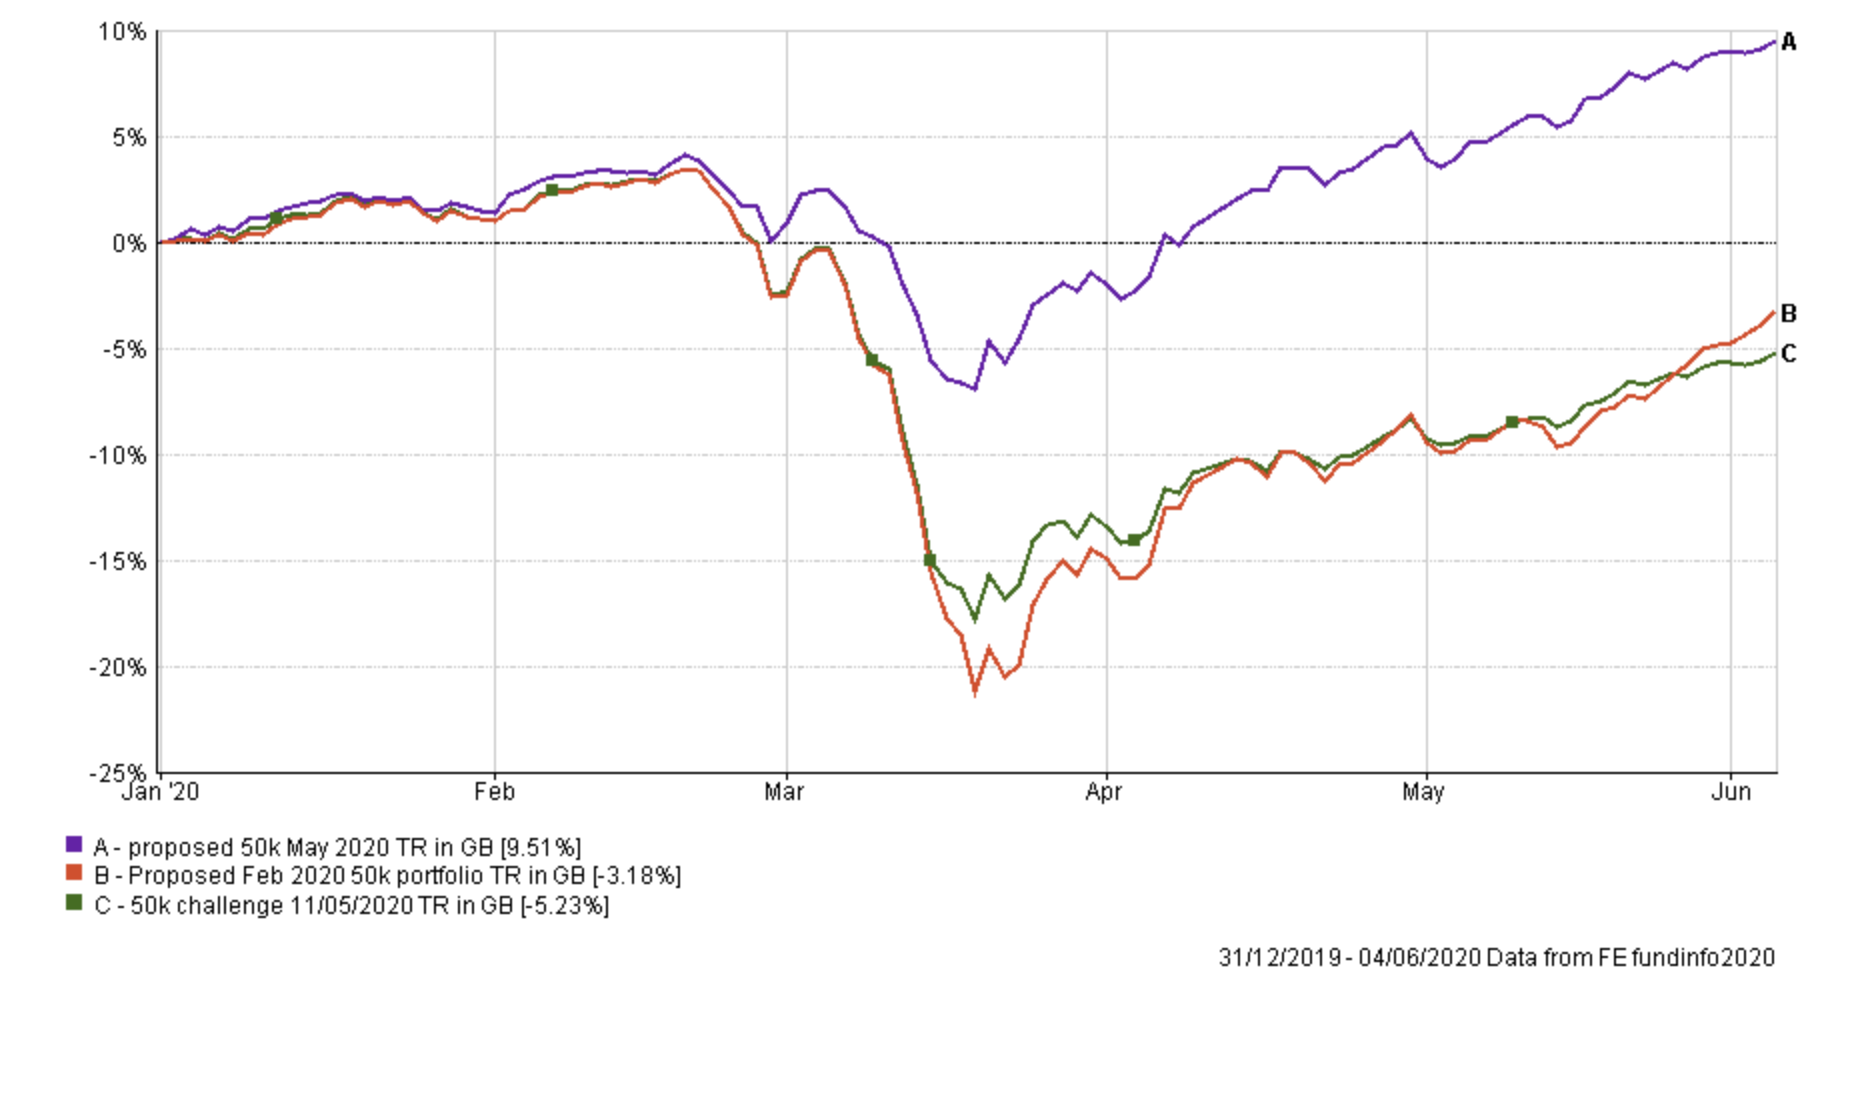
The key point of the exercise is to highlight that my portfolio has been positioned to minimise the potential downside while still enjoying the upside. It worked much like insurance against a potential collapse of equity markets, in that there is always a cost. It is a demonstration of managing risk versus return.
As we move into June, equity markets have turned bullish whether or not it is justified by the economic fundamentals. For example, the 10-month moving average indicator gave a positive signal at the start of the month alongside other indicators that have turned increasingly bullish. However, no indicator is infallible and investment markets don't always make sense. We can only take account of the information in front of us, remain objective and act accordingly.
With that thought in mind, the table below shows which funds within my portfolio are in the current BOTB or BFBS tables and which are not. Those funds in green are still in the BOTB while those in yellow are not in the BOTB but remain in the BFBS list. Meanwhile, any funds in red have dropped out of both shortlists.
| Name | Allocation % (rounded) | Risk | Sector | ISIN Code |
| Fidelity European | 4.5 | Medium | Europe Excluding UK | GB00BFRT3504 |
| Jupiter Japan Income | 6 | High | Japan | GB00B0HZTZ55 |
| Schroder Global Healthcare | 8 | Medium | Global | GB00B76V7Q08 |
| Baillie Gifford Long Term Global Growth Investment | 8 | High | Global | GB00BD5Z0Z54 |
| VT Gravis Clean Energy Income | 10.5 | Medium | Global | GB00BFN4H792 |
| Premier Diversified Growth | 9 | Medium | Mixed Investment 40-85% Shares | GB00B8BJV423 |
| Royal London UK Government Bond | 16 | Medium | UK Gilts | GB00B881TW52 |
| Allianz Strategic Bond | 16.5 | Low | Sterling Strategic Bond | GB00B06T9362 |
| Troy Asset Management Ltd Trojan Ethical | 10.5 | Medium | Flexible Investment | GB00BJP0XX17 |
| Cash | 11 | Low |
You can see that half of the funds I am invested in remain in the BOTB and half have fallen out of both the BOTB and BFBS. But let's look at each of those funds in turn.
If you run Fidelity European through the 80-20 Investor stress test tool it scores highly compared to its peers. In addition, as the chart below shows it has already recouped all of its year to date losses and has easily outperformed the average of its peers.
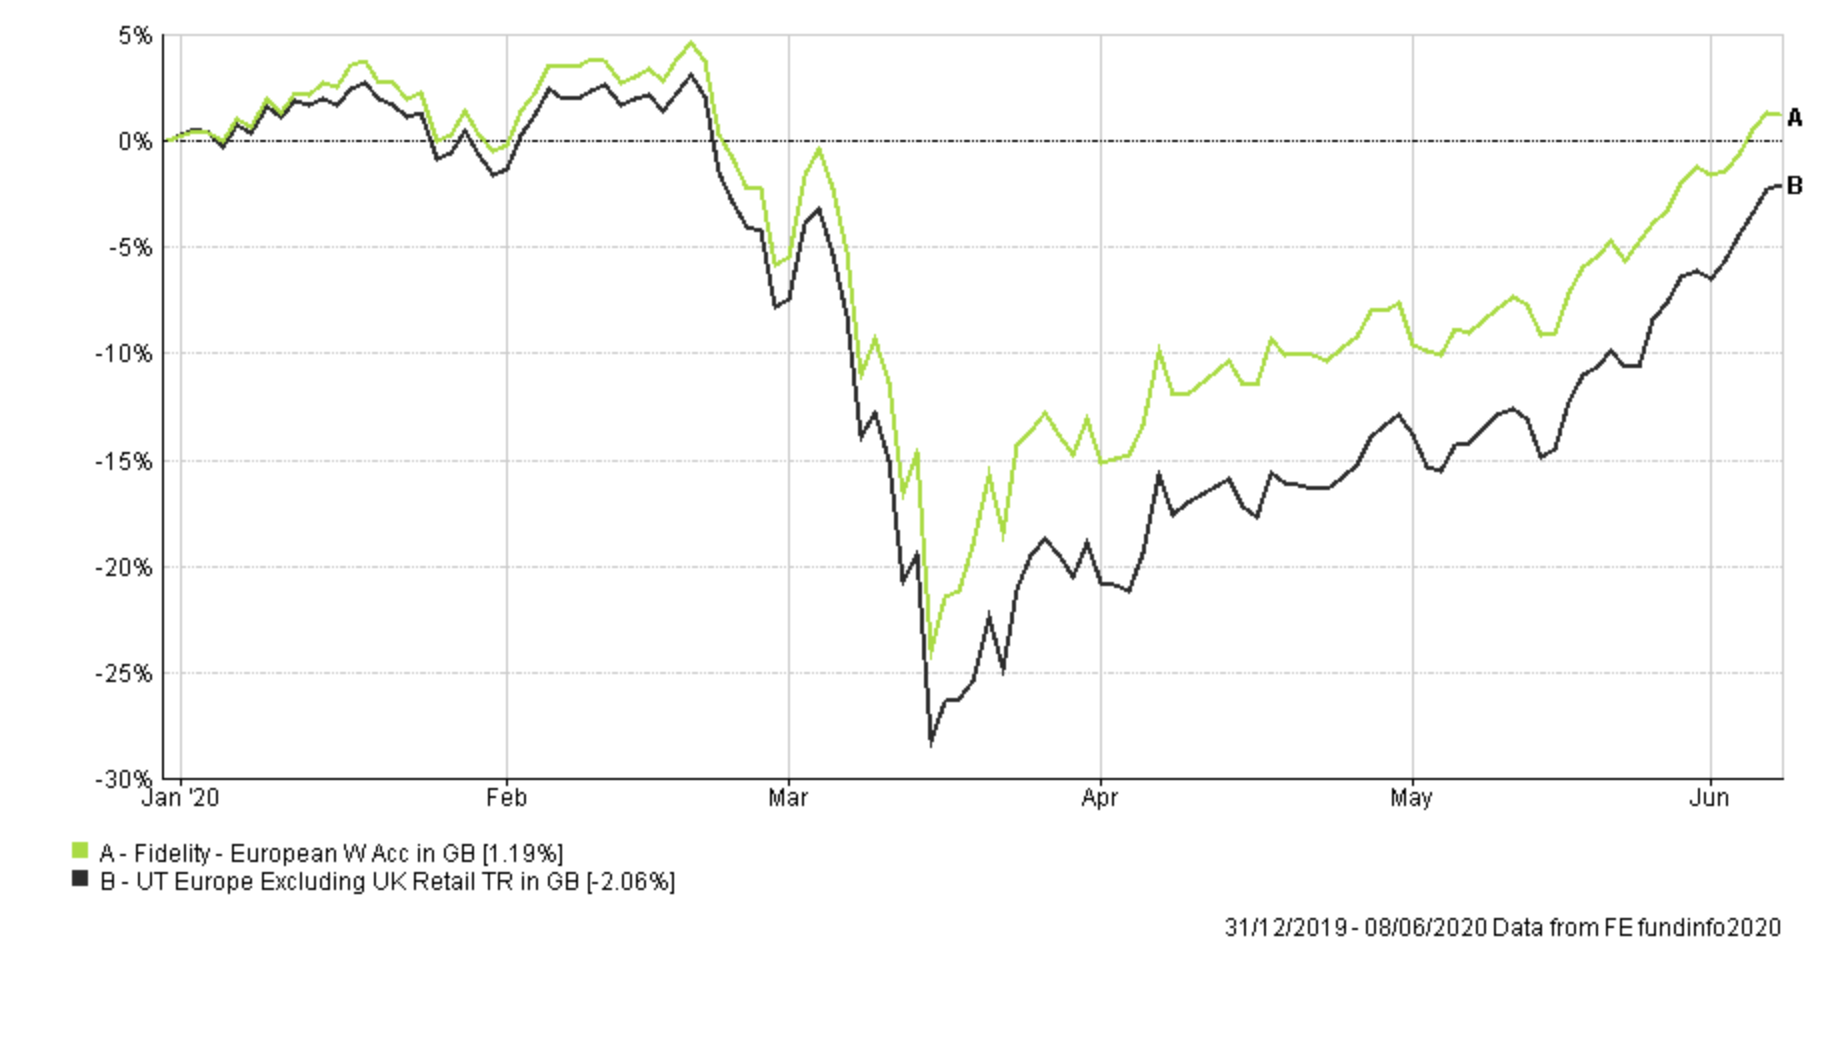
I had considered switching out of the fund in favour of the Baillie Gifford European fund but the Fidelity fund has a much lower 'max weekly fall number' of -18,83%, versus -22.49% for the former. While markets are certainly in a bullish mode I will maintain the Fidelity European fund for now for its more defensive qualities. In addition, the fund only just failed to make the latest BFBS lists so is performing strongly and in a market where momentum (for now at least) is aggressively upwards the opportunity cost if I make the switch versus remaining in the market is probably too high right now.
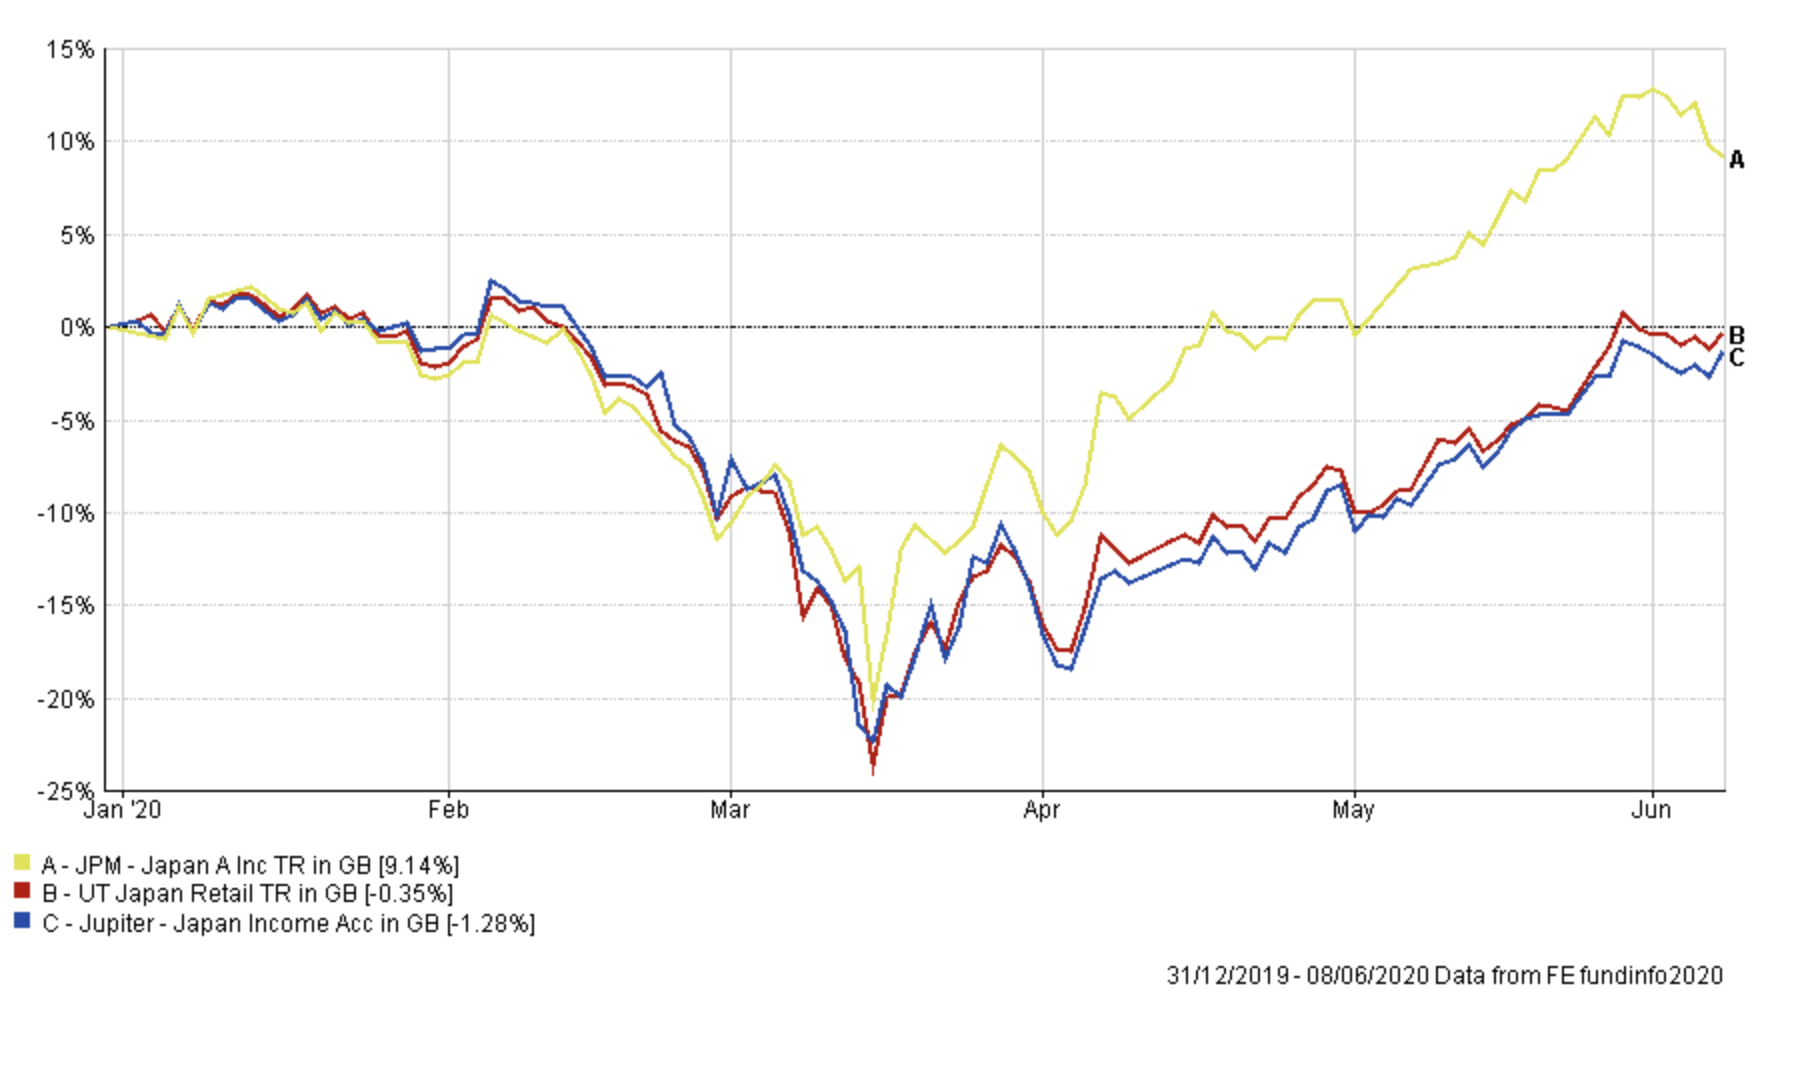
Turning our attention to Jupiter Japan Income. The fund has held up relatively well and broadly performed inline with its peers over recent months. Overall its performance is a little disappointing versus its peers but on an absolute basis it has almost recouped all the coronavirus-losses. JPM Japan, on the other hand, is now in this month's BOTB and has significantly outperformed Jupiter Japan Income over the last few months, as shown.
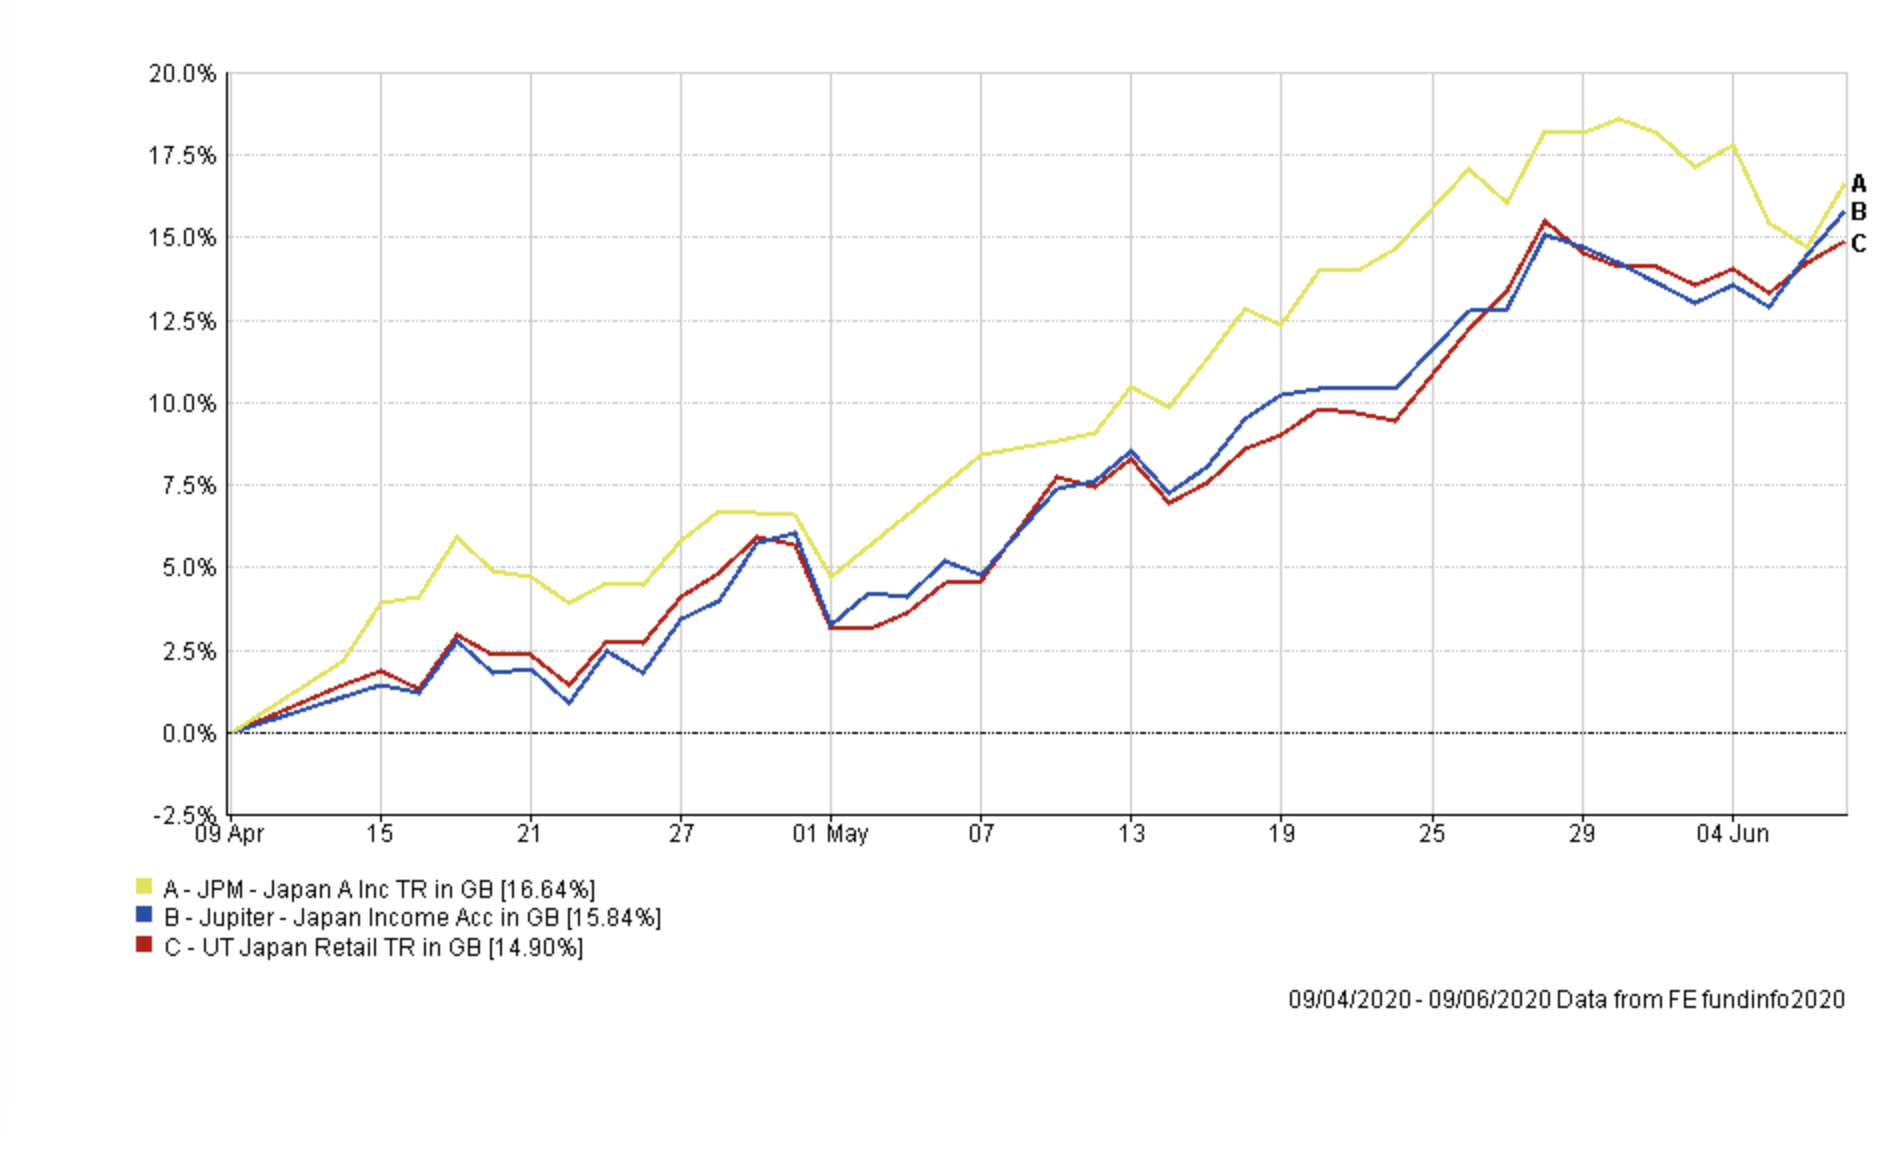
On closer inspection, most of that outperformance came in the initial few weeks following the March bottom. The chart below compares the performance between the two funds over the last two months and you can see there is little to choose between them. While the Jupiter Japan Income fund is on my watchlist to be replaced, and ordinarily I would replace it with JPM Japan, given the strong rally in the Japanese stock market I'd rather be in it for the time being rather than sit out for too long. Again, the opportunity cost of making a switch at this moment in time is too high.
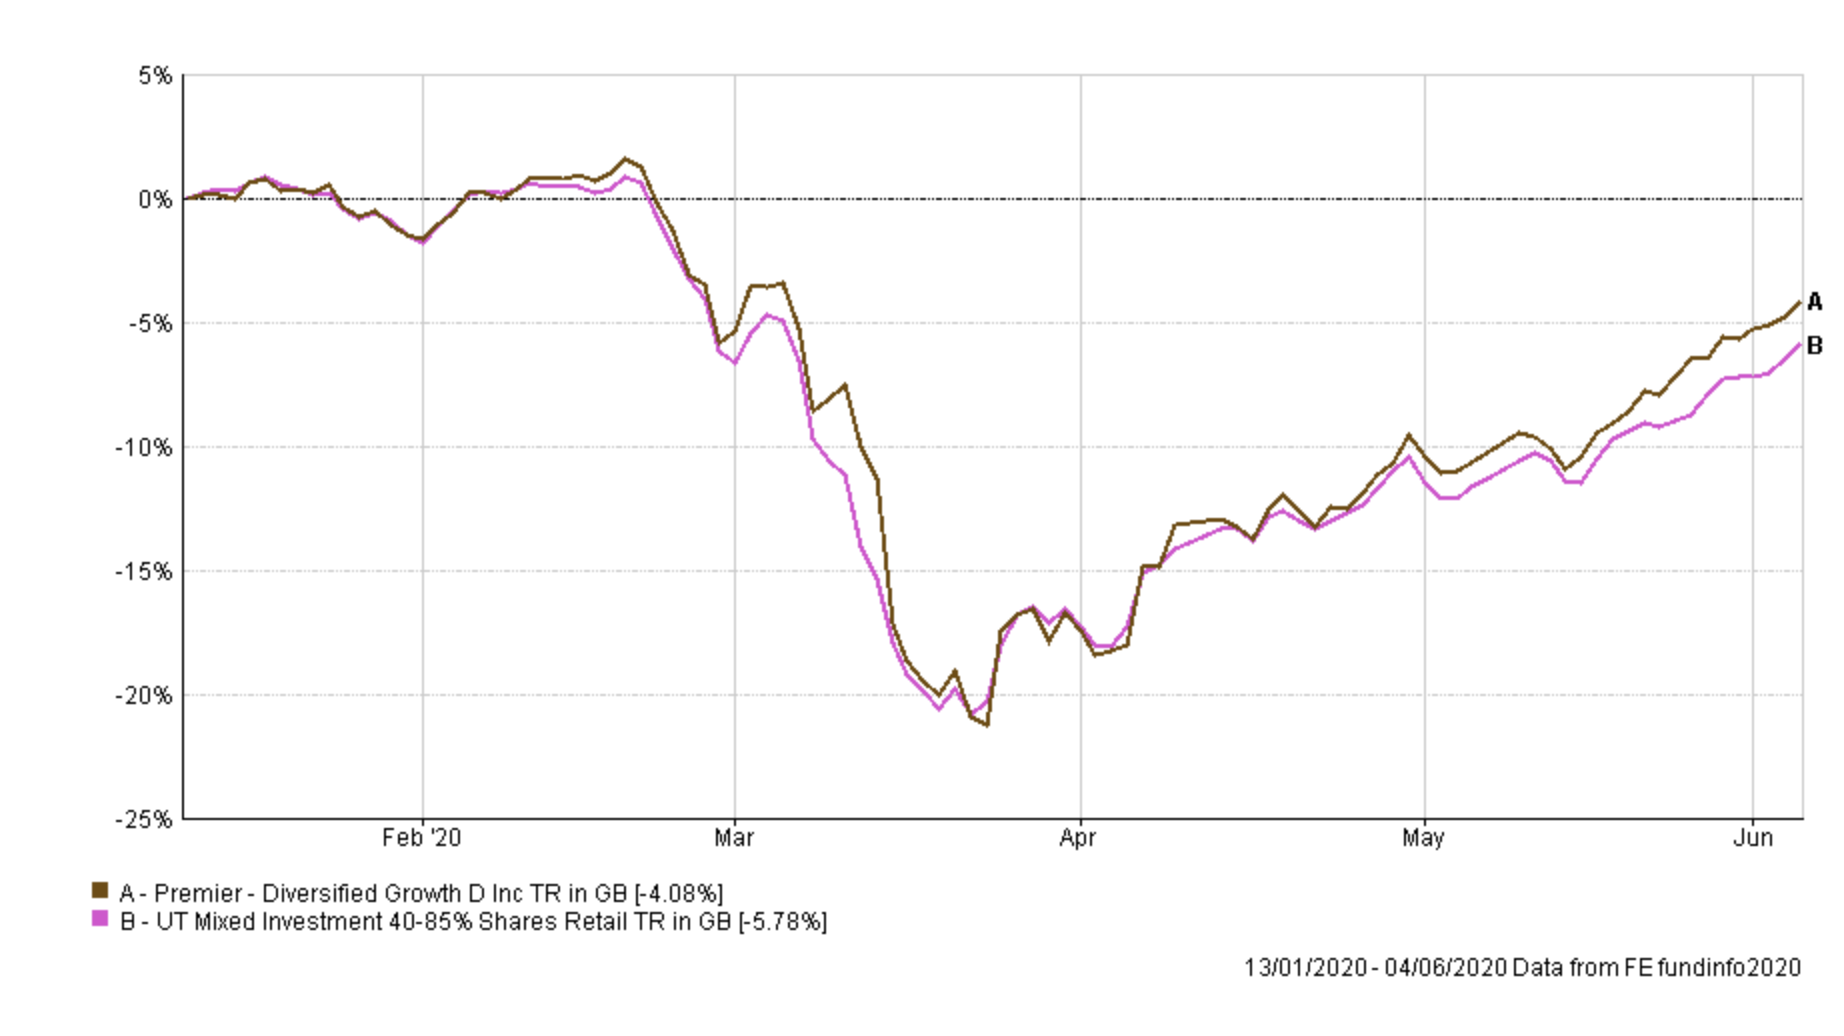
Premier Diversified Growth has had a new lease of life as shown by the chart below. The chart shows the performance of the fund versus its peers over the last few months. As such I am not in a rush to ditch it, instead, riding out the upward momentum it's currently enjoying.
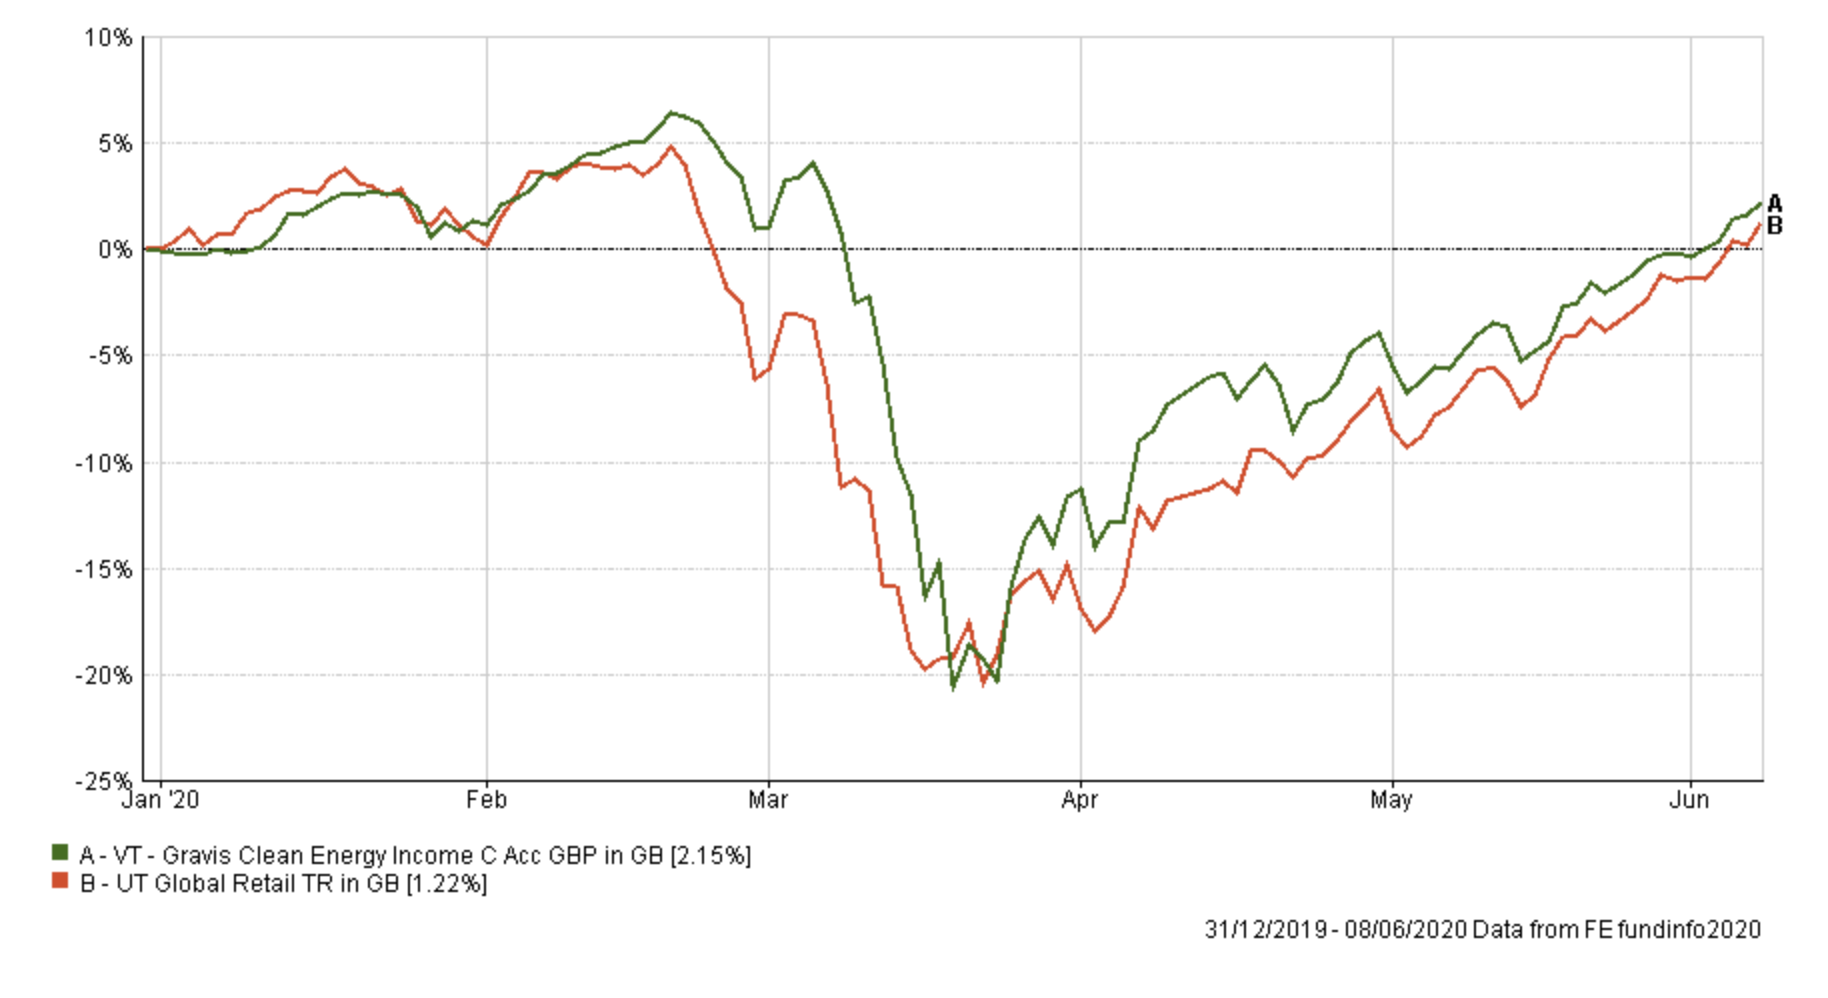
Finally, that brings me on to VT Gravis Clean Energy Income. As the chart shows the fund has outperformed its peer group average and has already recouped all the losses of 2020 and now sits back in profit.
With the market still in the throes of a strong rebound I'm loathed to make unnecessary changes, especially when the economic outlook remains uncertain. While many indicators point towards the market heading higher we certainly can not rule out another market crash in the coming months. So, for now, I plan to maintain my holdings in all the funds that have dropped out of the BOTB and BFBS tables but put them on the watchlist. However, I do plan to put the last remaining chunk of cash back to work within my portfolio.
In the next section, I list the of fund purchases which I will implement. The aim of which is to:
- put the remaining cash I hold to work
- keep my overall equity mix largely the same (i.e a US equity bias with limited UK equity exposure) although marginally increasing my portfolio’s equity allocation
Fund switches
- 50% out of cash and into Baillie Gifford Positive Change
- 50% out of cash and into Liontrust Sustainable Future Cautious Managed
Baillie Gifford Positive Change is a regular in the BOTB and has enjoyed an impressive run. I am conscious that the fund does have some overlap in terms of holdings with the Baillie Gifford Long Term Global Growth Investment fund which I already hold. These holdings are principally in US tech companies. So for that reason I limited the amount I would put into the Positive Change fund. Similarly of the remaining BOTB funds the standout choices also had significant US tech exposure. For fear of overexposing my portfolio to US tech names, which are already trading at lofty valuations I instead opted for a multi-asset fund in order to gain a broad asset and geographical mix. However, as you will notice the BOTB currently has few multi-asset funds other than the ones I already hold. For that reason I opted to use the BFBS table and chose the Liontrust Sustainable Future Cautious Managed not just because of its momentum but also because of its smaller drawdown during the height of the crash versus its peers. As I said earlier, while the market indicators are starting to appear bullish it is possible to use momentum while using a modicum of caution given the economic backdrop. As usual, I've been mindful of the BOTB asset mix without obsessing about matching it.
My portfolio now looks like this:
| Name | Allocation % (rounded) | Risk | Sector | ISIN Code |
| Fidelity European | 5 | Medium | Europe Excluding UK | GB00BFRT3504 |
| Jupiter Japan Income | 6.5 | High | Japan | GB00B0HZTZ55 |
| Schroder Global Healthcare | 7.5 | Medium | Global | GB00B76V7Q08 |
| Baillie Gifford Long Term Global Growth Investment | 8 | High | Global | GB00BD5Z0Z54 |
| VT Gravis Clean Energy Income | 11 | Medium | Global | GB00BFN4H792 |
| Premier Diversified Growth | 9.5 | Medium | Mixed Investment 40-85% Shares | GB00B8BJV423 |
| Royal London UK Government Bond | 15 | Medium | UK Gilts | GB00B881TW52 |
| Allianz Strategic Bond | 17 | Low | Sterling Strategic Bond | GB00B06T9362 |
| Troy Asset Management Ltd Trojan Ethical | 10.5 | Medium | Flexible Investment | GB00BJP0XX17 |
| Baillie Gifford Positive Change | 5 | High | Global |
GB00BYVGKV59
|
| Liontrust Sustainable Future Cautious Managed | 5 | Medium | Mixed Investment 40-85% Shares | GB00BMN90304 |
My Portfolio asset mix
My portfolio asset mix is as shown below (the previous asset mix is in brackets). My equity exposure is approximately 52%, which is still less than I had before the coronavirus sell-off:
-
- UK Equities 5% (4%)
- North American Equities 21% (18%)
- Global Fixed Interest 23% (21%)
- Japanese Equities 6% (6%)
- European Equities 11% (10%)
- UK Fixed Interest 0% (0%)
- UK Gilt 13% (15%)
- Cash 4% (13%)
- Alternative Investment Strategies 8% (7%)
- Emerging Market Equities 3% (0%)
- Commodities and energy 6% (6%)
- Property 0% (0%)
Damien's higher risk and lower risk portfolios
Using the logic described in my post: Update to Damien’s alternative risk portfolios I created hypothetical higher and lower risk versions of my portfolio below:
Higher risk
| Fund | Allocation % |
| Fidelity European | 6.0 |
| Jupiter Japan Income | 7.8 |
| Schroder Global Healthcare | 9.0 |
| Baillie Gifford Long Term Global Growth Investment | 9.6 |
| VT Gravis Clean Energy Income | 13.3 |
| Premier Diversified Growth | 11.4 |
| Royal London UK Government Bond | 18.1 |
| Troy Asset Management Ltd Trojan Ethical | 12.7 |
| Baillie Gifford Positive Change | 6.0 |
| Liontrust Sustainable Future Cautious Managed | 6.0 |
Lower risk
| Fund | Allocation % |
| Fidelity European | 6.2 |
| Schroder Global Healthcare | 9.3 |
| VT Gravis Clean Energy Income | 13.7 |
| Premier Diversified Growth | 11.8 |
| Royal London UK Government Bond | 18.6 |
| Allianz Strategic Bond | 21.1 |
| Troy Asset Management Ltd Trojan Ethical | 13.0 |
| Liontrust Sustainable Future Cautious Managed | 6.2 |

£200 Pension Cashback Offer
Make a qualifying deposit or transfer a pension to our partner Interactive Investor.
- Deposit or transfer a pension of at least £20k and you could earn £200 cashback
- Terms and Fees apply, Capital at risk
- New & Existing customers opening a SIPP
- Offer ends 31st July 2026
Before starting your transfer, check you won't lose any valuable benefits (such as guaranteed annuity rates or a lower protected pension age) and find out what exit fees you might have to pay
