

The background to my portfolio
Back in March 2015 I decided to invest £50,000 of my own money using 80-20 Investor. The purpose was twofold, firstly to show how you can use 80-20 Investor to invest and outperform the market with only a few minutes effort every now and then. Secondly, no other investment commentator, journalist or research provider invests their own money for fear of failing. This is a sorry state of affairs and is precisely why I committed to openly running my own portfolio for 80-20 Investor members to see.
Since then I have periodically changed my portfolio using the fund suggestions provided by the 80-20 Investor algorithm and associated research. I always disclose the changes at the time they are made.
Performance update
As is usual in my portfolio reviews, the chart below shows how my portfolio has outperformed since I started the challenge in March 2015, which is over six years ago. The green line is the performance of my portfolio while the red line is the benchmark showing the average return achieved by professional fund managers given the same asset mix. To accurately calculate this I have used the average return for each sector in which my portfolio invested. The blue line shows what the average multi-asset fund with comparable equity content achieved. In other words, the red line would show the extra performance added by just the asset mix of my portfolio (where I was invested i.e European equities etc) over picking a typical multi-asset fund (the blue line). While the green line (which is my actual performance) shows the impact of being in the right funds at the right time, as identified by the 80-20 Investor algorithm.
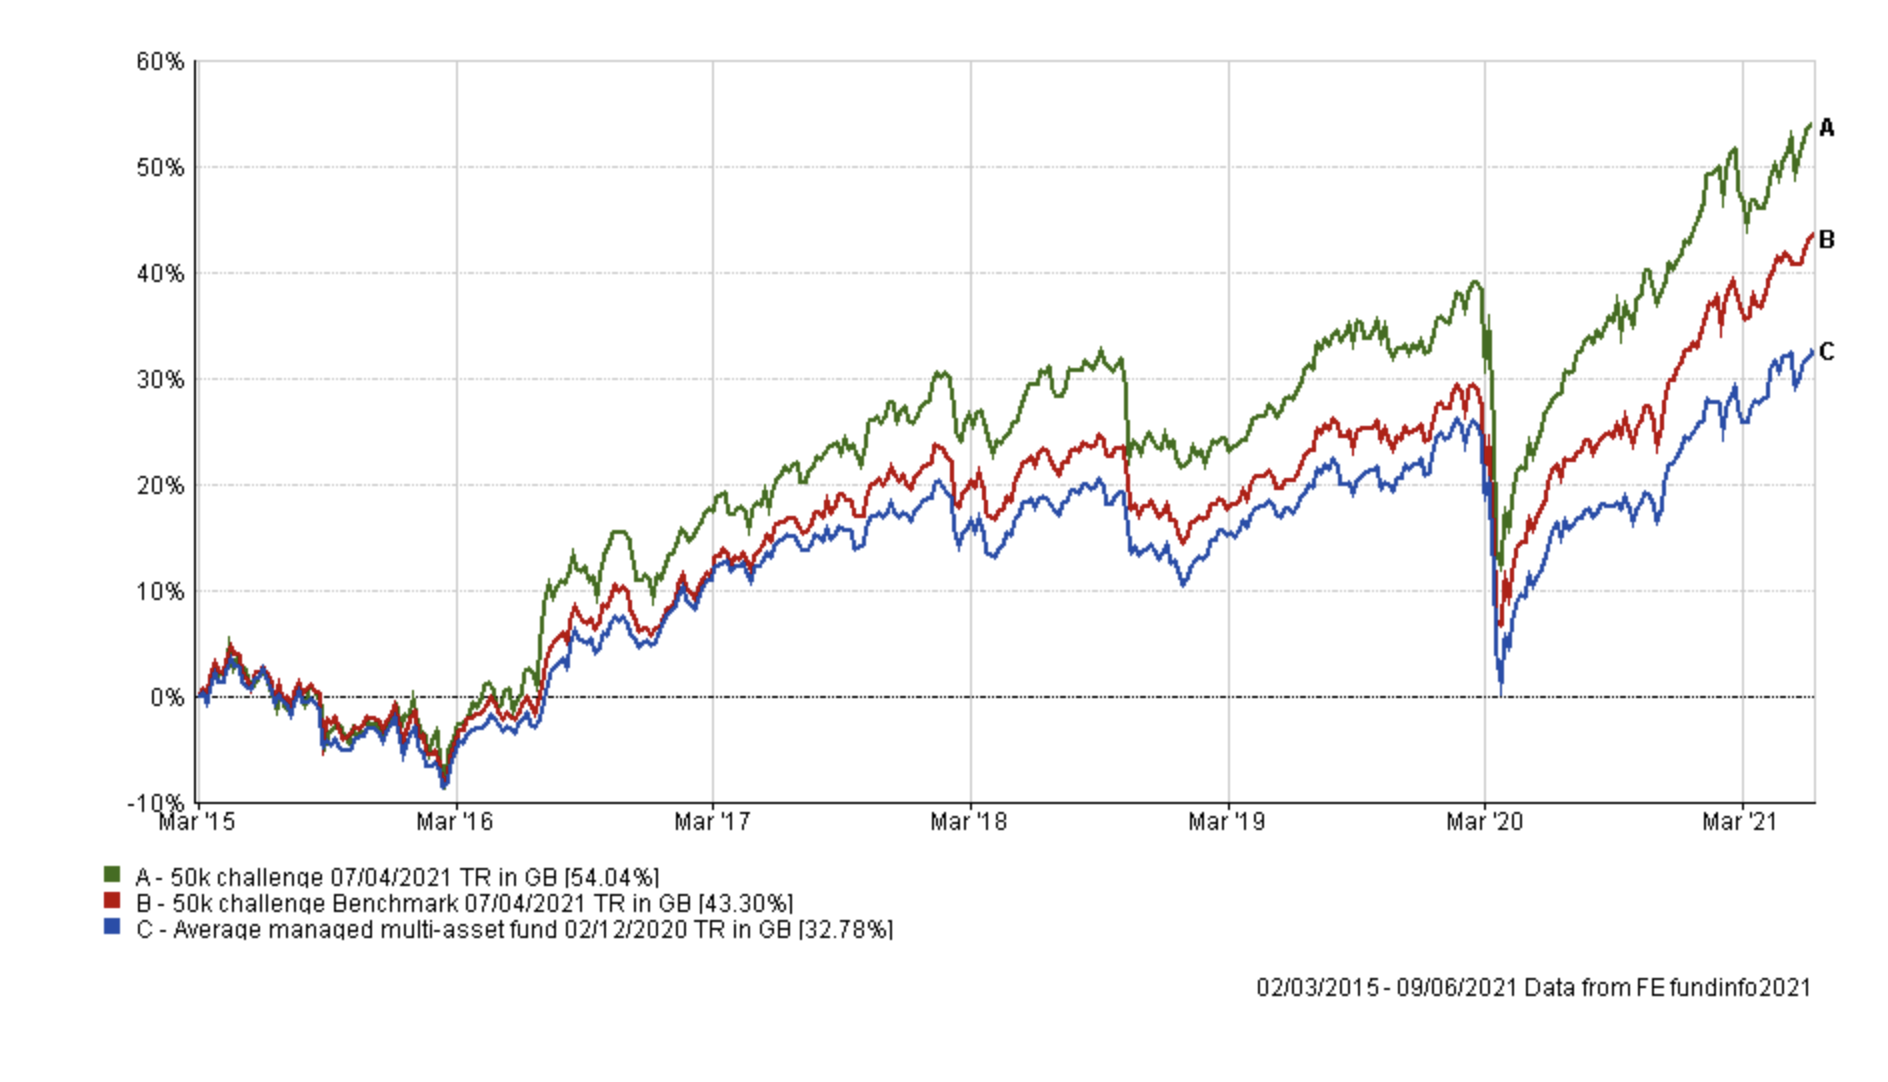
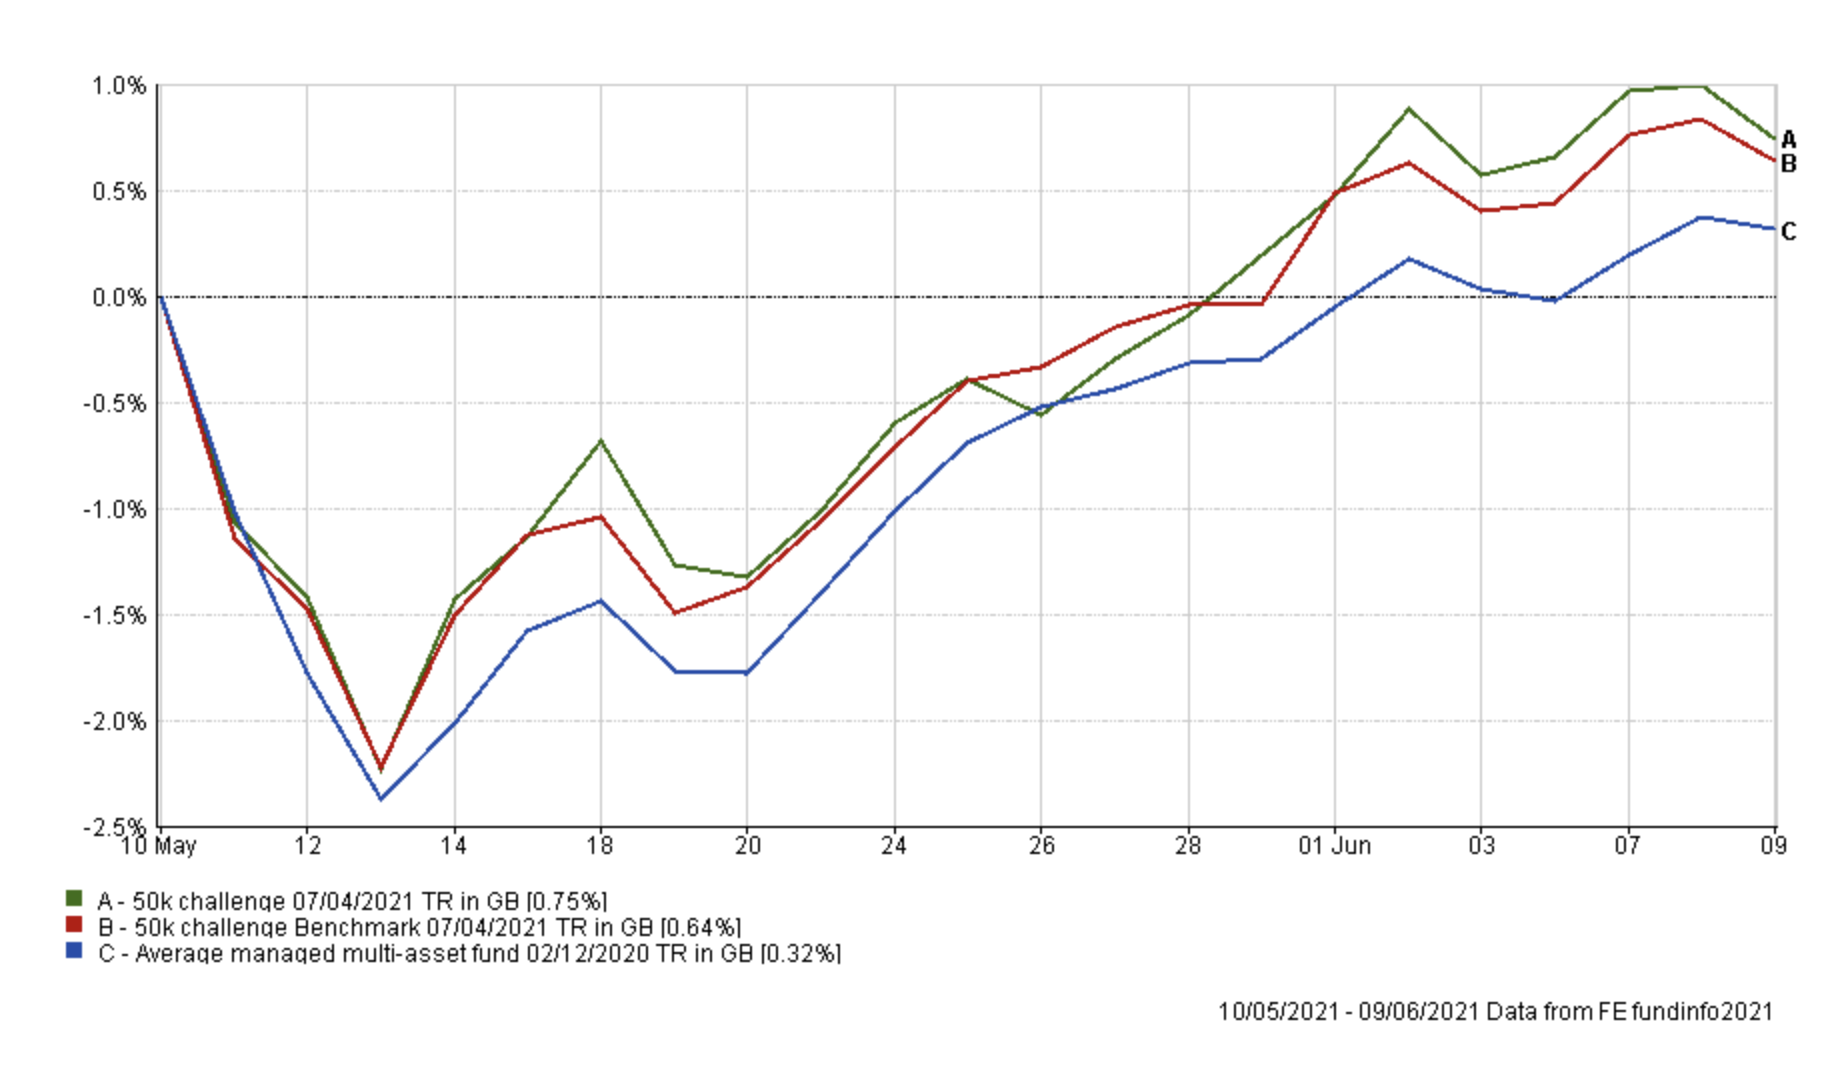
It's good to see my £50k portfolio once again sitting at a new all-time high. The chart below shows the performance of my portfolio versus its benchmarks during May. As you can see my portfolio outperformed its benchmarks and remains well ahead of its benchmarks over the long term.
If you recall, last time I made the decision to do nothing after the dramatic shift from growth towards value/cyclical assets, back in April, which has so far been rewarded. As my portfolio continues to outperform its benchmarks during the current sleepy summer market of recent weeks there is no compelling reason to make wholesale changes.
As is routine in my portfolio reviews, the table below shows which funds within my current portfolio are in the current BOTB or BFBS tables and which are not. Those funds in green are still in the BOTB while those in orange are not in the BOTB but remain in the BFBS list. Meanwhile, any funds in red have dropped out of both shortlists.
| Name | Allocation % (rounded) | Risk | Sector | ISIN Code |
| Artemis Global Growth | 5.5 | Medium | Global | GB00B2PLJP95 |
| ASI Strategic Bond | 15.5 | Low | Sterling Strategic Bond |
GB00BWK27X12
|
| ES R&M UK Recovery | 6 | Medium | UK All Companies | GB00B614J053 |
| Fidelity American Special Situations | 5 | High | North America | GB00B89ST706 |
| Fidelity Global High Yield | 8 | Low | Sterling High Yield |
GB00B7K7SQ18
|
| Fidelity UK Smaller Companies | 9 | High | UK Smaller Companies |
GB00B7VNMB18
|
| Invesco Global Emerging Markets (UK) | 7 | Medium | Global Emerging Markets |
GB00B3RW7S64
|
| iShares Physical Gold ETC | 4 | Medium | Commodity & Energy ETF | IE00B4ND3602 |
| JPM Natural Resources | 5 | High | Specialist | GB0031835118 |
| Jupiter Income Trust | 6 | Medium | UK Equity Income | GB0004791389 |
| Marlborough European Multi-Cap | 3.5 | High risk | Europe Excluding UK | GB0001719730 |
| Premier Diversified Growth | 10 | Medium | Mixed Investment 40-85% Shares | GB00B8BJV423 |
| Sarasin Global Dividend | 8.5 | Medium | Global Equity Income |
GB00BGDF8F44
|
| Schroder Global Equity Income | 7 | Medium | Global Equity Income |
GB00B76V7M69
|
As you can see every fund is either in the BOTB or the BFBS tables, with the exception of Sarasin Global Dividend (just like last month) and ASI Strategic Bond. So again there is no reason to make drastic fund changes. Also, my exposure to gold is a long term position.
Last month I wrote how the Sarasin fund was on my watchlist and that I would look to remove it this month. The table below shows the performance of each fund within my portfolio since my last review, and while I don't place too much emphasis on a single month's performance figures, it shows how the Sarasin is still detracting from my portfolio's returns.
| Name | % performance over last month |
| Marlborough European Multi-Cap | 5.31 |
| Fidelity UK Smaller Companies | 3.36 |
| iShares Physical Gold | 3.04 |
| Premier Miton Diversified Growth | 1.07 |
| Schroder Global Equity Income | 0.97 |
| Fidelity Global High Yield | 0.56 |
| ASI Strategic Bond | 0.5 |
| Invesco Global Emerging Markets (UK) | 0.49 |
| Fidelity American Special Situations | 0.26 |
| Jupiter Income Trust | 0.23 |
| ES R&M UK Recovery | -0.43 |
| Sarasin Global Dividend | -0.64 |
| Artemis Global Equity | -1.21 |
| JPM Natural Resources | -1.66 |
As such I have decided to finally remove the fund from my portfolio.
Turning my attention to the ASI Strategic Bond fund, the chart below shows the performance of the fund versus its peer group average since I first invested in it back on 4th December 2020.
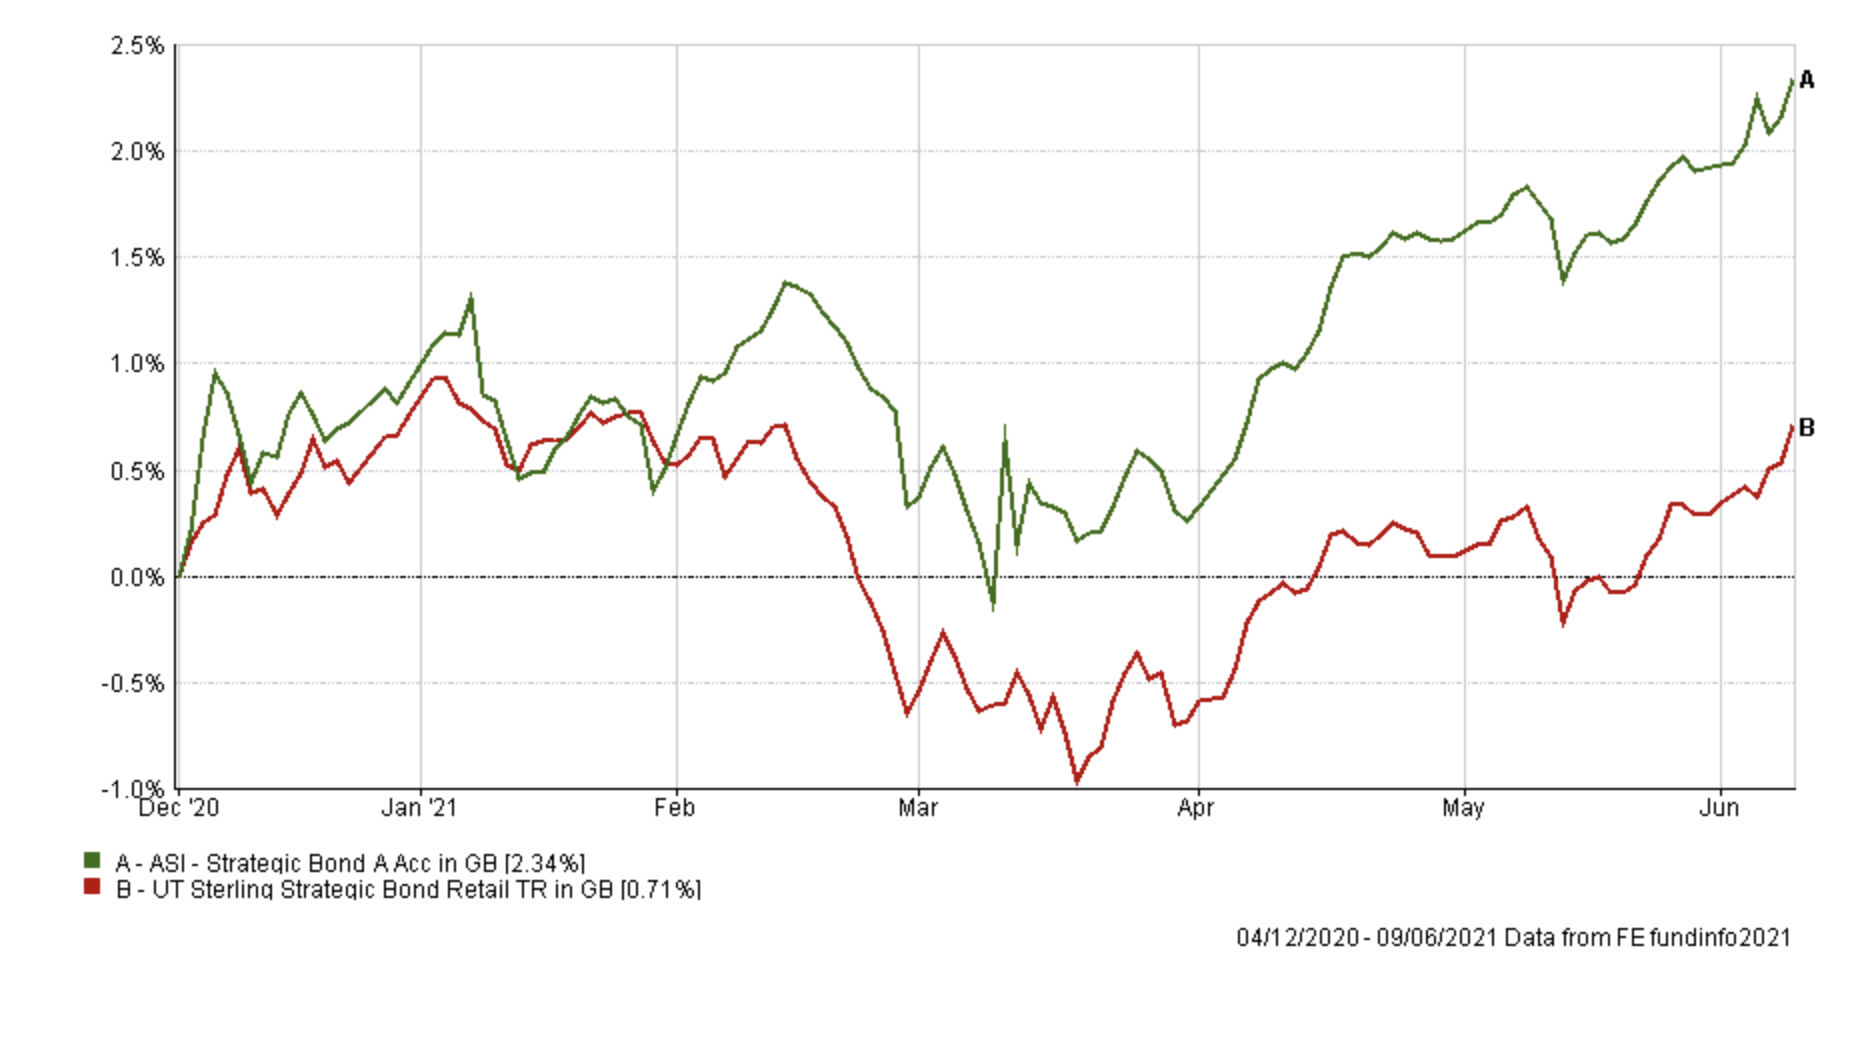
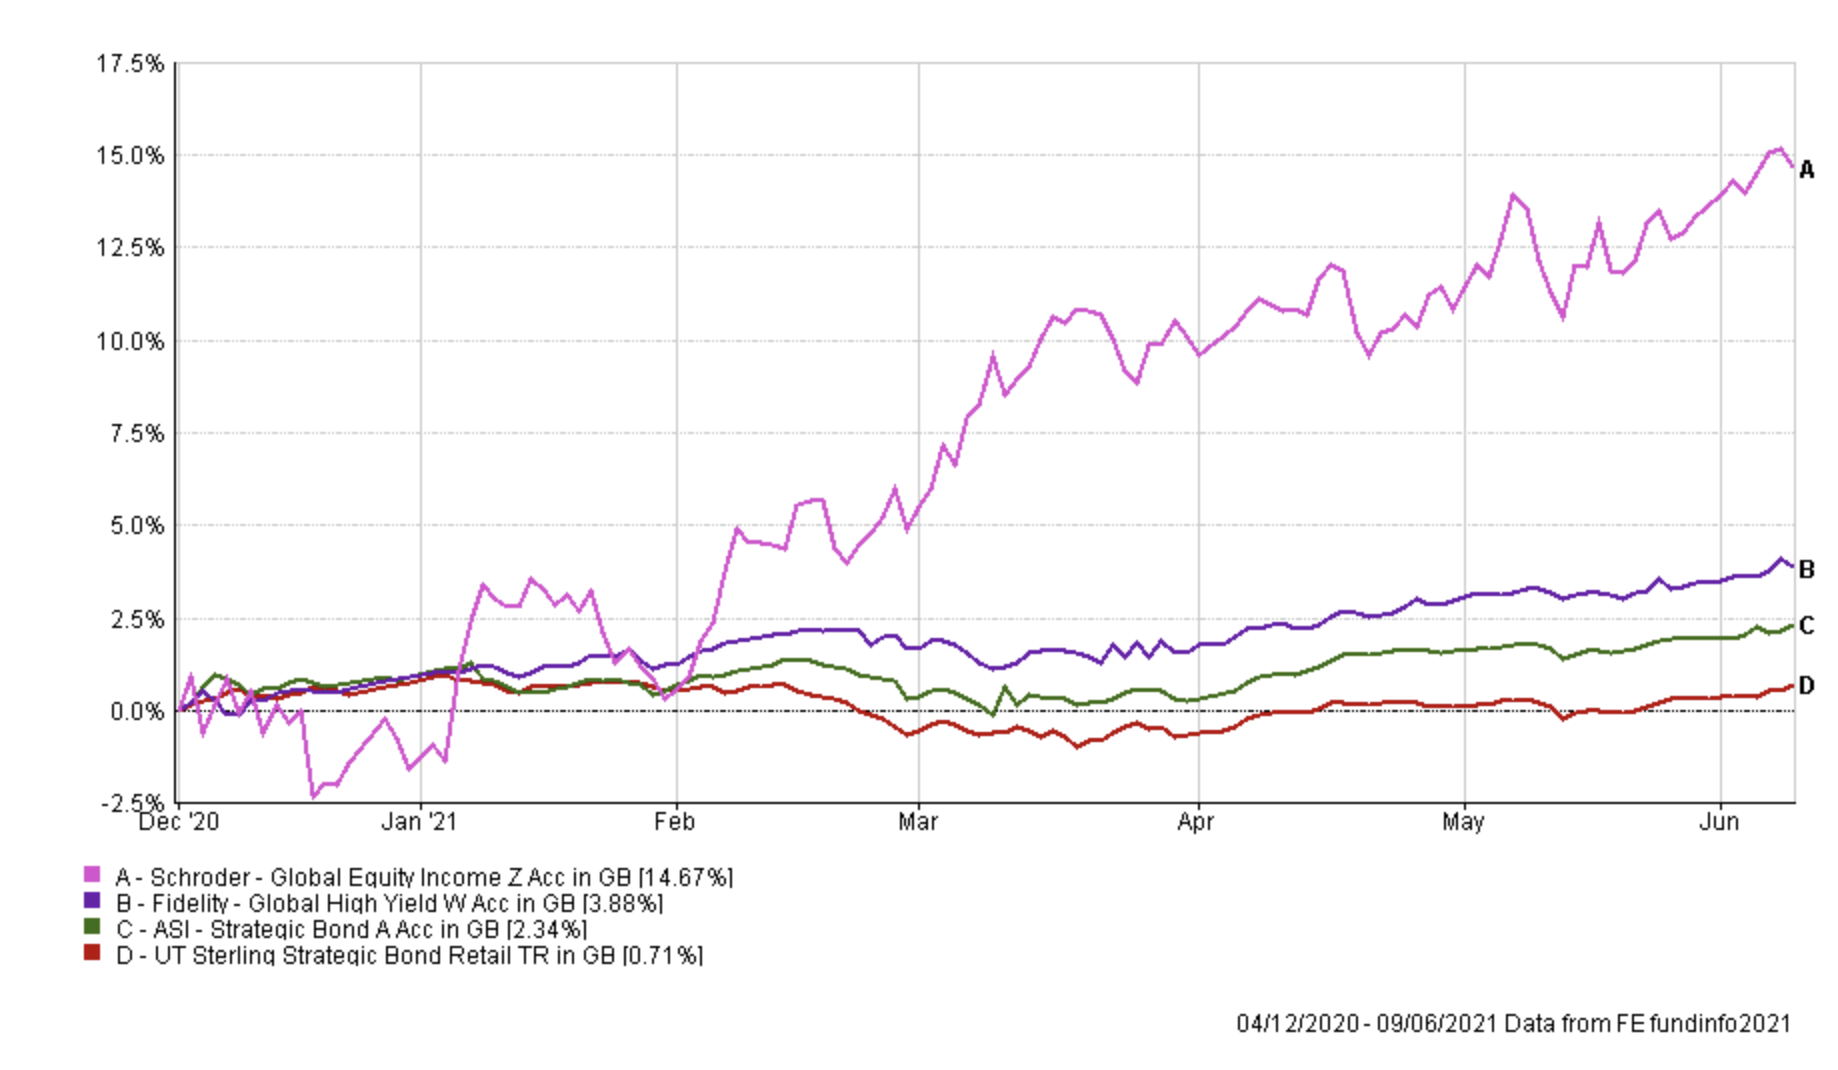
Clearly the performance is not disastrous by any stretch, in fact, it has outperformed most of its peers, but there are other low-risk alternatives that have performed more strongly. For example, the Fidelity Global High Yield fund, which is in my portfolio, is up over 3.88% over the same period. Other funds within the low-risk section from this month's BOTB are up even more. However, they are more volatile than the ASI fund due to their high yield and/or equity exposure.
Given ASI Strategic Bond's significant exposure in my portfolio and the fact that it's only just dropped out of the BFBS tables, I will maintain the ASI Strategic Bond holding for now. At the moment it is performing its role within my portfolio, being somewhat boring but dependable. The chart below puts the above moves in the ASI Strategic Bond into the context of how the equity portion of my portfolio has performed. You can see that it has offset any periods of equity market weakness while steadily growing over time. The fund will therefore sit on my watchlist going forward.
Fund switch
Following this review, I have made the following fund switch:
100% out of Sarasin Global Dividend and 100% into Wise Multi-Asset Growth - the Wise Multi-Asset Growth is a managed fund that invests in investment trusts with a value bias. It has been a regular in the BOTB for a number of months. The switch slightly reduces my equity exposure from 62% to 60% which reflects a slight reduction we saw in the BOTB this month. The fund has around a 60% exposure to equities. It also gives me exposure to alternative assets and not just straightforward equity/bonds. Overall the switch means that my portfolio's asset mix remains almost identical and in line with the BOTB. Of course the new fund's value bias does increase my portfolio's risk of underperformance if we see a downturn in value stocks performance versus that of growth stocks, but on the flip side the portfolio will benefit further from a continuation of the reflation trade.
My portfolio
My portfolio now looks like this:
| Name | Allocation % (rounded) | Risk | Sector | ISIN Code |
| Artemis Global Equity | 5 | Medium | Global | GB00B2PLJP95 |
| ASI Strategic Bond | 15 | Low | Sterling Strategic Bond |
GB00BWK27X12
|
| ES R&M UK Recovery | 6 | Medium | UK All Companies | GB00B614J053 |
| Fidelity American Special Situations | 5.5 | High | North America | GB00B89ST706 |
| Fidelity Global High Yield | 8 | Low | Sterling High Yield |
GB00B7K7SQ18
|
| Fidelity UK Smaller Companies | 9.5 | High | UK Smaller Companies |
GB00B7VNMB18
|
| Invesco Global Emerging Markets (UK) | 7 | Medium | Global Emerging Markets |
GB00B3RW7S64
|
| iShares Physical Gold ETC | 4 | Medium | Commodity & Energy ETF | IE00B4ND3602 |
| JPM Natural Resources | 5 | High | Specialist | GB0031835118 |
| Jupiter Income Trust | 6 | Medium | UK Equity Income | GB0004791389 |
| Marlborough European Multi-Cap | 3.5 | High risk | Europe Excluding UK | GB0001719730 |
| Premier Diversified Growth | 10 | Medium | Mixed Investment 40-85% Shares | GB00B8BJV423 |
| Wise Multi-Asset Growth | 8.5 | Medium | Flexible Investment | GB0034272533 |
| Schroder Global Equity Income | 7 | Medium | Global Equity Income |
GB00B76V7M69
|
My Portfolio asset mix
My portfolio asset mix is as shown below which has around a 60% exposure to equities. The numbers in brackets are last month's equivalent figures.
-
- UK Equities 23% (23%)
- North American Equities 11% (11%)
- Asian/Emerging Market Equities 5% (6%)
- Japanese Equities 0% (0%)
- European Equities 4% (5%)
- Chinese equities 2% (2%)
- Other equity 9% (9%)
- Commodities and energy 9% (9%)
- UK Fixed Interest 6% (7%)
- Global Fixed Interest 16% (15%)
- Cash 5% (5%)
- Alternative Investment Strategies 10% (8%)
Damien's higher risk and lower risk portfolios
Using the logic described in my post: Update to Damien’s alternative risk portfolios I created hypothetical higher and lower risk versions of my portfolio below:
Higher risk
| Artemis Global Growth | 6 |
| ES R&M UK Recovery | 8 |
| Fidelity American Special Situations | 7 |
| Fidelity UK Smaller Companies | 12 |
| Invesco Global Emerging Markets (UK) | 9 |
| iShares Physical Gold ETC | 5 |
| JPM Natural Resources | 6 |
| Jupiter Income Trust | 8 |
| Marlborough European Multi-Cap | 5 |
| Premier Miton Diversified Growth | 13 |
| Wise Funds Limited TB Wise Multi-Asset Growth | 11 |
| Schroder Global Equity Income | 9 |
Lower risk
| Fund | Allocation % |
| Artemis Global Growth | 7 |
| ASI Strategic Bond | 22 |
| ES R&M UK Recovery | 9 |
| Fidelity Global High Yield | 12 |
| iShares Physical Gold ETC | 6 |
| Jupiter Income Trust | 9 |
| Premier Miton Diversified Growth | 14 |
| Wise Funds Limited TB Wise Multi-Asset Growth | 12 |
| Schroder Global Equity Income | 10 |

£200 Pension Cashback Offer
Make a qualifying deposit or transfer a pension to our partner Interactive Investor.
- Deposit or transfer a pension of at least £20k and you could earn £200 cashback
- Terms and Fees apply, Capital at risk
- New & Existing customers opening a SIPP
- Offer ends 31st July 2026
Before starting your transfer, check you won't lose any valuable benefits (such as guaranteed annuity rates or a lower protected pension age) and find out what exit fees you might have to pay
