

The background to my portfolio
Back in March 2015 I decided to invest £50,000 of my own money using 80-20 Investor. The purpose was twofold, firstly to show how you can use 80-20 Investor to invest and outperform the market with only a few minutes effort every now and then. Secondly, no other investment commentator, journalist or research provider invests their own money for fear of failing. This is a sorry state of affairs and is precisely why I committed to openly running my own portfolio for 80-20 Investor members to see.
Since then I have periodically changed my portfolio using the fund suggestions provided by the 80-20 Investor algorithm and associated research. I always disclose the changes at the time they are made.
Performance update
As is usual in my portfolio reviews, the chart below shows how my portfolio has outperformed since I started the challenge in March 2015, which is over seven years ago. The green line is the performance of my portfolio while the red line is the benchmark showing the average return achieved by professional fund managers given the same asset mix. To accurately calculate this I have used the average return for each sector in which my portfolio invested. The blue line shows what the average multi-asset fund with comparable equity content achieved. In other words, the red line would show the extra performance added by just the asset mix of my portfolio (where I was invested i.e European equities etc) over picking a typical multi-asset fund (the blue line). While the green line (which is my actual performance) shows the impact of being in the right funds at the right time, as identified by the 80-20 Investor algorithm.
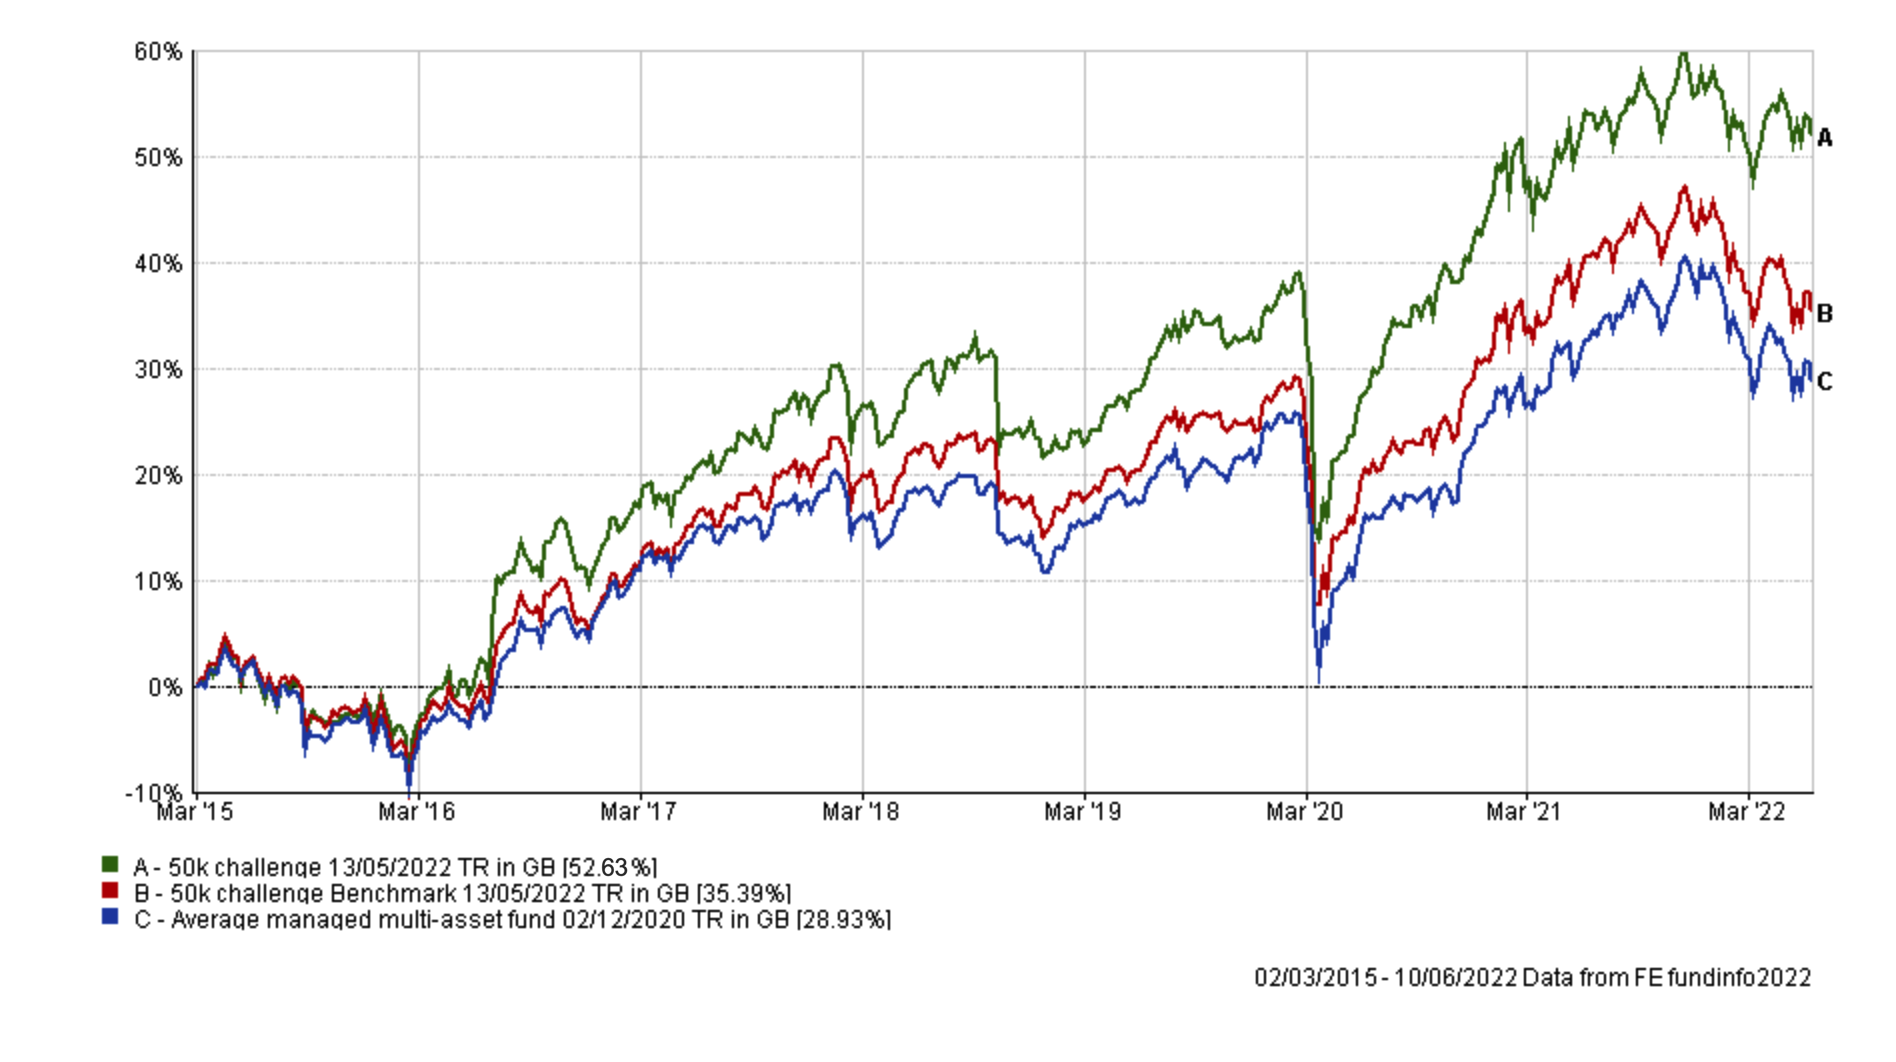
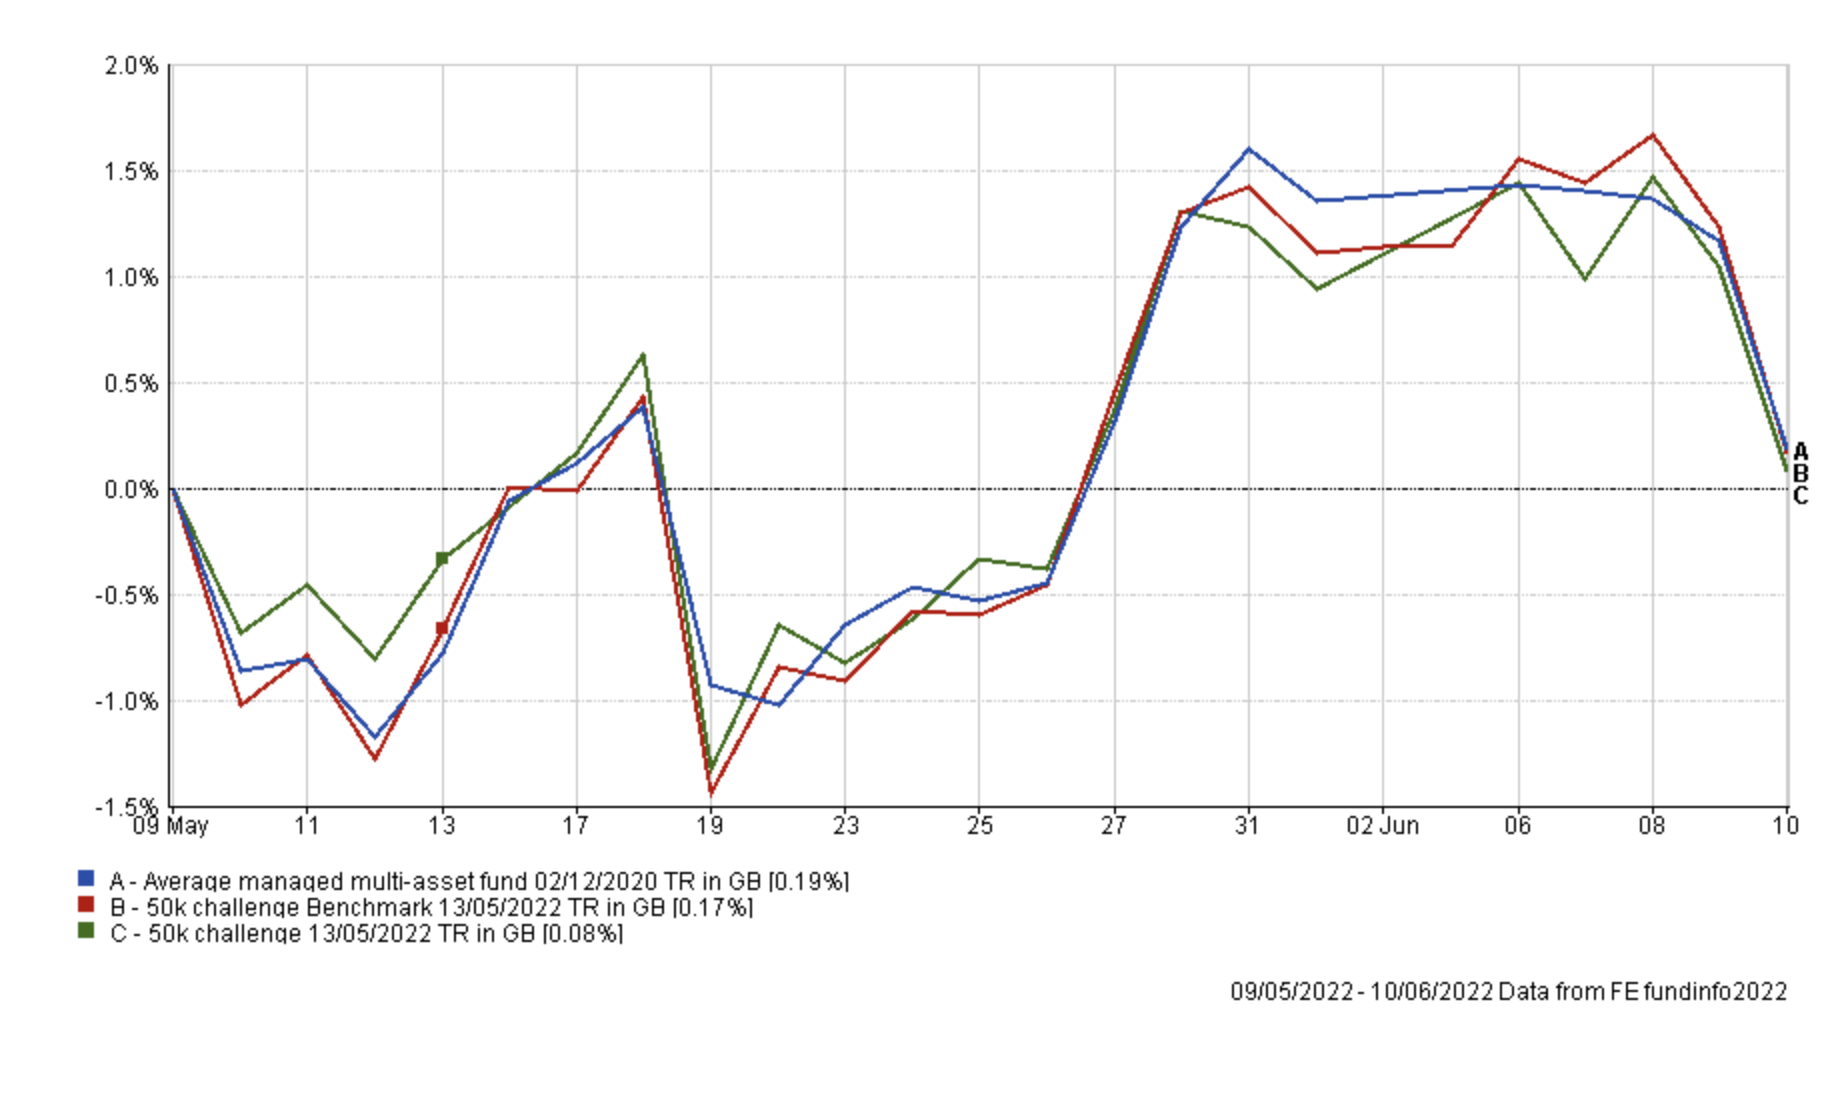
As you can see below, during the last month when equities whipsawed but ultimately finished flat, my £50k portfolio performed in line with its benchmarks. In doing so my portfolio maintains its long-term outperformance.
The table below shows the individual performance of each holding in my portfolio since my last review a month ago. As you can see gold struggled while funds with commodity or energy exposure outperformed, which was the complete opposite of the previous month. Interestingly, Fidelity Index US and Fidelity Global Property were once again among the weakest performers.
| Holding | 1 month % performance (since last review) |
| BlackRock Natural Resources Growth & Income | 4.14 |
| Invesco UK Opportunities (UK) | 3.21 |
| M&G Global Dividend | 2.15 |
| Thesis TM Tellworth UK Select | 1.33 |
| BM SVS Brooks Macdonald Defensive Capital | 0.3 |
| Cash | 0.06 |
| Premier Miton Defensive Growth | -0.23 |
| Invesco High Yield (UK) | -0.6 |
| Fidelity American Special Situations | -1.01 |
| Troy Asset Management Ltd Trojan Ethical | -1.21 |
| Fidelity Index US | -1.22 |
| Gold | -1.95 |
| Fidelity Global Property | -3.35 |
As usual, the table below shows which funds within my portfolio are in the current BOTB or BFBS tables and which are not. Those funds in green are still in the BOTB while those in orange are not in the BOTB but remain in the BFBS list. Meanwhile, any funds in red have dropped out of both shortlists.
| Name | Allocation % (rounded) | Risk | Sector | ISIN Code |
| BlackRock Natural Resources Growth & Income | 6% | High | Commodity/Natural Resource | GB00B6865B79 |
| BM SVS Brooks Macdonald Defensive Capital | 10% | Low | Targeted Absolute Return | GB00B61MR835 |
| Cash | 6.5% | Low | ||
| Fidelity American Special Situations | 8.5% | Medium | North America | GB00B89ST706 |
| Fidelity Global Property | 8% | High | Property Other | GB00B7K2NZ09 |
| Fidelity Index US | 11% | High | North America | GB00BJS8SH10 |
| Invesco High Yield (UK) | 3.5% | Low | Sterling High Yield | GB00B3RW7649 |
| Invesco UK Opportunities (UK) | 7.5% | Medium | UK All Companies | GB00B1W7HM62 |
| iShares Physical Gold ETC | 5% | Medium | Commodity & Energy ETF | IE00B4ND3602 |
| M&G Global Dividend | 9% | Medium | Global Equity Income | GB00B46J9127 |
| Premier Miton Defensive Growth | 12% | Low | Targeted Absolute Return | GB00B832BD89 |
| Thesis TM Tellworth UK Select | 5% | Low | Targeted Absolute Return | GB00BNY7YM73 |
| Troy Asset Management Ltd Trojan Ethical | 8% | Low | Flexible Investment | GB00BJP0XX17 |
Last time I reduced my bond exposure and increased my cash weighting which proved a positive move. As I mentioned at the time, cash has proved a useful asset in a time when bonds and equities continued to fall in tandem, as they have done for most of 2022. This was something that was highlighted as likely to happen in my article "The diversification dilemma - when bonds and equities fall together".
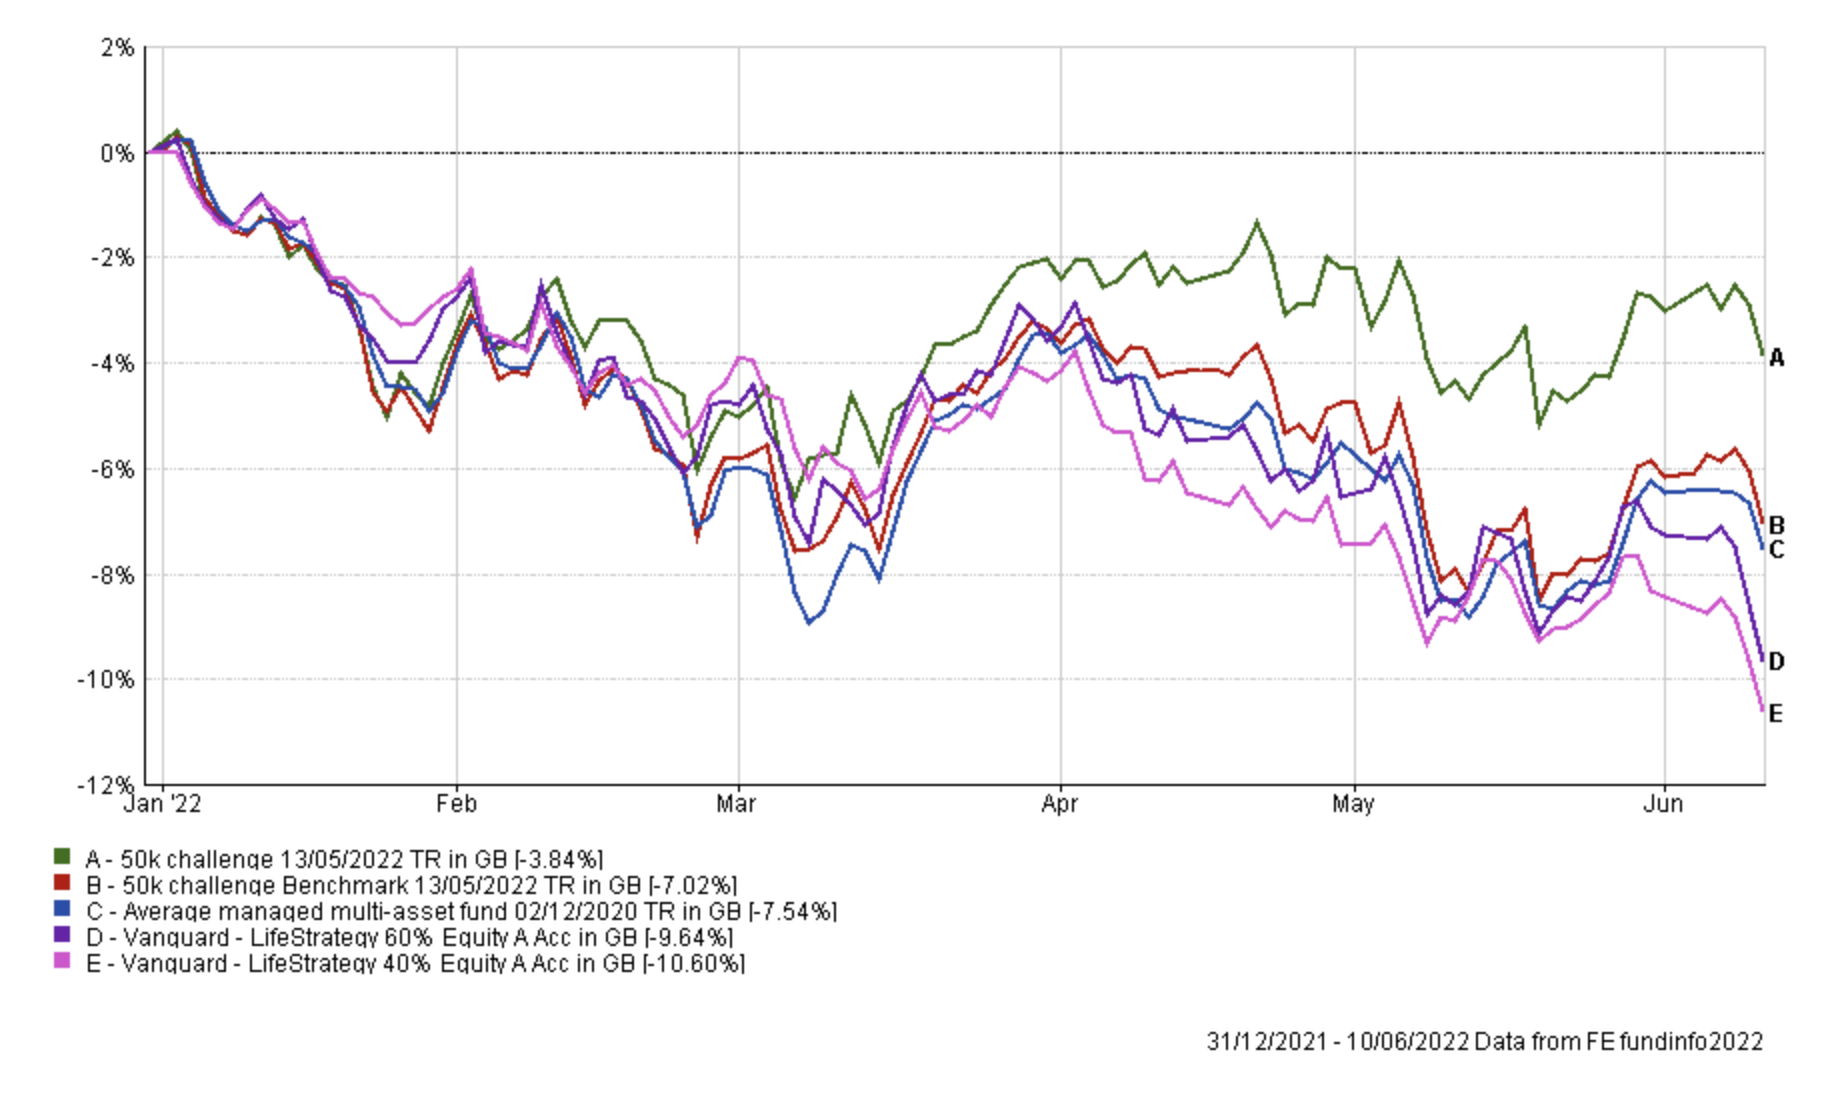
Over the last week bond and equities have begun tumbling in tandem once again, after a brief respite at the end of May/start of June. You can see the impact of this in the chart below which shows the outperformance of my portfolio since the start of the year versus its benchmarks. I have also included the popular Vanguard Lifestrategy funds on the chart (my portfolio has also outperformed both since its inception) to show how being in the right assets (not just bonds and equities) has helped buoy my portfolio's performance. My portfolio has also shown how being in the right equity sectors (such as energy and oil stocks) has helped too.
But of course, it always pays to be humble, as things could change, especially if a global growth scare hits commodity markets.
At the moment most of the funds within my portfolio are still in the BOTB or BFBS tables. However, the following funds have fallen out of both and are coloured red in the table above.
- Fidelity Global Property
- Invesco High Yield (UK)
- Fidelity US Index
- Troy Asset Management Ltd Trojan Ethical
Fidelity Global Property has had a torrid month or so, unfortunately just after I increased my exposure to the fund, which is evidence that you won't get every decision right. Fidelity US Index essentially tracks the S&P 500 which has had another tough month versus other global equity markets. At the time of writing this review, the S&P 500 has officially slipped into bear market territory, meaning that it has fallen more than 20% below its recent high point. This is following higher than expected inflation data coming out of the US on Friday which shook investment markets.
In fact the news sparked an equity and bond market collapse globally. For example, the FTSE 100 has fallen 5% in the last week while the S&P 500 has tumbled 9%. Bond yields have exploded higher (meaning that bond funds have fallen in value) with the 10 year US treasury yield jumping from 2.94% to 3.3% in the last 5 trading days. Similarly, the 10 year UK gilt yield has leapt from 2.22% to 2.50%. These are extreme moves in a very short space of time and the reality is that in the lead-up to this week's US Federal Reserve and Bank of England policy meetings we can realistically expect high levels of volatility to continue.
Right now the only asset that isn't falling in value is cash, therefore trying to time the market in this situation is akin to trying to catch a falling knife. It's very risky and coming out the other side unscathed, when making changes to my portfolio, would be more down to luck than judgement. It is for this reason that I am holding off making any changes to my portfolio for now.
Ideally, I had planned to review my exposure to Fidelity Global Property, Invesco High Yield (UK) and Fidelity US Index, in line with the usual process I follow. But the level of volatility in markets right now means that I would rather wait for the dust to settle, a case of watching a falling knife rather than trying to catch it.
The risks to my portfolio remain as last time... "that bonds could suddenly rally as inflation fears subside and fears of a recession increase. My portfolio has limited exposure to bonds - which is one of the reasons why it has outperformed - but also has exposure to gold and other commodities. If we have a global economic growth shock then bonds could rally strongly, while equity markets could fall along with commodities. That would be negative for my portfolio. So while my portfolio is outperforming significantly right now I am humble enough to realise that could change if the market narrative suddenly pivots".
Once again it still remains true that if my portfolio was to reside in the Mixed Investment 40-85% Shares sector of professionally managed funds it would be ranked in the top quartile for Alpha and Sharpe ratios since the portfolio's inception 7 years ago. Not only that but it would also now rank in the top quartile for performance too (despite its relatively modest equity exposure). I explain what Alpha and Sharpe were and how they work in last month's review. Ultimately, this month's portfolio review is a case of if it's not completely broken, there's no rush to fix it.
Fund switches
I am making no changes to my portfolio, for the time being, instead waiting for the dust to settle on the latest bout of extreme bond and equity market volatility.
My portfolio
My portfolio still looks like this:
| Name | Allocation % (rounded) | Risk | Sector | ISIN Code |
| BlackRock Natural Resources Growth & Income | 6% | High | Commodity/Natural Resource | GB00B6865B79 |
| BM SVS Brooks Macdonald Defensive Capital | 10% | Low | Targeted Absolute Return | GB00B61MR835 |
| Cash | 6.5% | Low | ||
| Fidelity American Special Situations | 8.5% | Medium | North America | GB00B89ST706 |
| Fidelity Global Property | 8% | High | Property Other | GB00B7K2NZ09 |
| Fidelity Index US | 11% | High | North America | GB00BJS8SH10 |
| Invesco High Yield (UK) | 3.5% | Low | Sterling High Yield | GB00B3RW7649 |
| Invesco UK Opportunities (UK) | 7.5% | Medium | UK All Companies | GB00B1W7HM62 |
| iShares Physical Gold ETC | 5% | Medium | Commodity & Energy ETF | IE00B4ND3602 |
| M&G Global Dividend | 9% | Medium | Global | GB00B46J9127 |
| Premier Miton Defensive Growth | 12% | Low | Targeted Absolute Return | GB00B832BD89 |
| Thesis TM Tellworth UK Select | 5% | Low | Targeted Absolute Return | GB00BNY7YM73 |
| Troy Asset Management Ltd Trojan Ethical | 8% | Low | Flexible Investment | GB00BJP0XX17 |
My Portfolio asset mix
My portfolio asset mix still has around 60% exposure to equities. Last month's figures are shown in brackets.
-
- UK Equities 13% (13%)
- North American Equities 19% (19%)
- Asian/Emerging Market Equities 0% (0%)
- Japanese Equities 0% (0%)
- European Equities 2% (2%)
- Chinese equities 0% (0%)
- Other equity 9% (9%)
- Commodities and energy 15% (15%)
- UK Fixed Interest 0% (0%)
- Global Fixed Interest 8% (8%)
- Cash 6% (6%)
- Alternative Investment Strategies 20% (20%)
- Property 8% (8%)
Damien's higher risk and lower risk portfolios
Using the logic described in my post: Update to Damien’s alternative risk portfolios I created hypothetical higher and lower risk versions of my portfolio below:
Lower risk
| Fund | Allocation % |
| Fidelity American Special Situations | 11 |
| Invesco High Yield (UK) | 5 |
| Invesco UK Opportunities (UK) | 10 |
| iShares Physical Gold ETC | 7 |
| Premier Miton Defensive Growth | 16 |
| M&G Global Dividend | 12 |
| BM SVS Brooks Macdonald Defensive Capital | 13 |
| Thesis TM Tellworth UK Select | 7 |
| Troy Asset Management Ltd Trojan Ethical | 11 |
| Cash | 8 |
Higher risk
| Fund | Allocation % |
| BlackRock Natural Resources Growth & Income | 11 |
| Fidelity American Special Situations | 15 |
| Fidelity Global Property | 15 |
| Fidelity US Index | 20 |
| Invesco UK Opportunities (UK) | 14 |
| iShares Physical Gold ETC | 9 |
| M&G Global Dividend | 16 |

£200 Pension Cashback Offer
Make a qualifying deposit or transfer a pension to our partner Interactive Investor.
- Deposit or transfer a pension of at least £20k and you could earn £200 cashback
- Terms and Fees apply, Capital at risk
- New & Existing customers opening a SIPP
- Offer ends 31st July 2026
Before starting your transfer, check you won't lose any valuable benefits (such as guaranteed annuity rates or a lower protected pension age) and find out what exit fees you might have to pay
