

The background to my portfolio
Back in March 2015 I decided to invest £50,000 of my own money using 80-20 Investor. The purpose was twofold, firstly to show how you can use 80-20 Investor to invest and outperform the market with only a few minutes effort every now and then. Secondly, no other investment commentator, journalist or research provider invests their own money for fear of failing. This is a sorry state of affairs and is precisely why I committed to openly running my own portfolio for 80-20 Investor members to see.
Since then I have periodically changed my portfolio using the fund suggestions provided by the 80-20 Investor algorithm and associated research. I always disclose the changes at the time they are made.
Performance update
As is usual in my portfolio reviews, the chart below shows how my portfolio has outperformed since I started the challenge in March 2015. The green line is the performance of my portfolio while the red line is the benchmark showing the average return achieved by professional fund managers given the same asset mix. To accurately calculate this I have used the average return for each sector in which my portfolio invested. The blue line shows what the average multi-asset fund with comparable equity content achieved. In other words, the red line would show the extra performance added by just the asset mix of my portfolio (where I was invested i.e European equities etc) over picking a typical multi-asset fund (the blue line). While the green line (which is my actual performance) shows the impact of being in the right funds at the right time, as identified by the 80-20 Investor algorithm.
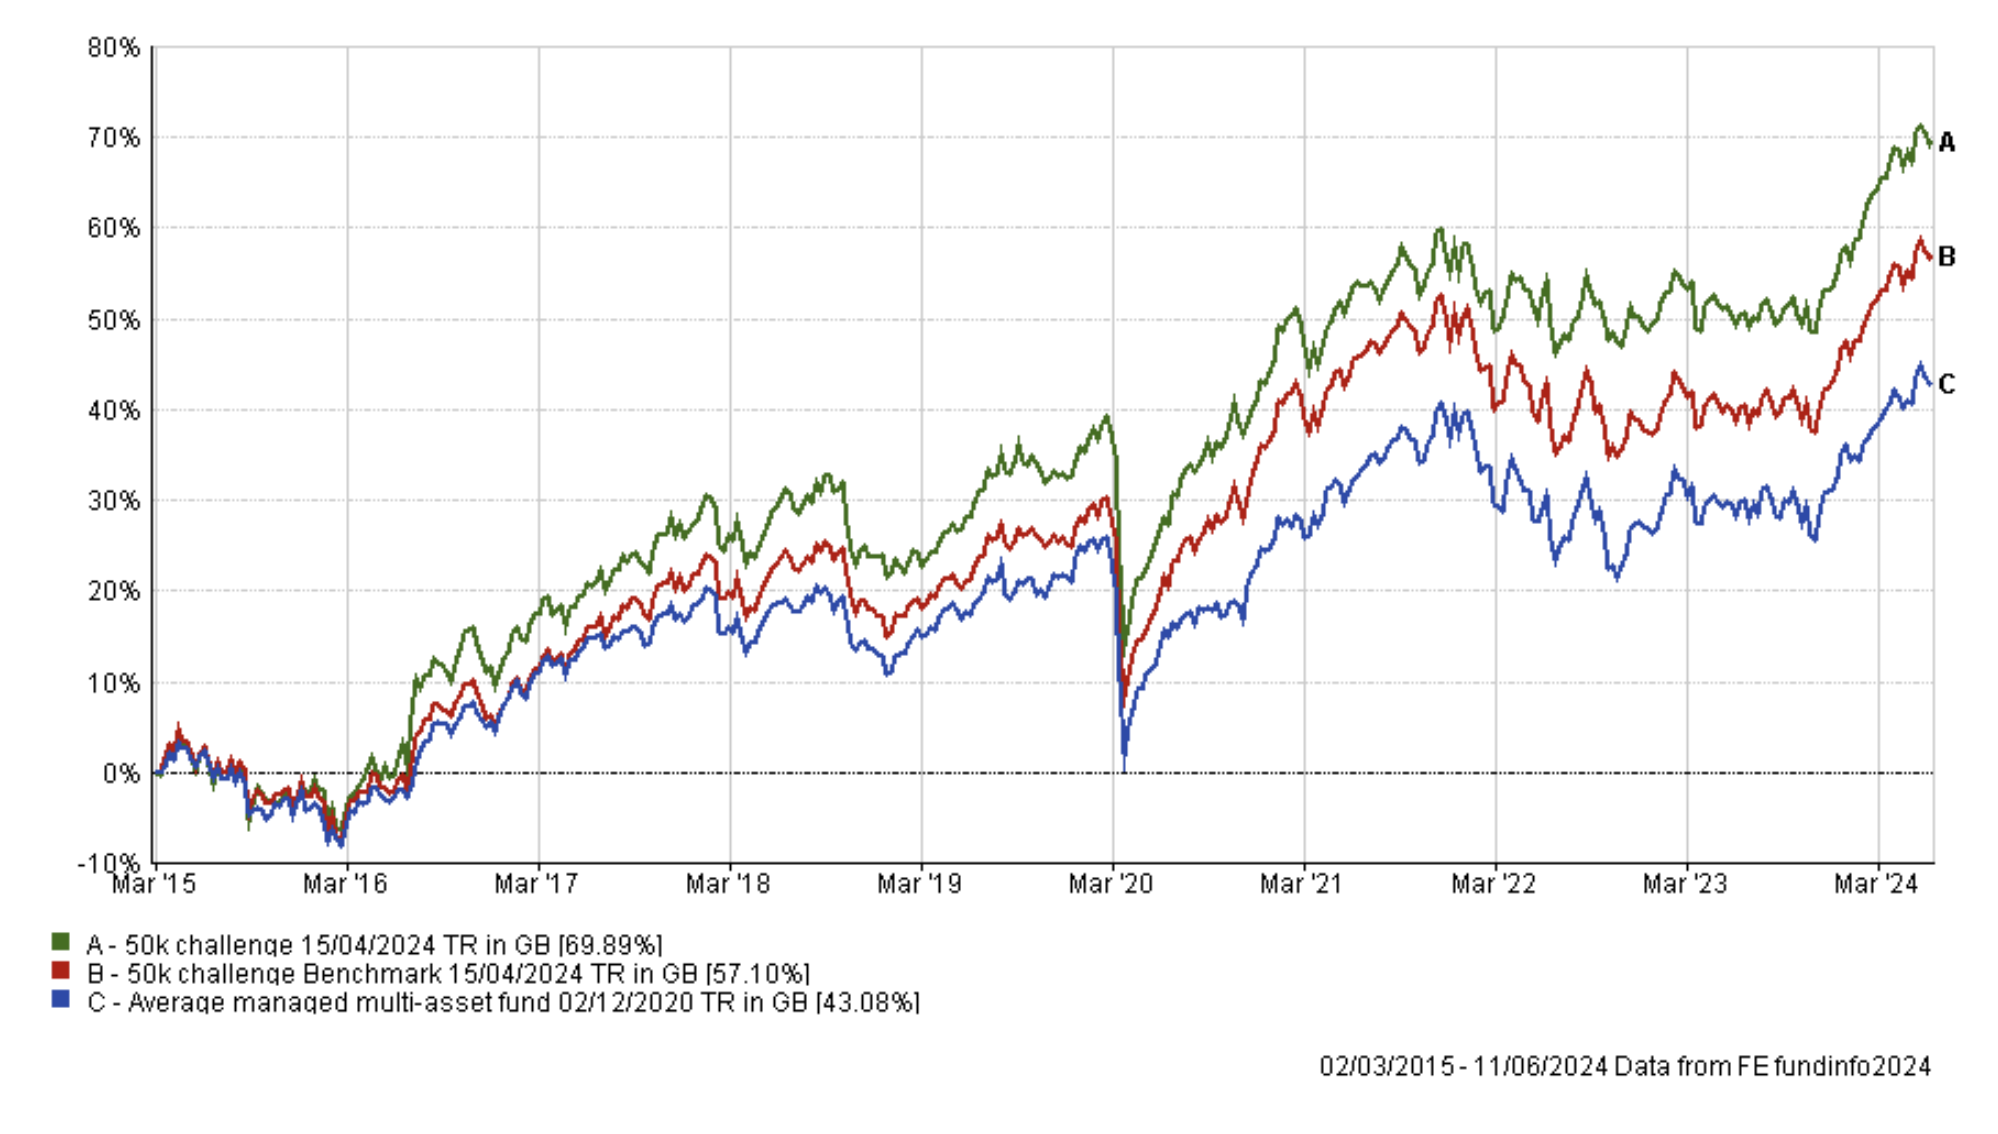
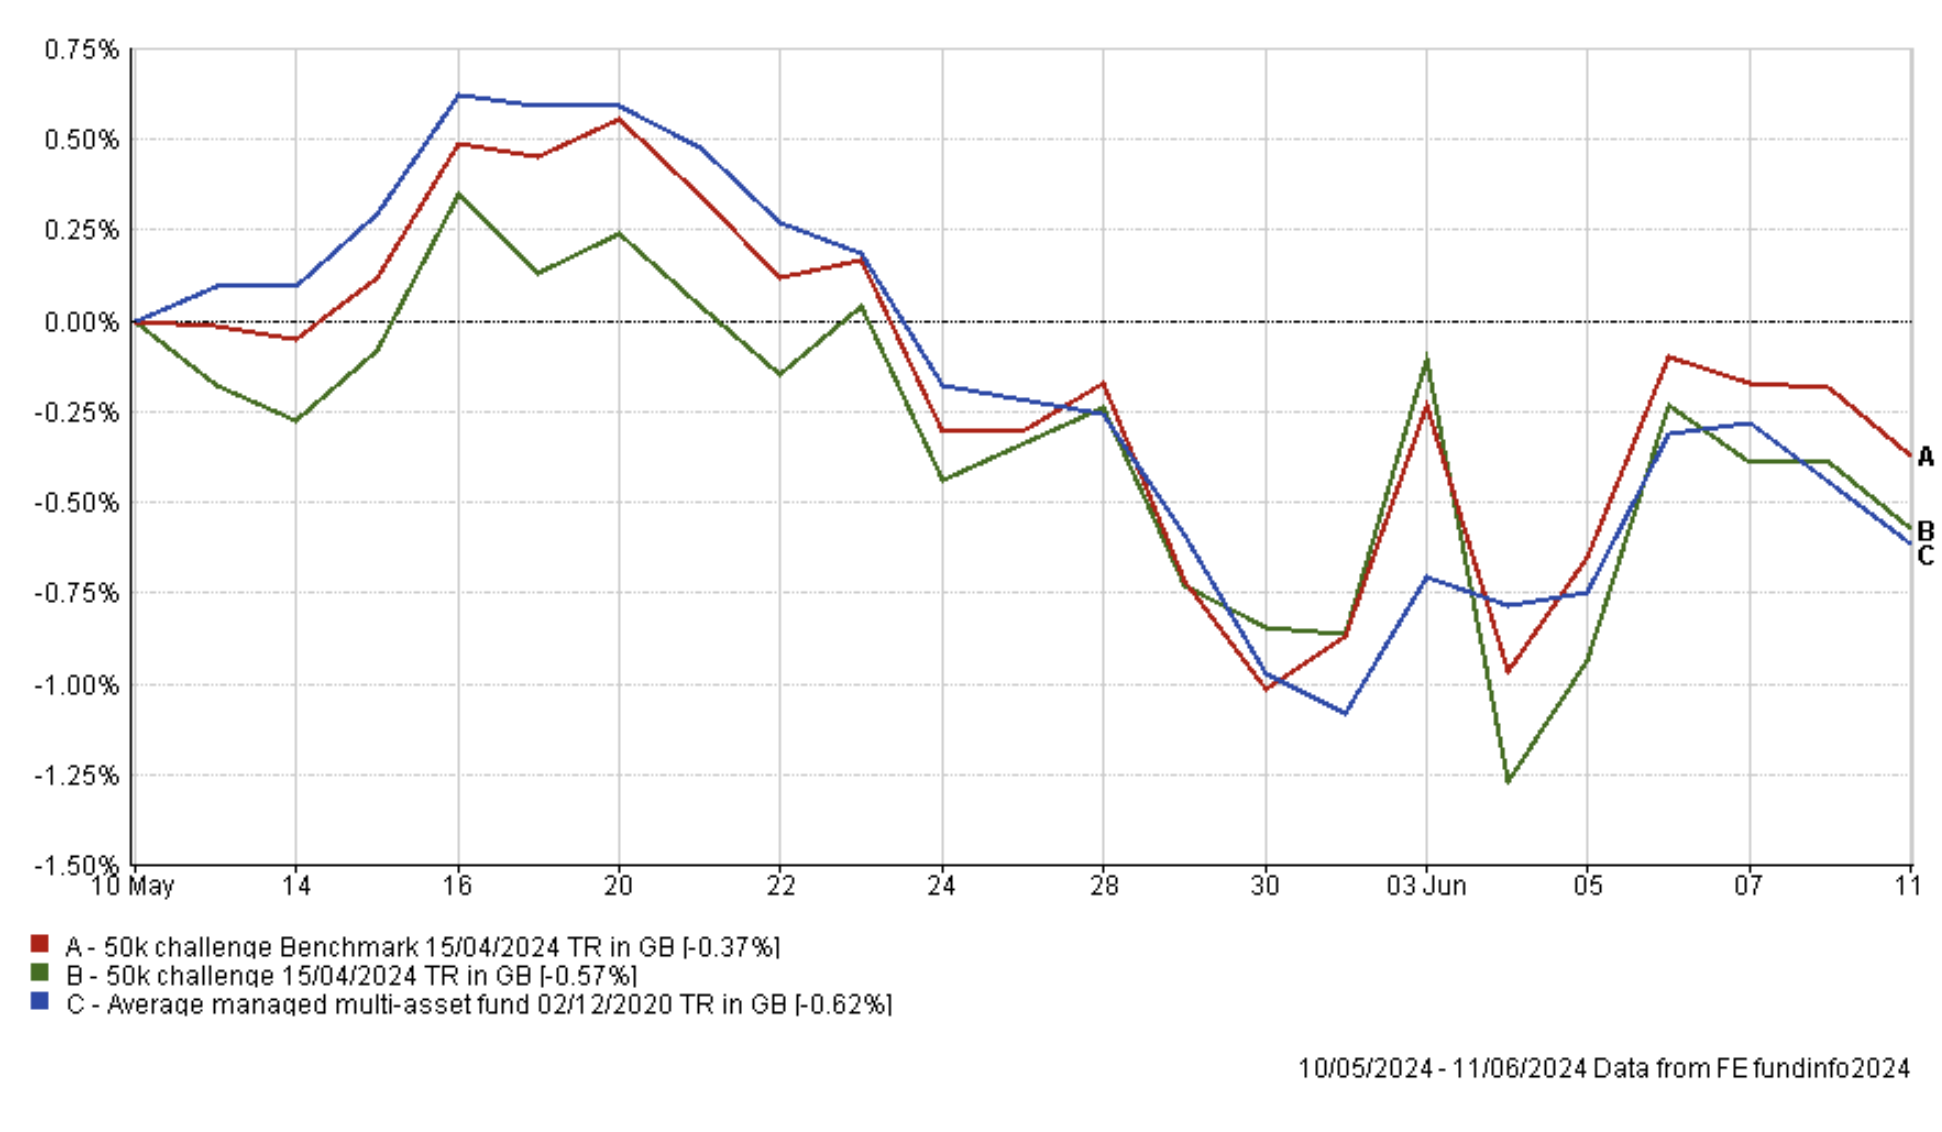
You can see how my portfolio continues to hover around its all-time high and continues to lead its benchmarks. The chart below shows how my portfolio has performed broadly in line with its benchmarks since my last review a month ago.
Turning my attention to how individual funds performed over the last month, as you can see from the table below there was a wide divergence in fortunes, in fact it's one of the widest I've seen for some time.
| Name | % return over the last month (since May's review) |
| Liontrust India | 3.54 |
| T. Rowe Price US Large Cap Growth Equity | 1.31 |
| Thesis TM Tellworth UK Select | 1.09 |
| abrdn High Yield Bond | 0.74 |
| Artemis US Select | 0.66 |
| Schroder Strategic Credit | 0.62 |
| Fidelity Index Japan | -0.15 |
| Ninety One UK Special Situations | -0.77 |
| BNY Mellon Multi-Asset Balanced | -1.04 |
| Artemis Global Income | -2.13 |
| Artemis European Select | -3.18 |
| iShares Physical Gold ETC | -3.94 |
| WS Saracen Global Income and Growth | -4.07 |
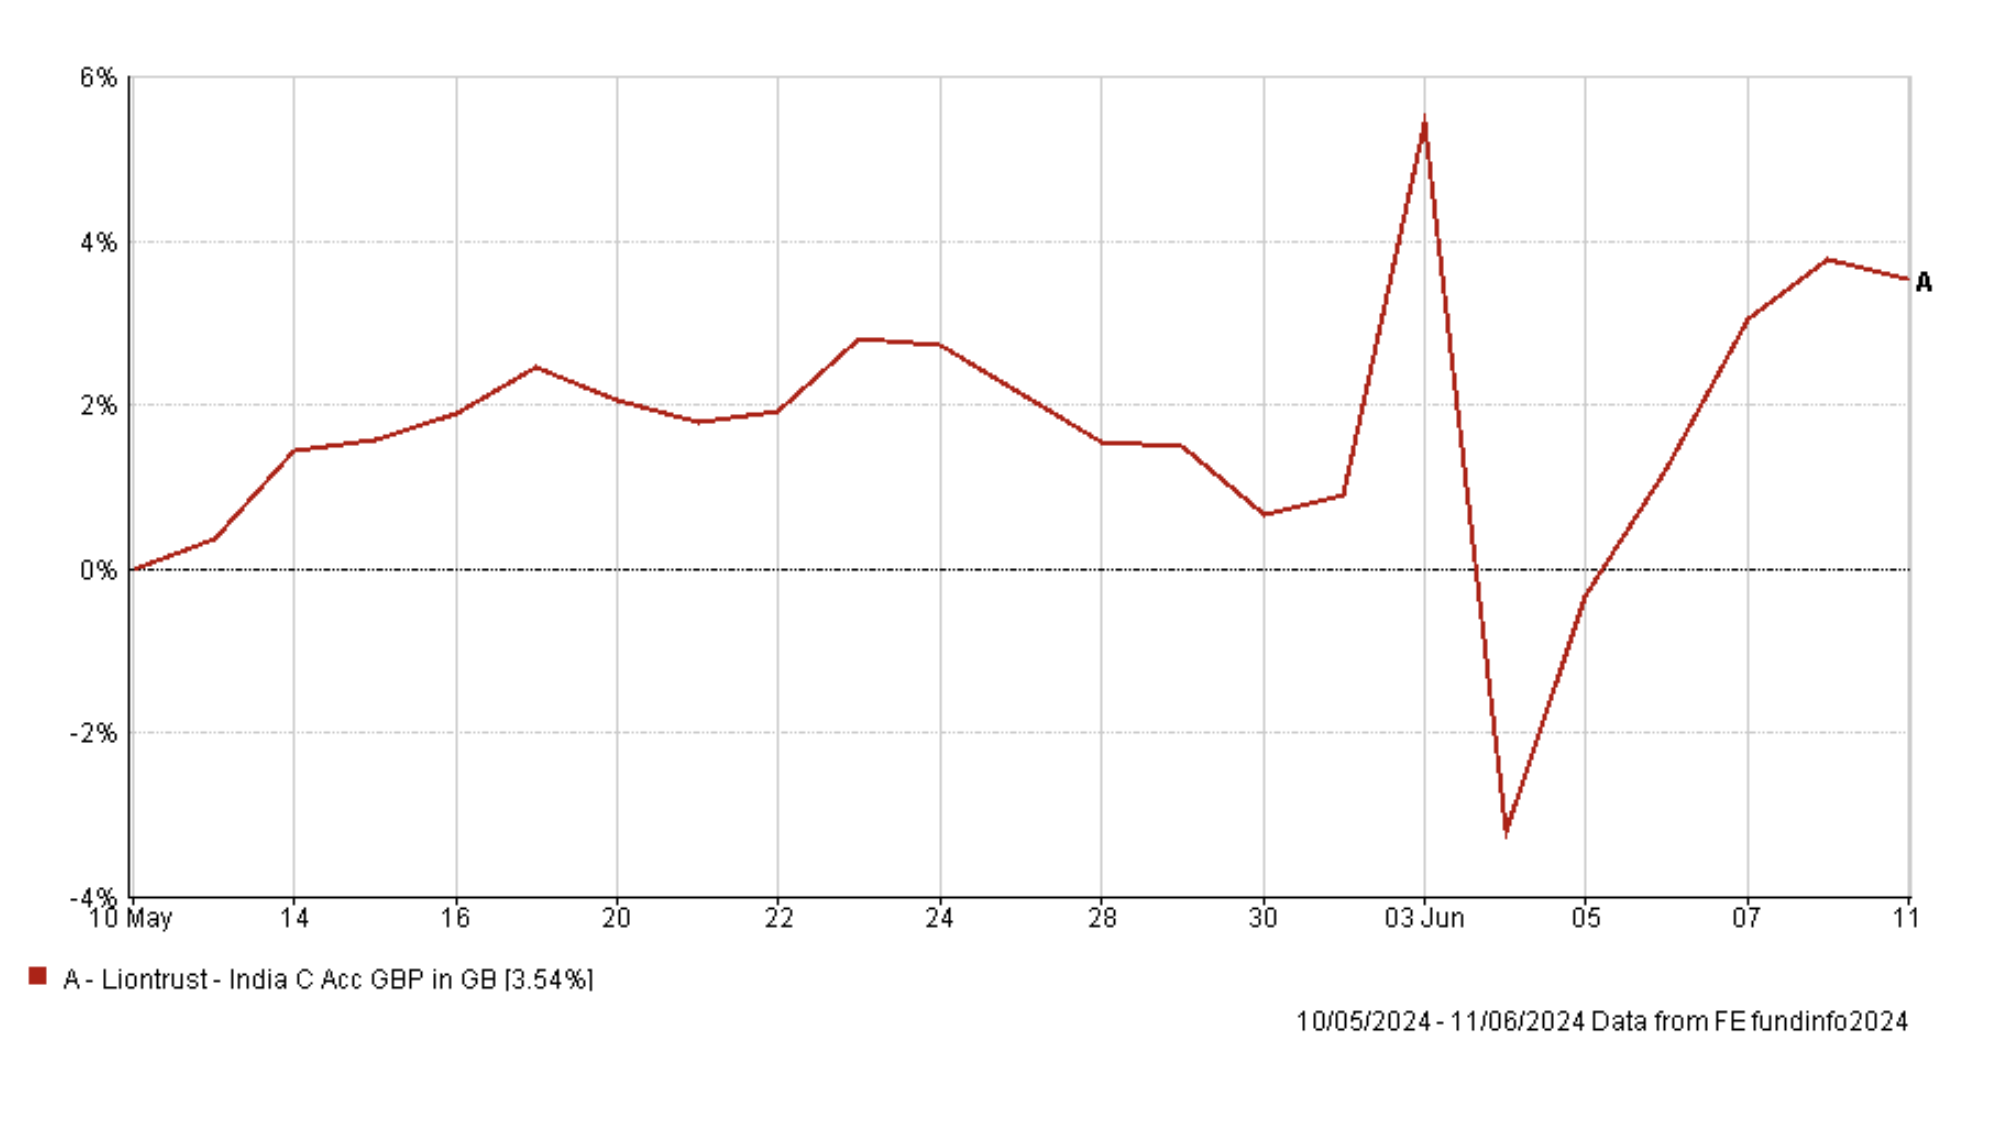
The top performer was Liontrust India, which itself had an incredibly volatile month as shown in the chart below. The extreme volatility at the start of June was driven by the election in India.
At the other end of the scale was WS Saracen Global Income and Growth. Interestingly this month's performance table, with large cap US stocks outperforming alongside the low risk funds within my portfolio, is almost the inverse of the previous month's performance table. Other notable performances this time came from Thesis TM Tellworth UK Select, which again was one of the best performing funds within the lower risk portion of my portfolio, after a stay of execution last month. Meanwhile, Artemis European Select continued to disappoint.
As usual, the table below shows which funds within my portfolio are in the current BOTB or BFBS tables and which are not. Those funds in blue are still in the BOTB while those in orange are not in the BOTB but remain in the BFBS list. Meanwhile, any funds in red have dropped out of both shortlists.
| Fund | Allocation | Risk | Sector | ISIN |
| abrdn High Yield Bond | 14 | Lower | Sterling High Yield | GB00B79RR984 |
| Artemis European Select | 5 | Medium | Europe Excluding UK | GB00B6WFCR53 |
| Artemis Global Income | 11 | Medium | Global Equity Income | GB00B5N99561 |
| Artemis US Select | 5 | Medium | North America | GB00BMMV5105 |
| BNY Mellon Multi-Asset Balanced | 8 | Medium | Mixed Investment 40-85% Shares | GB00B8K9JZ06 |
| Fidelity Index Japan | 5.5 | Medium | Japan | GB00BHZK8872 |
| iShares Physical Gold ETC | 5.5 | Medium | Commodity & Energy ETF | IE00B4ND3602 |
| Liontrust India | 6 | Higher | India/Indian Subcontinent | GB00B1L6DV51 |
| Ninety One UK Special Situations | 5 | Higher | UK All Companies | GB00B1XFJS91 |
| Schroder Strategic Credit | 8 | Lower | Sterling Strategic Bond | GB00BJZ2ZC09 |
| T. Rowe Price US Large Cap Growth Equity | 11 | Higher | North America | GB00BD5FHW12 |
| Thesis TM Tellworth UK Select | 5.5 | Lower | Targeted Absolute Return | GB00BNY7YM73 |
| WS Saracen Global Income & Growth | 10.5 | Medium | Global Equity Income | GB00B5B35X02 |
There are three funds that have fallen out of the BOTB and BFBS tables and are coloured in red They are:
- Artemis European Select
- BNY Mellon Multi-Asset Balanced
- Thesis TM Tellworth UK Select
Both BNY Mellon Multi-Asset Balanced & Thesis TM Tellworth UK Select funds were in the 'red list' last time around. Thesis TM Tellworth UK Select was given a stay of execution last month as it was the top-performing lower risk fund within my portfolio during April/May, outperforming both abrdn High Yield Bond and Schroder Strategic Credit (the other lower risk funds in my portfolio). This is a feat the Thesis fund has repeated again across May and June as shown in the chart below.
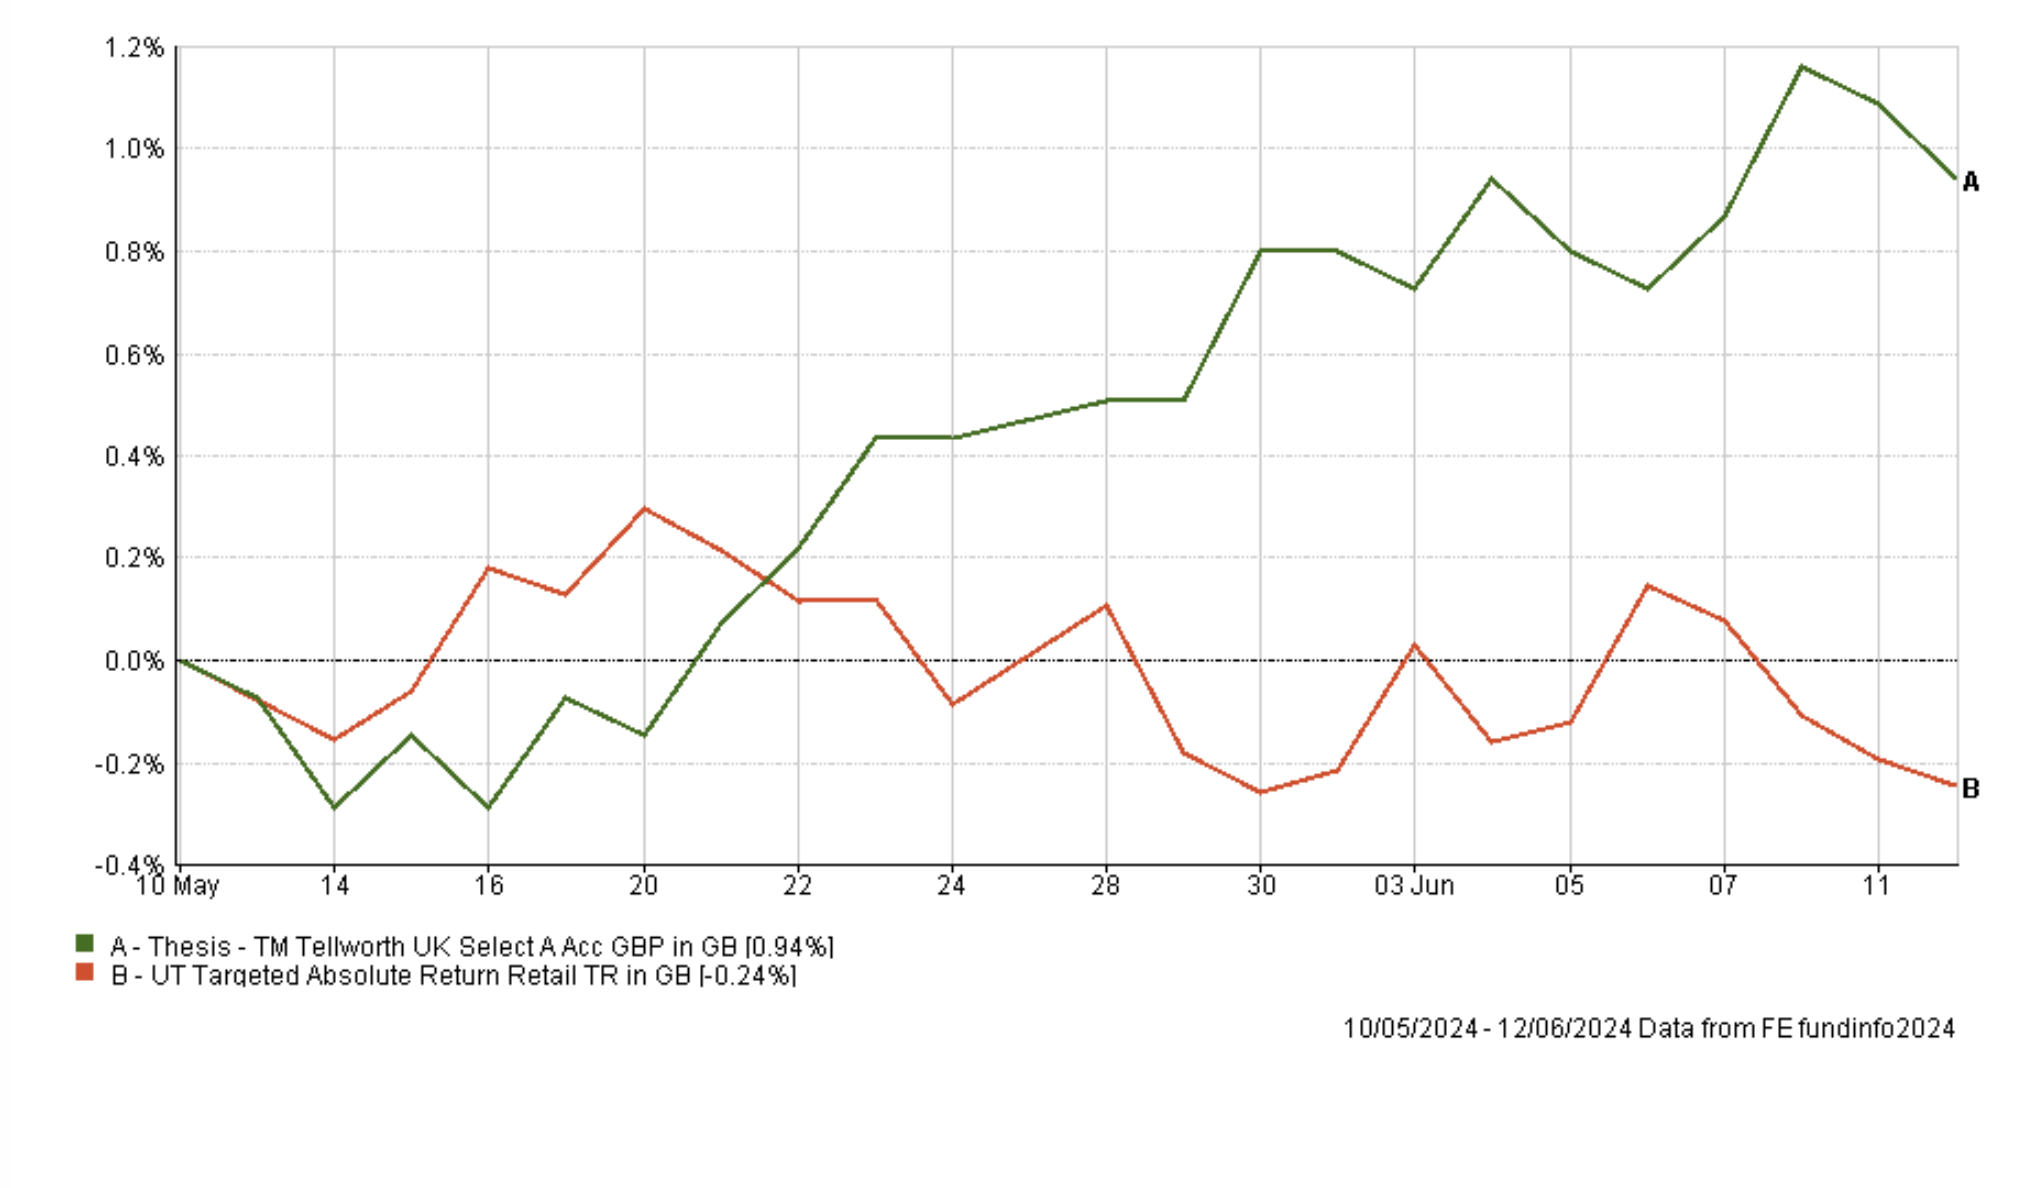
Last month I looked at alternative lower risk options, including bond funds, but they had mostly lagged the short term performance of the Thesis fund. Meanwhile a number of Targeted Absolute Return funds that made May's BOTB and BFBS tables weren't available on my platform of choice.
Interestingly, over the last months only 7 funds out of all 237 funds across the Targeted Absolute Return, Sterling HIgh Yield, Sterling Strategic Bond, Sterling Corporate Bond and Global bond sectors outperformed Thesis TM Tellworth UK Select. That is pretty incredible. The reason for the outperformance of the Thesis fund is that over the last month bond yields rose as inflation concerns returned. Obviously if bond yields start to fall in the future then the Thesis fund will underperform but for now it is difficult to make a case for replacing the fund. Also there is the likelihood that its recent performance will nudge it back into the BFBS table.
BNY Mellon Multi-Asset Balanced was also given a stay of execution last month as well. The chart below shows how well the fund has performed in recent months versus its sector average and the only funds from the same sector that have made the BFBS or BOTB tables.
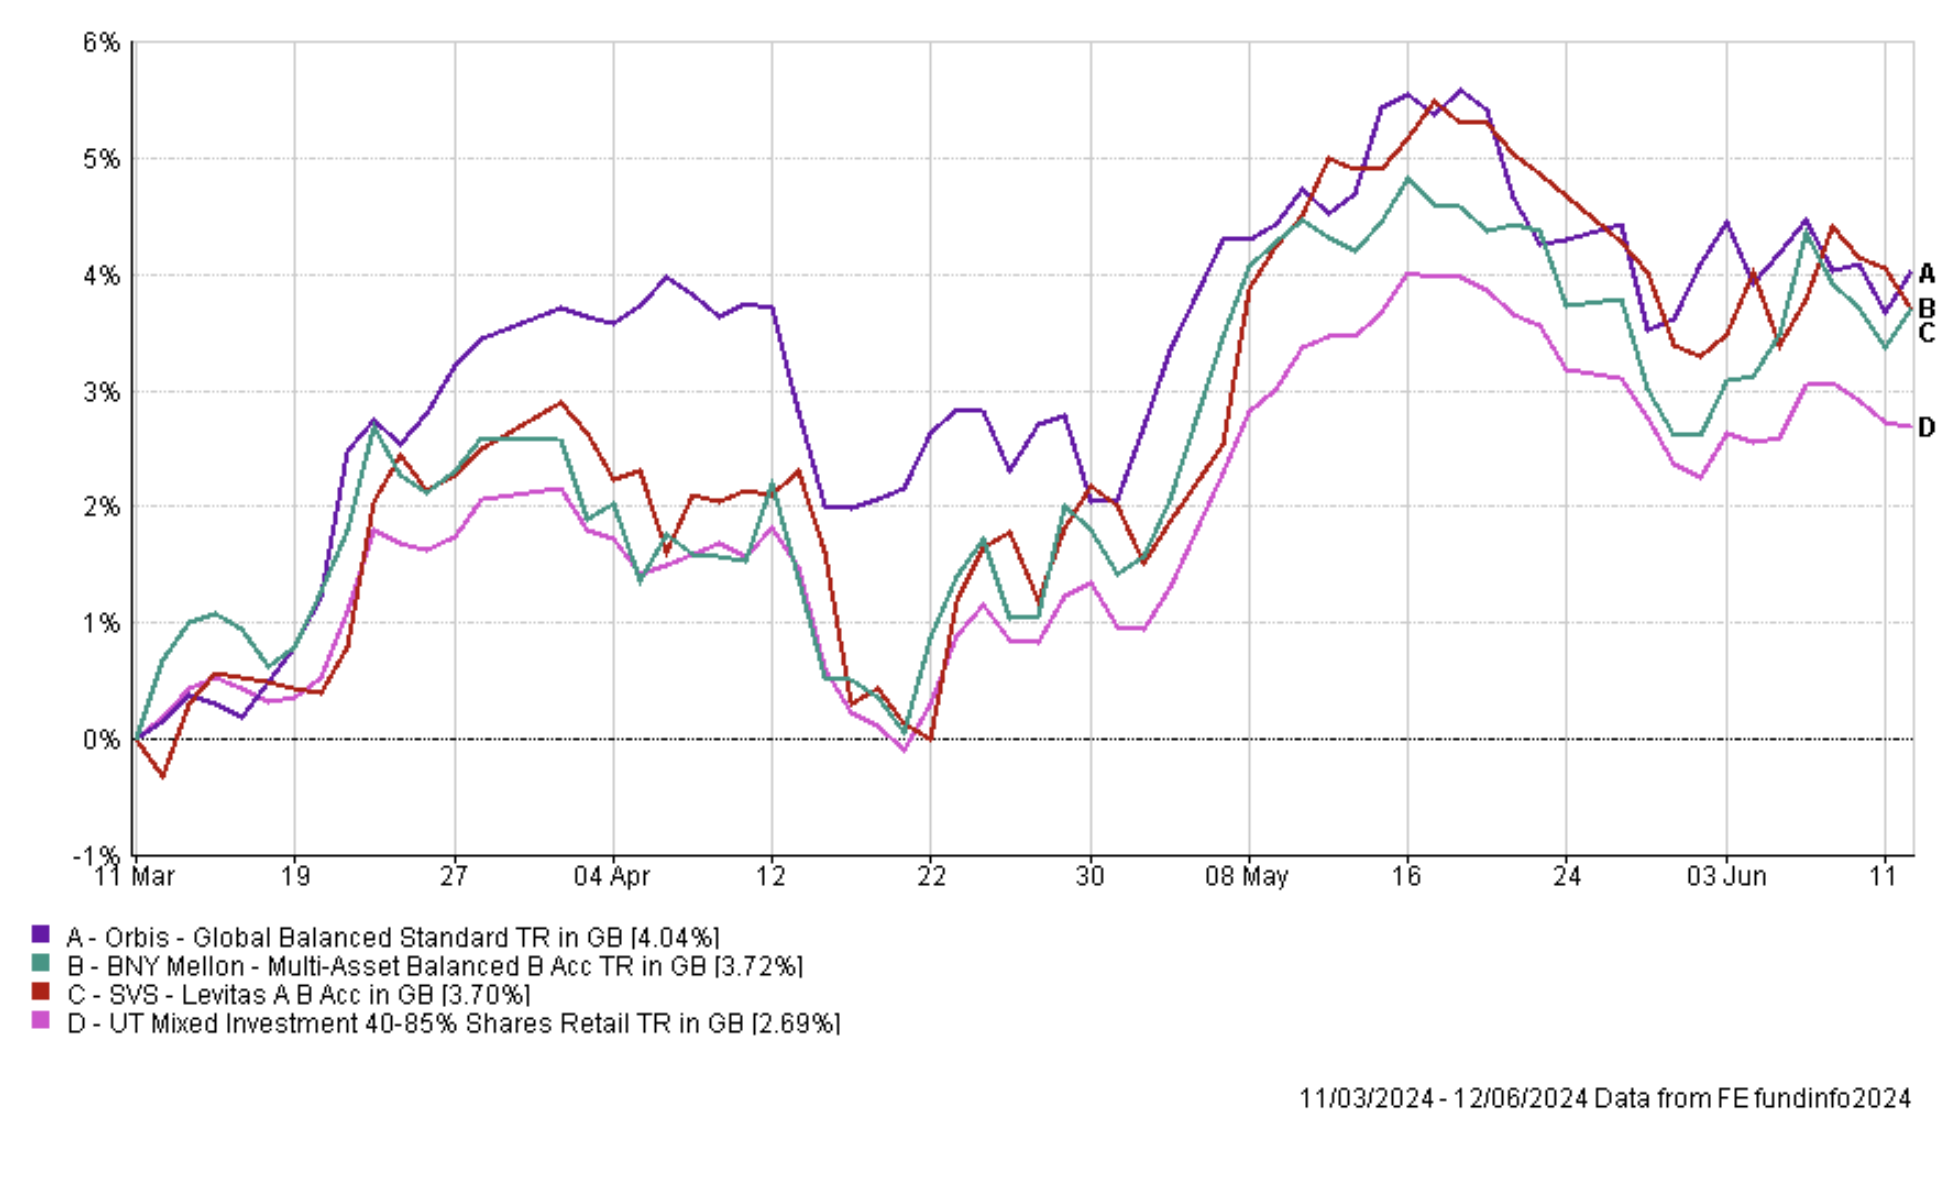
With the portfolio still performing well I don't want to make significant asset allocation changes. As such I was looking to potentially replace the BNY Mellon Multi-Asset Balanced fund with another from the same sector. But as you can see the only alternatives that are in the BFBS table (there are none in the BOTB table this month) have performed in line with my existing holding. In any event, neither alternative is available on my investment platform of choice.
I could sell the holding and then split the proceeds across a mixture of bond and equity holdings within my portfolio, but that would be forcing the issue. Also my asset allocation is now more in line with the BOTB, after the BOTB reduced its US equity exposure in favour of UK equities. So the sense of urgency to change things has reduced. So I will leave the fund within my portfolio and review it next time.
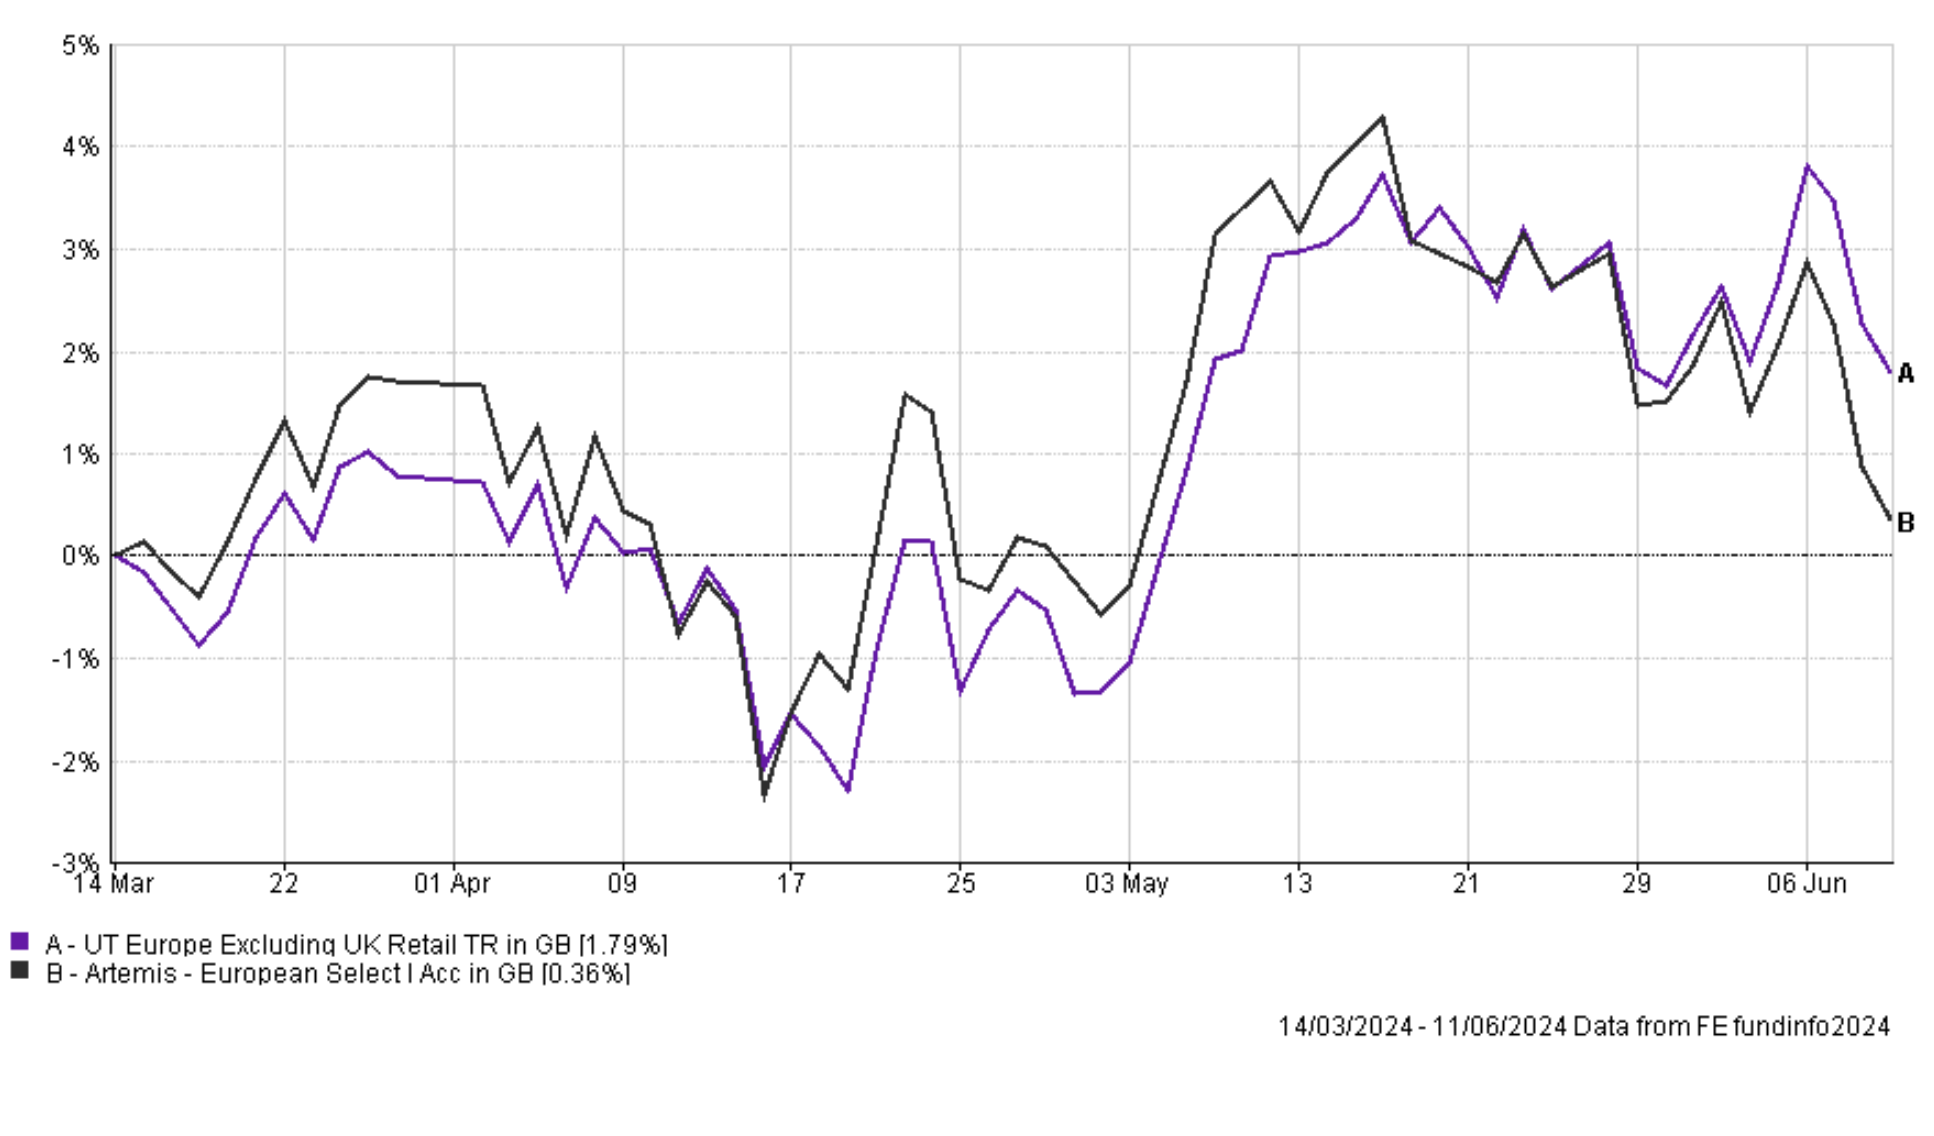
The only other fund on the red list is Artemis European Select. The fund has had a difficult month since my last review.
It means that the fund has started to underperform its sector average since I've held it.
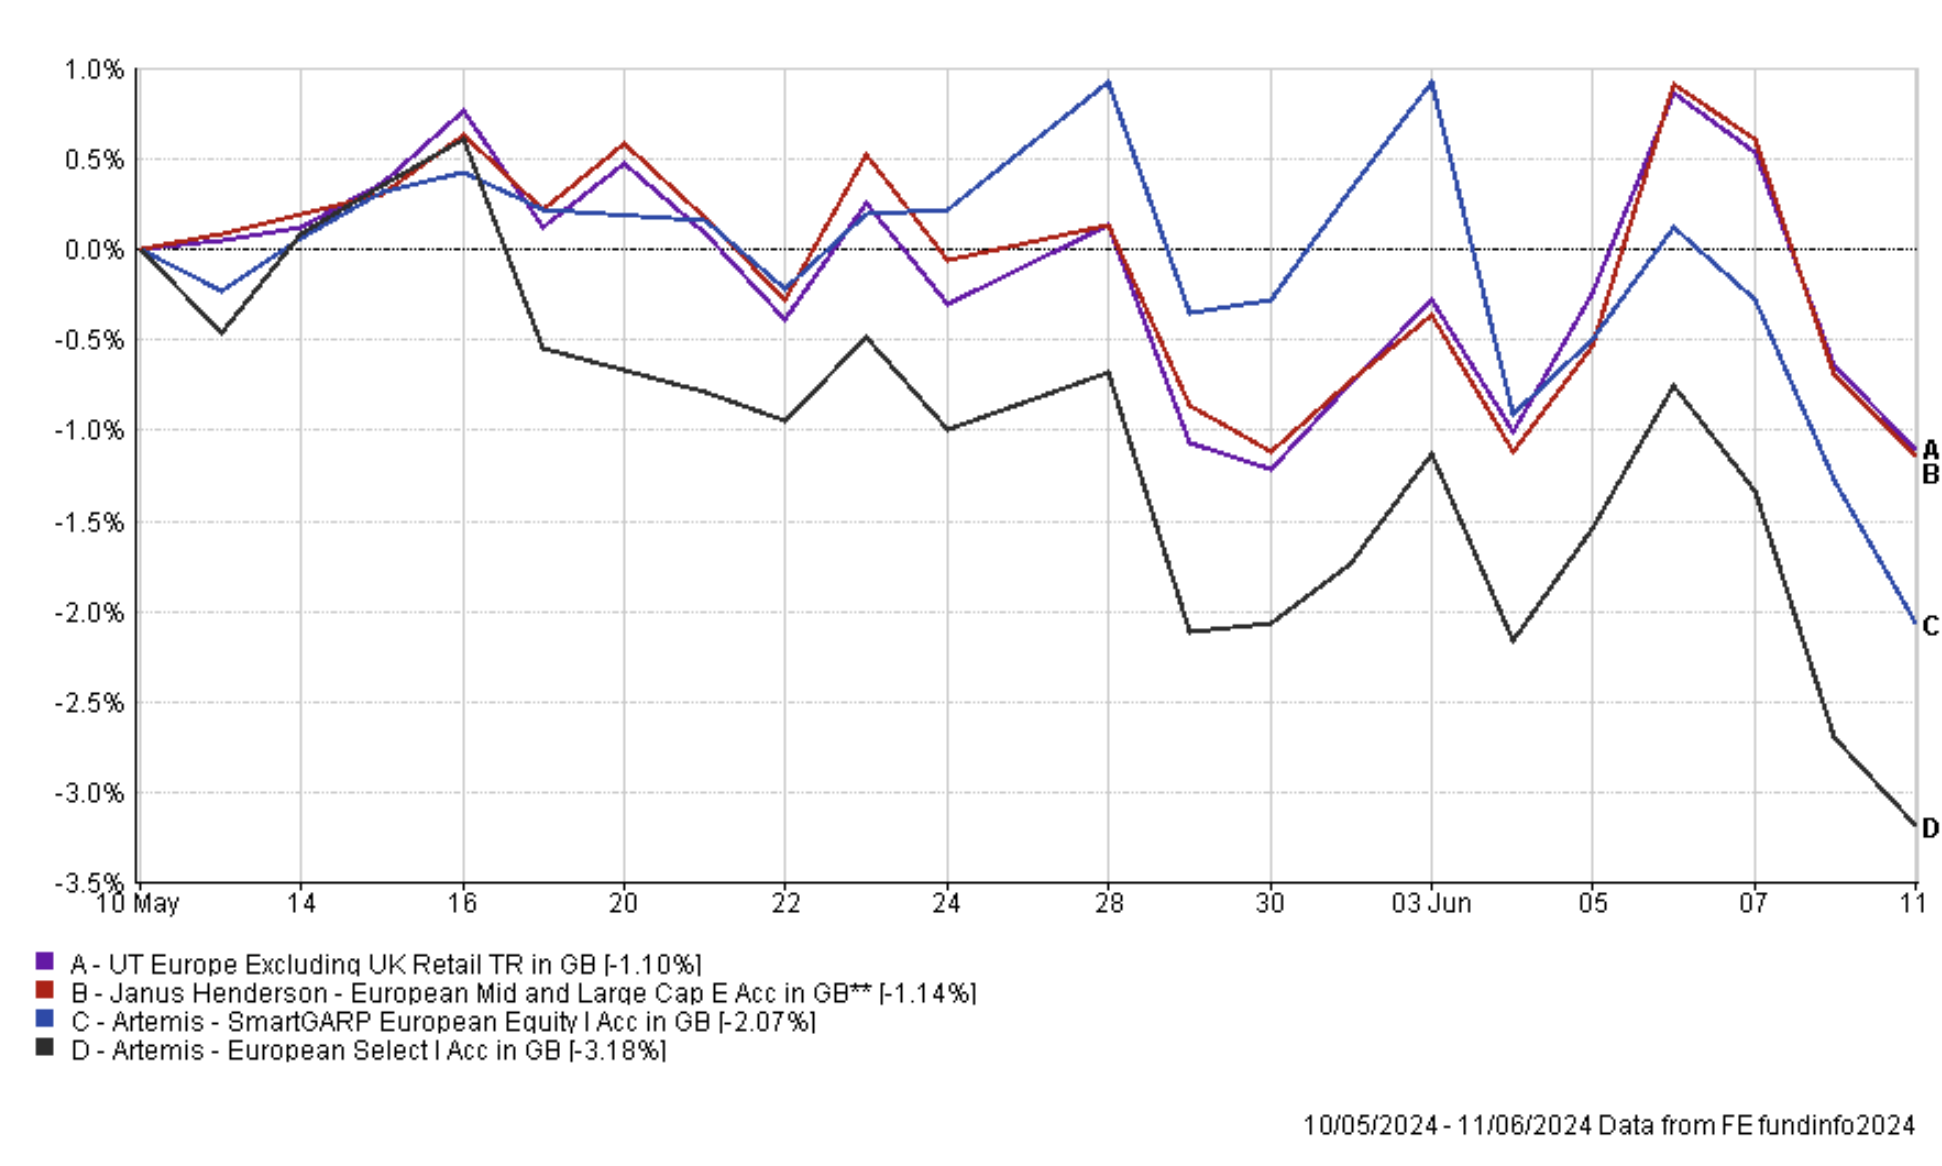
Given the fund's disappointing performance, certainly since May, I will replace it with another European equity fund which will keep my asset mix the same. In the earlier chart you can see the performance of the alternative European equity funds within the BOTB. The Artemis SmartGARP European Equity fund has had a similarly disappointing May/June to the Artemis Select fund so I will look to replace my existing holding with the Janus Henderson European Mid & Large Cap fund which has fared better.
Fund switches
100% out of Artemis European Select and 100% into the Janus Henderson European Mid & Large Cap
My portfolio
My portfolio looks like this:
| Fund | Allocation | Risk | Sector | ISIN |
| abrdn High Yield Bond | 14 | Lower | Sterling High Yield | GB00B79RR984 |
| Artemis Global Income | 11 | Medium | Global Equity Income | GB00B5N99561 |
| Artemis US Select | 5 | Medium | North America | GB00BMMV5105 |
| BNY Mellon Multi-Asset Balanced | 8 | Medium | Mixed Investment 40-85% Shares | GB00B8K9JZ06 |
| Fidelity Index Japan | 5.5 | Medium | Japan | GB00BHZK8872 |
| iShares Physical Gold ETC | 5.5 | Medium | Commodity & Energy ETF | IE00B4ND3602 |
| Janus Henderson European Mid & Large Cap | 5 | Higher | Europe Excluding UK | GB00BJ0LFG67 |
| Liontrust India | 6 | Higher | India/Indian Subcontinent | GB00B1L6DV51 |
| Ninety One UK Special Situations | 5 | Higher | UK All Companies | GB00B1XFJS91 |
| Schroder Strategic Credit | 8 | Lower | Sterling Strategic Bond | GB00BJZ2ZC09 |
| T. Rowe Price US Large Cap Growth Equity | 11 | Higher | North America | GB00BD5FHW12 |
| Thesis TM Tellworth UK Select | 5.5 | Lower | Targeted Absolute Return | GB00BNY7YM73 |
| WS Saracen Global Income & Growth* | 10.5 | Medium | Global Equity Income | GB00B5B35X02 |
My Portfolio asset mix
My portfolio asset mix has approximately 65% exposure to equities. Last month's figures are shown in brackets.
-
- UK Equities 12% (12%)
- North American Equities 25% (25%)
- Asian/Emerging Market Equities 6% (6%)
- Japanese Equities 7% (7%)
- European Equities 13% (13%)
- Chinese equities 0% (0%)
- Other equity 2% (2%)
- Commodities and energy 5% (5%)
- UK Fixed Interest 4% (4%)
- Global Fixed Interest 18% (18%)
- Cash 1% (1%)
- Alternative Investment Strategies 7% (7%)
- Property 0% (0%)
Damien's higher risk and lower risk portfolios
Using the logic described in my post: Update to Damien’s alternative risk portfolios I created hypothetical higher and lower risk versions of my portfolio below:
Lower risk
| Fund | Allocation % |
| abrdn High Yield Bond | 19 |
| Artemis Global Income | 15 |
| Artemis US Select | 7 |
| BNY Mellon Multi-Asset Balanced | 11 |
| Fidelity Index Japan | 8 |
| iShares Physical Gold ETC | 8 |
| Schroder Strategic Credit | 11 |
| Thesis TM Tellworth UK Select | 8 |
| WS Saracen Global Income & Growth | 13 |
Higher risk
| Fund | Allocation % |
| Artemis Global Income | 15 |
| Artemis US Select | 7 |
| BNY Mellon Multi-Asset Balanced | 11 |
| Fidelity Index Japan | 8 |
| iShares Physical Gold ETC | 8 |
| Janus Henderson European Mid & Large Cap | 7 |
| Liontrust India | 8 |
| Ninety One UK Special Situations | 7 |
| T. Rowe Price US Large Cap Growth Equity | 15 |
| WS Saracen Global Income & Growth* | 14 |

£200 Pension Cashback Offer
Make a qualifying deposit or transfer a pension to our partner Interactive Investor.
- Deposit or transfer a pension of at least £20k and you could earn £200 cashback
- Terms and Fees apply, Capital at risk
- New & Existing customers opening a SIPP
- Offer ends 31st July 2026
Before starting your transfer, check you won't lose any valuable benefits (such as guaranteed annuity rates or a lower protected pension age) and find out what exit fees you might have to pay
