

The background to my portfolio
Back in March 2015 I decided to invest £50,000 of my own money using 80-20 Investor. The purpose was twofold, firstly to show how you can use 80-20 Investor to invest and outperform the market with only a few minutes effort every now and then. Secondly, no other investment commentator, journalist or research provider invests their own money for fear of failing. This is a sorry state of affairs and is precisely why I committed to openly running my own portfolio for 80-20 Investor members to see.
Since then I have periodically changed my portfolio using the fund suggestions provided by the 80-20 Investor algorithm and associated research. I always disclose the changes at the time they are made.
Performance update
As is usual in my portfolio reviews, the chart below shows how my portfolio has outperformed since I started the challenge in March 2015, which is almost seven years ago. The green line is the performance of my portfolio while the red line is the benchmark showing the average return achieved by professional fund managers given the same asset mix. To accurately calculate this I have used the average return for each sector in which my portfolio invested. The blue line shows what the average multi-asset fund with comparable equity content achieved. In other words, the red line would show the extra performance added by just the asset mix of my portfolio (where I was invested i.e European equities etc) over picking a typical multi-asset fund (the blue line). While the green line (which is my actual performance) shows the impact of being in the right funds at the right time, as identified by the 80-20 Investor algorithm.
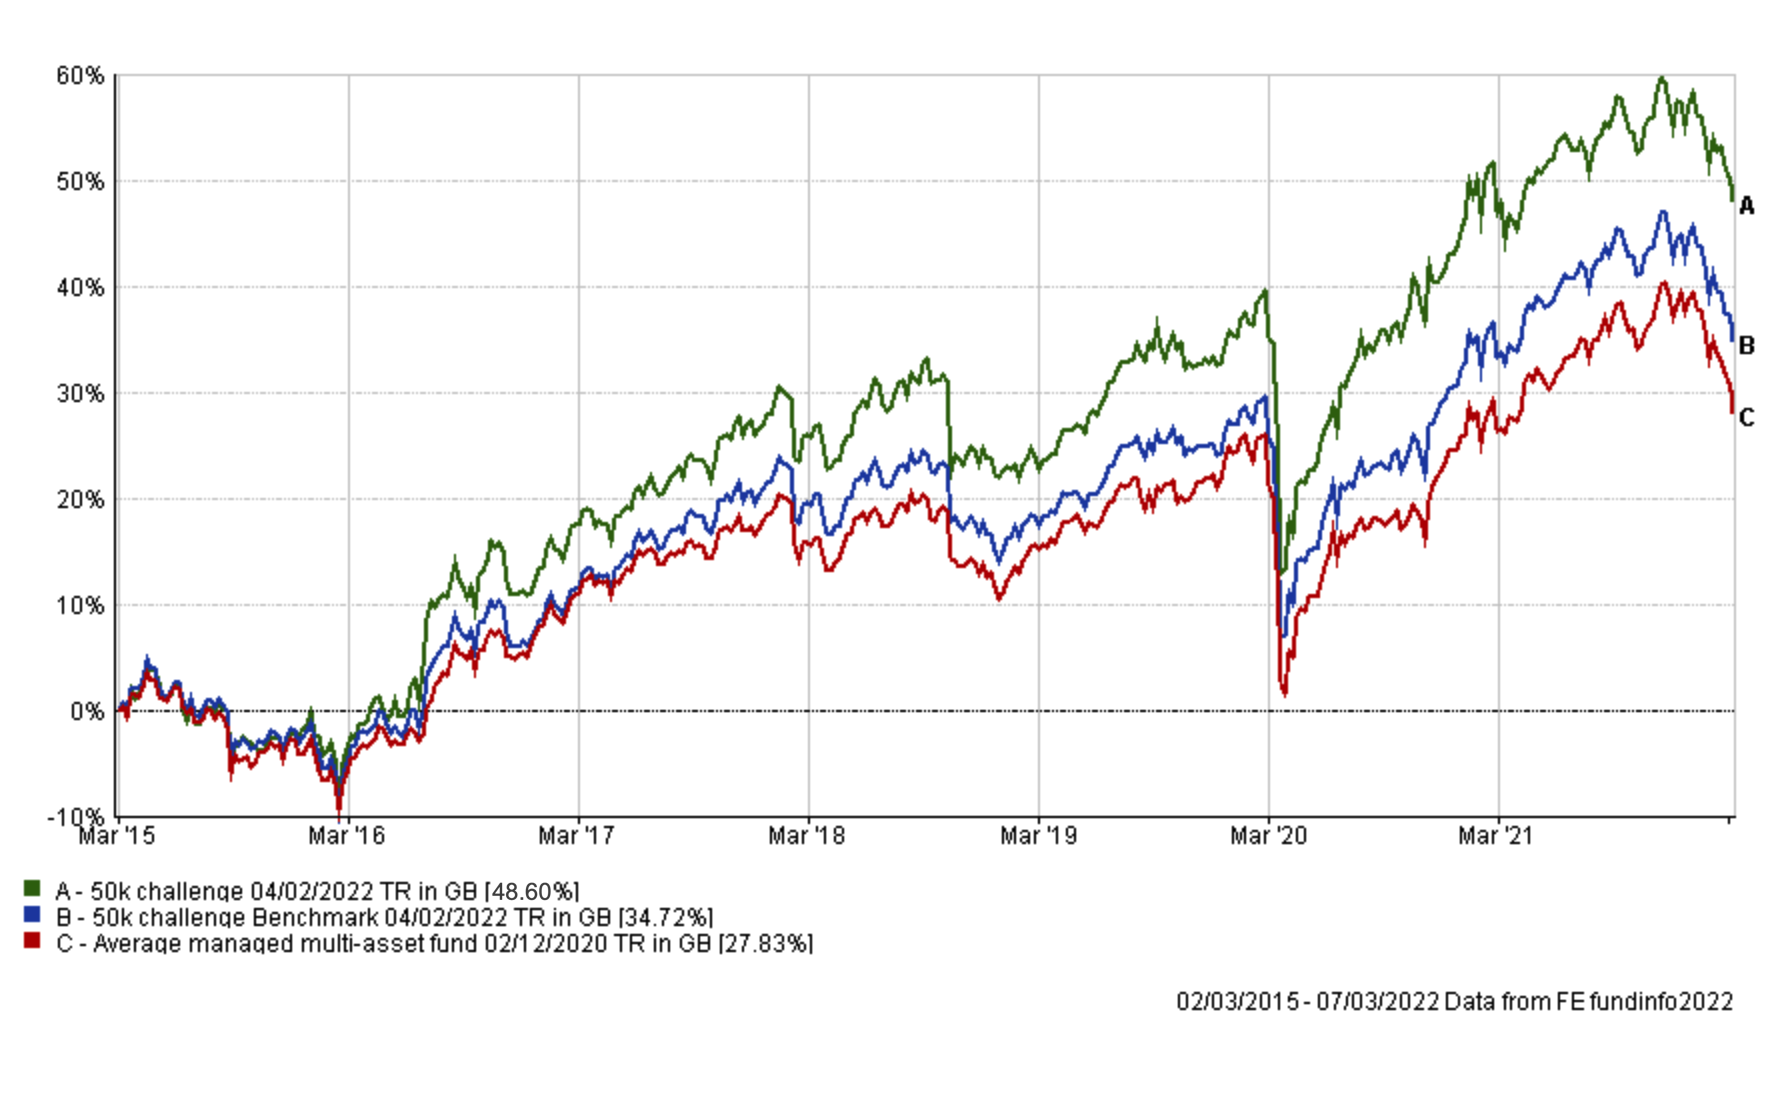
As you can see, during a tricky month in investment markets my £50k portfolio still extended its lead over its benchmarks. The chart below shows how my portfolio performed versus its benchmarks since my last review, a month ago. Following the fund switches I made last time it outperformed both benchmarks.
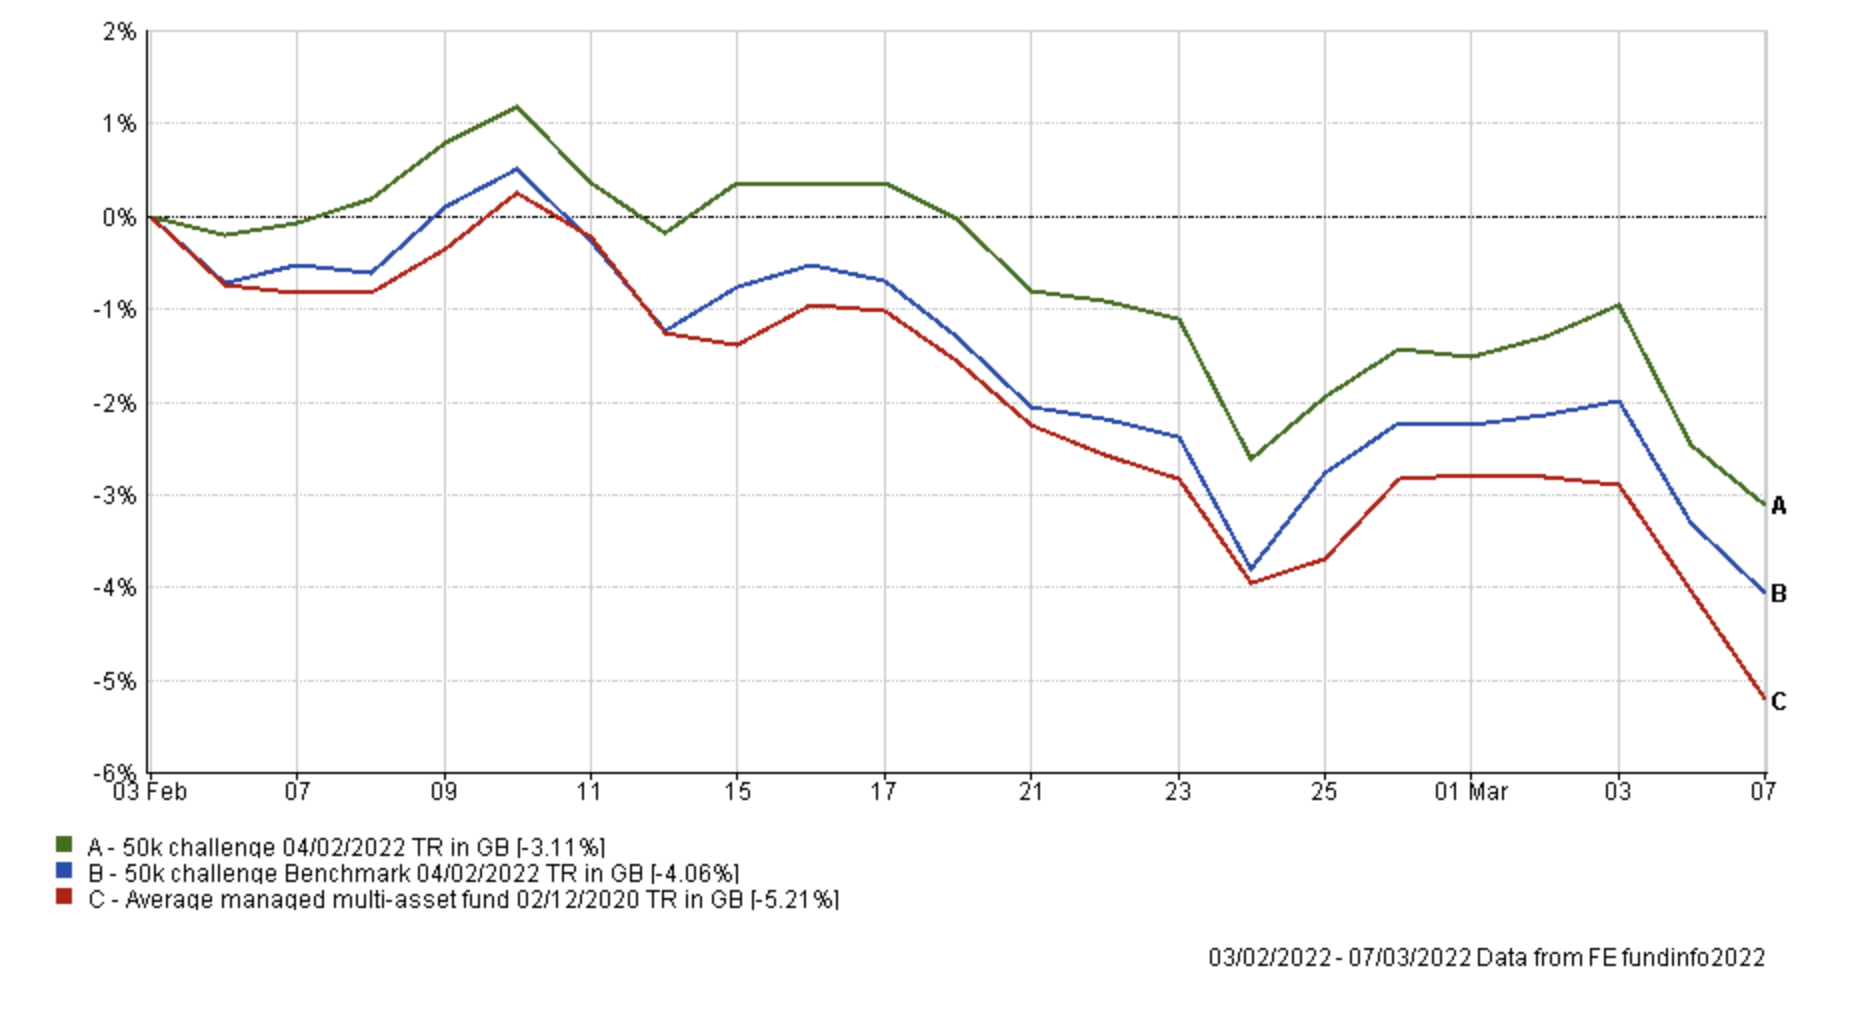
As I explained in March's monthly newsletter, February was a difficult month for investors as geopolitical tensions eventually culminated in an all-out invasion of Ukraine by Russia. February closed with every major stock market in the red as a result of the increased uncertainty over the path of inflation and central bank responses but also the path of the war in Ukraine. During February the German DAX was the hardest hit of the major western stock markets falling 6.53% during the month. The German economy has a significant reliance on Russian gas supplies, while its stock market index has a lack of energy companies within, which have been the chief beneficiaries of rising energy prices. The opposite can be said for the UK which is why the FTSE 100 was down only 0.08% during February. To give the moves some context the MSCI ACWI was down - 2.74%, the S&P 500 fell -3.14%, the FTSE Eurofirst 300 was down -3.23% and the Nasdaq 100 was down -4.64%.
The table below shows the individual performance of each holding in my portfolio since my last review a month ago. As you can see the performance falls in line with the above narrative. Gold has rocketed in price along with oil, gas and other commodities. While funds with exposure to European stocks fared the worst.
| Name | % return 3rd Feb to 7th March |
| iShares Physical Gold | 14.49 |
| BlackRock Natural Resources Growth & Income | 9.93 |
| Fidelity American Special Situations | 4.25 |
| Premier Miton Defensive Growth | 0.08 |
| Thesis TM Tellworth UK Select | -0.84 |
| Fidelity Global Property | -2.14 |
| Fidelity Index US | -2.21 |
| BM SVS Brooks Macdonald Defensive Capital | -3.43 |
| Invesco High Yield (UK) | -3.55 |
| Invesco UK Opportunities (UK) | -5.21 |
| Wise Funds Limited TB Wise Multi-Asset Growth | -9.72 |
| Fidelity UK Smaller Companies | -12.77 |
| Schroder European Recovery | -14.68 |
It is an interesting exercise to see the impact of the changes to my portfolio since the start of the year. The chart below shows the performance of my portfolio had I not made any changes and left it as it was at the start of 2022 (in blue), versus what has transpired as a result of my changes (in green). The performance of the average multi-asset fund is in red.
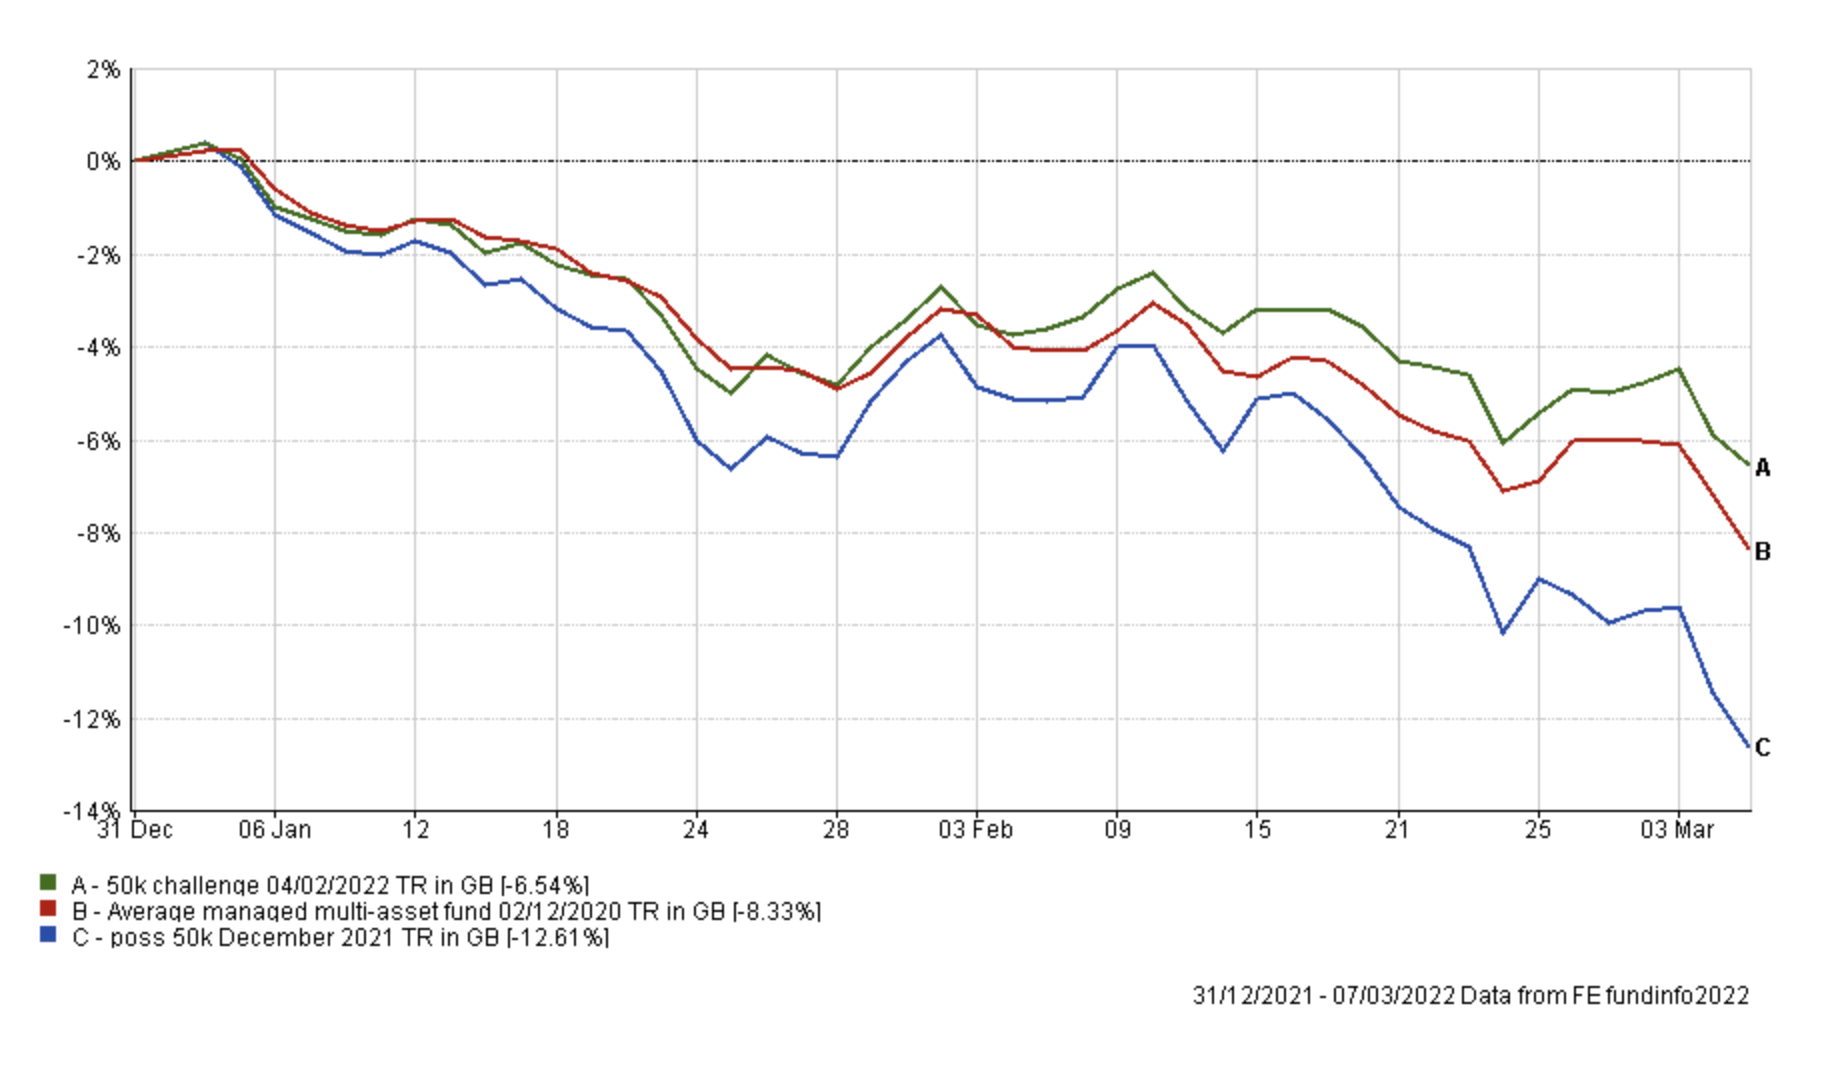
If you go back to my portfolio updates in January and February you will see some of the key decisions I made were to:
- reduce my equity exposure
- remove all Russian equity exposure
- move away from a reliance on tech stocks, instead favouring greater exposure to financials
- introduce a fund with the ability to short equity markets
All of these, with the benefit of hindsight, were very good decisions given what has since happened in investment markets.
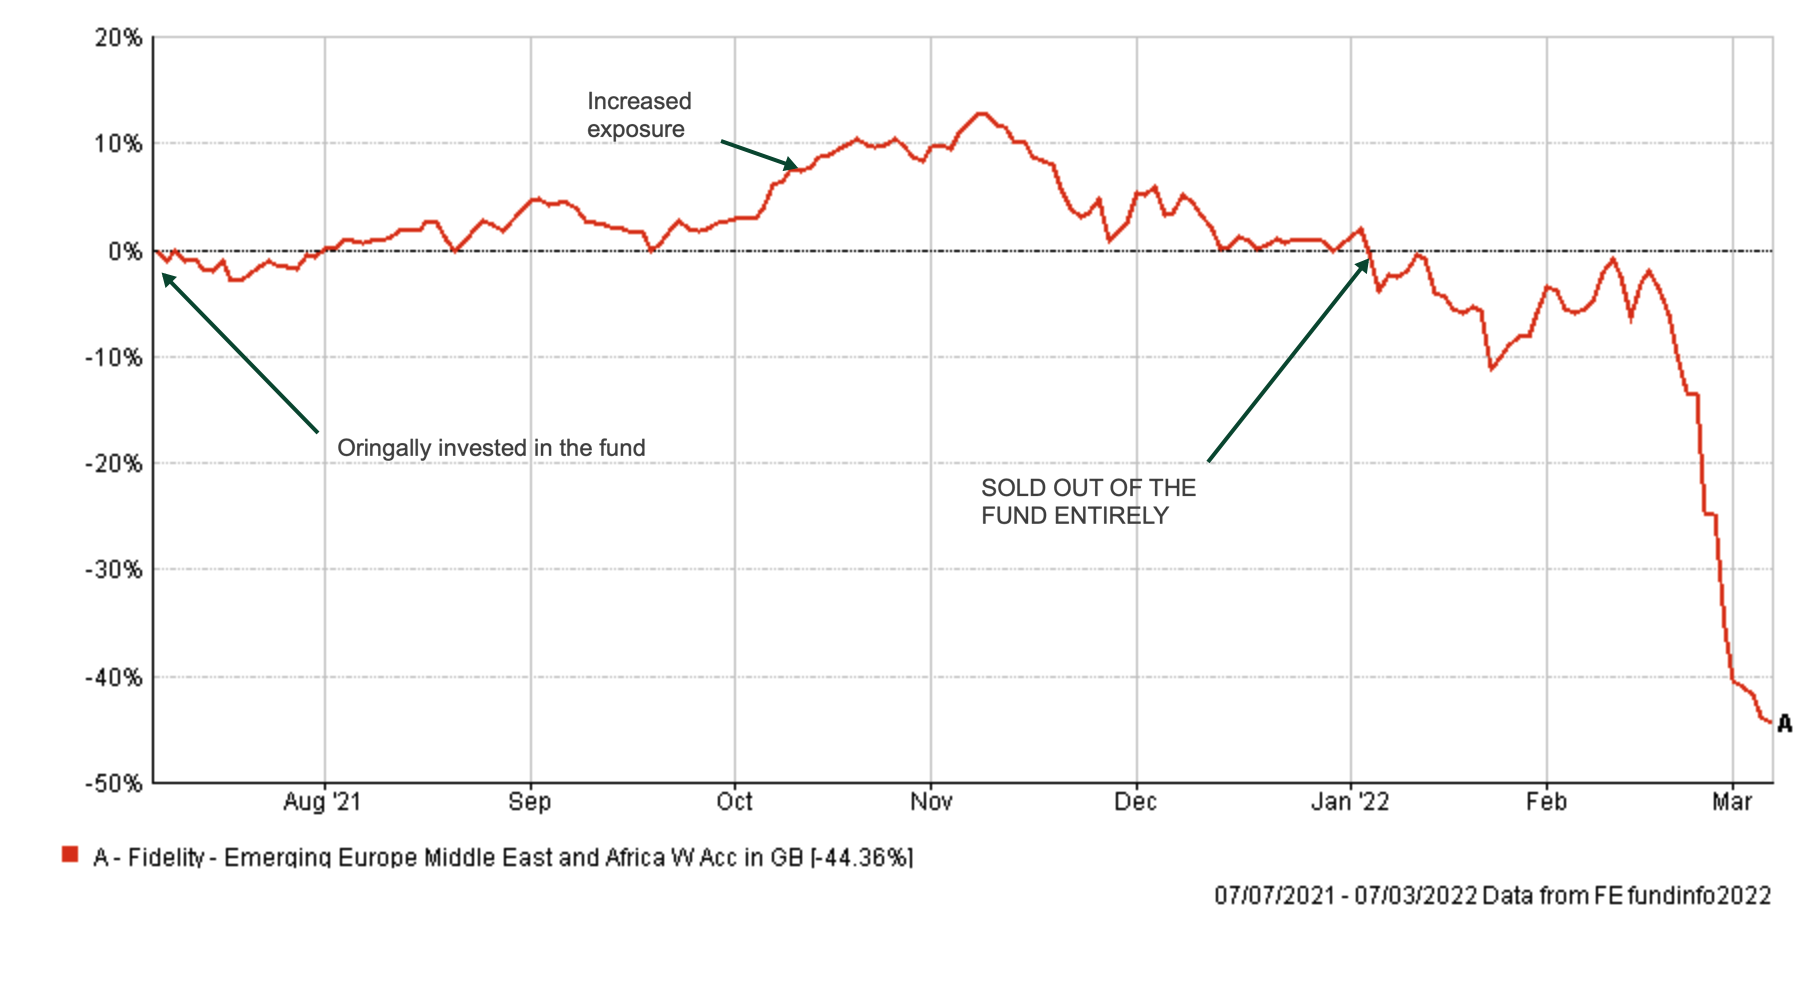
In particular, the removal of Fidelity Emerging Europe Middle East and Africa (EEMEA) from my portfolio, which had a 33.6% exposure to Russian stocks, was timely. The chart below shows when I first bought and eventually phased out of the fund based on a process rather than emotion. It is a good demonstration of when entering and exiting a fund without reference to the price you bought at (i.e meaning that you can end up selling at a loss potentially) can help avoid significant losses just around the corner. The Fidelity Emerging Europe Middle East and Africa fund has fallen over 40% since I sold out of my position.
So obviously I am very pleased with my recent portfolio changes and how the portfolio has held up during the difficult backdrop for equities and bonds.
As usual, the table below shows which funds within my current portfolio are in the current BOTB or BFBS tables and which are not. Those funds in green are still in the BOTB while those in orange are not in the BOTB but remain in the BFBS list. Meanwhile, any funds in red have dropped out of both shortlists.
| Name | Allocation % (rounded) | Risk | Sector | ISIN Code |
| BlackRock Natural Resources Growth & Income | 5.00 | High | Commodity/Natural Resource | GB00B6865B79 |
| Fidelity American Special Situations | 7.50 | Medium | North America | GB00B89ST706 |
| Fidelity Global Property | 5.00 | Medium | Property Other | GB00B7K2NZ09 |
| Fidelity UK Smaller Companies | 6.50 | High | UK Smaller Companies | GB00B7VNMB18 |
| Fidelity US Index | 11.00 | High | North America | GB00BJS8SH10 |
| Invesco High Yield (UK) | 8.00 | Low | Sterling High Yield | GB00B3RW7649 |
| Invesco UK Opportunities (UK) | 7.50 | Medium | UK All Companies | GB00B1W7HM62 |
| iShares Physical Gold ETC | 4.00 | Medium | Commodity & Energy ETF | IE00B4ND3602 |
| Premier Miton Defensive Growth | 12 | Low | Targeted Absolute Return | GB00B832BD89 |
| Schroder European Recovery | 10 | High | Europe Excluding UK | GB0007221889 |
| SVS BM Brooks Macdonald Defensive Capital | 10.00 | Low | Targeted Absolute Return | GB00B61MR835 |
| Thesis TM Tellworth UK Select | 5 | Low | Targeted Absolute Return | GB00BNY7YM73 |
| TB Wise Multi-Asset Growth | 8.50 | Medium | Flexible Investment | GB0034272533 |
As you can see there are a number of funds still in the BOTB and there are five funds that have fallen outside of the BOTB and BFBS and so are highlighted in red above. These are:
- Fidelity Global Property
- Fidelity UK Smaller Companies
- Fidelity US Index
- Invesco High Yield (UK)
- Wise Multi-Asset Growth
Given the performance of the portfolio and the level of volatility in the market (both bonds and equities) at the moment, I don't want to make radical changes to the portfolio. However, Wise Multi-Asset Growth continues to be outside of the BOTB and BFBS tables, and has been for some time now. Its continued lacklustre performance warrants its removal. If you look at the earlier performance table you can see that Wise Multi-Asset Growth, Schroder European Recovery and Fidelity UK Smaller Companies have struggled over the last month.
Schroder European Recovery while still marginally outperforming its predecessor (Marlborough European Special Situations) over the last month is still down hard, a result of the fund's 21% exposure to German equities, but also its exposure to European financial stocks. The latter have been hit by sanctions on Russia. The fund has also triggered a stop loss alert two months in a row, so while it may well rebound, if equity markets more broadly rally, I have decided to remove it from the portfolio.
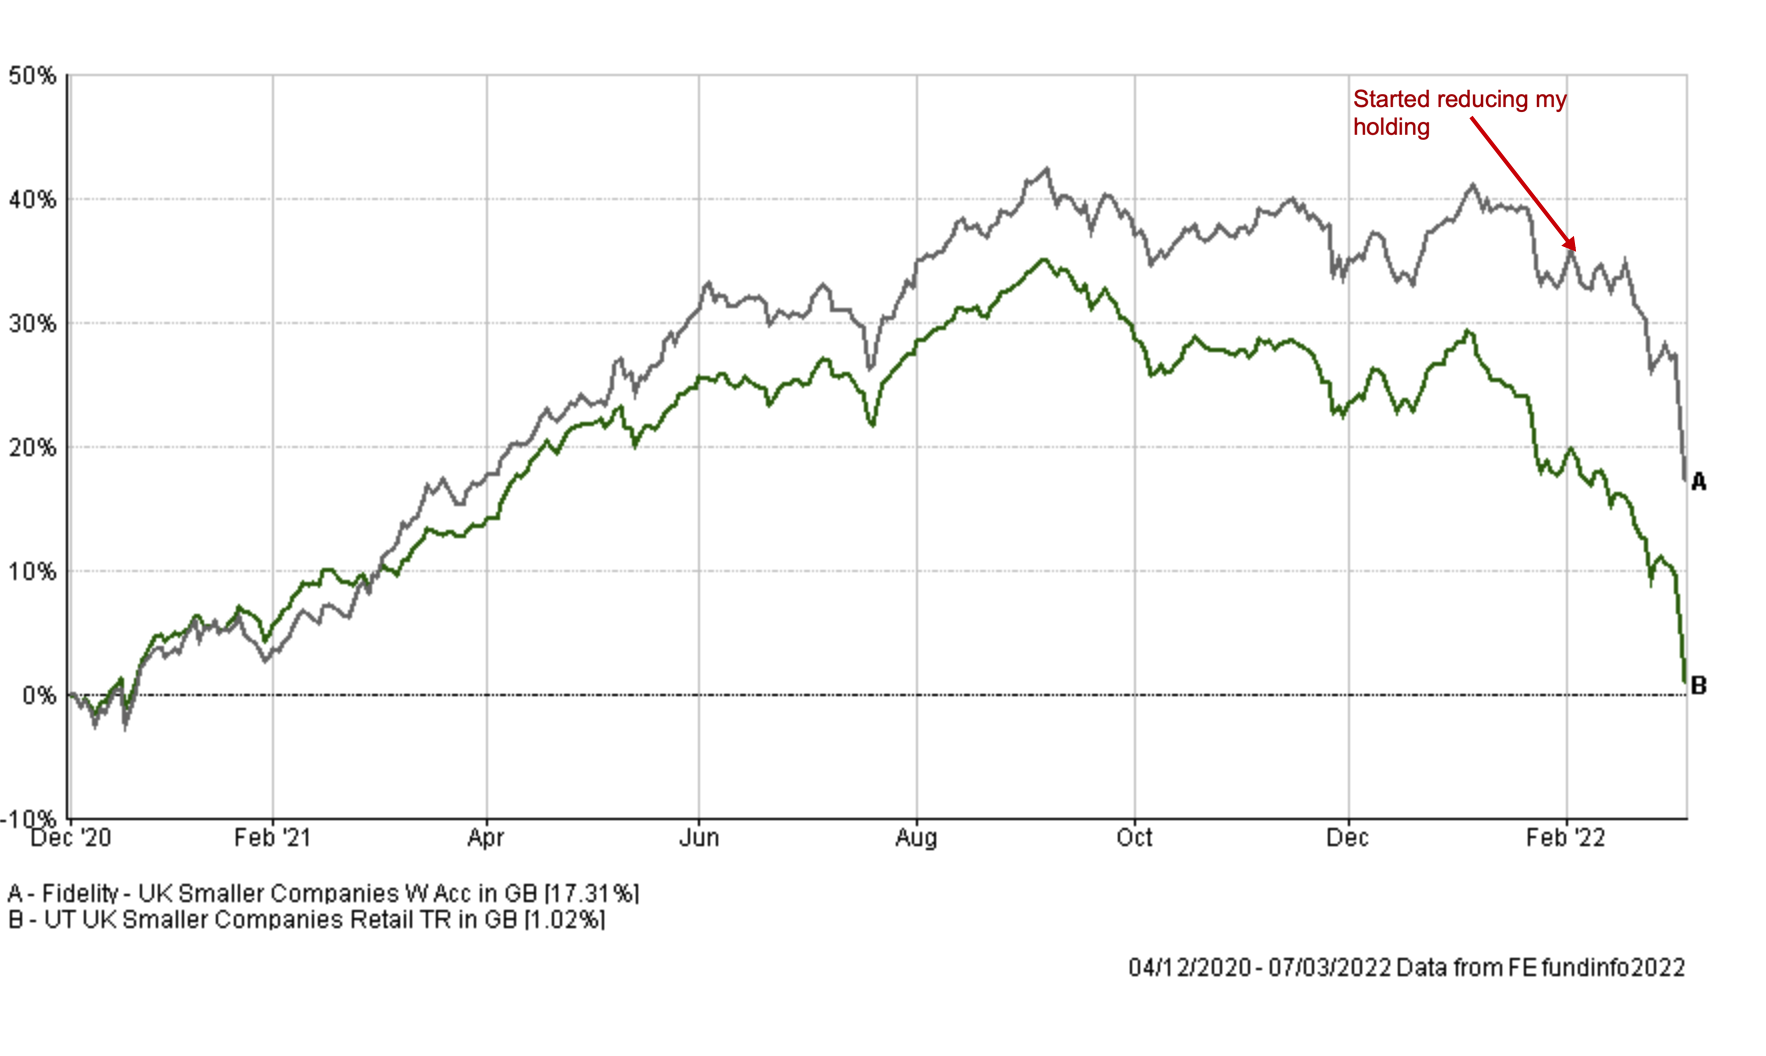
I will also remove Fidelity UK Smaller Companies from my portfolio. I started moving out of the fund last month, as shown in the chart below. But UK Smaller Companies funds have been hit hard recently as the economic outlook darkens somewhat and has been out of the BOTB and BFBS for a while.
It means I am continuing along the path that I started following at the beginning of the year. I will once again reduce my equity exposure, more in line with that of the BOTB. With regard to the other funds that have dropped out of the 80-20 Investor tables - namely Fidelity Global Property, Fidelity US Index and Invesco High Yield (UK) - I will continue to hold them for the time being in order to minimise the number of changes to my portfolio. But I will keep them on my watchlist.
With equity and bond markets struggling you will notice how the BFBS table has started to look more sparse as the number of funds with positive momentum continues to decline. It is for this reason that when I switch out of Fidelity UK Smaller Companies I will hold the proceeds temporarily in cash. This helps reduce my equity exposure, more in line with the BOTB but also preserve capital in this uncertain environment. I could invest the proceeds into one of the better performing funds within my portfolio but I don't want to over-expose my portfolio to any trend right now given the fast-moving environment we are in.
Fund switches
The fund switches below bring my portfolio more in line with the BOTB, and also reduce my equity exposure. I am swapping one multi-asset fund for another, albeit more defensive multi-asset fund with some exposure to gold-related investments. While I am swapping a European fund for a global fund, rather than investing the proceeds from Schroder European Recovery into another European equity fund, of which there are none in the BFBS anyway. `
- 100% out of Schroder European Recovery and 100% into M&G Global Dividend
- 100% out of TB Wise Multi-Asset Growth and 100% into Troy Asset Management Ltd Trojan Ethical
- 100% out of Fidelity UK Smaller Companies and 100% into cash
Overall it means that the equity exposure within my portfolio has fallen from 63% to around 59%, while the number of holdings has reduced by one. The changes affect just under 23% of my portfolio.
My portfolio
My portfolio now looks like this:
| Name | Allocation % (rounded) | Risk | Sector | ISIN Code |
| BlackRock Natural Resources Growth & Income | 6.00 | High | Commodity/Natural Resource | GB00B6865B79 |
| Fidelity American Special Situations | 8.00 | Medium | North America | GB00B89ST706 |
| Fidelity Global Property | 5.50 | Medium | Property Other | GB00B7K2NZ09 |
| Fidelity US Index | 11.00 | High | North America | GB00BJS8SH10 |
| Invesco High Yield (UK) | 8.00 | Low | Sterling High Yield | GB00B3RW7649 |
| Invesco UK Opportunities (UK) | 7.00 | Medium | UK All Companies | GB00B1W7HM62 |
| iShares Physical Gold ETC | 5.00 | Medium | Commodity & Energy ETF | IE00B4ND3602 |
| Premier Miton Defensive Growth | 12 | Low | Targeted Absolute Return | GB00B832BD89 |
| M&G Global Dividend | 8.5 | Medium | Global | GB00B46J9127 |
| SVS BM Brooks Macdonald Defensive Capital | 10.00 | Low | Targeted Absolute Return | GB00B61MR835 |
| Thesis TM Tellworth UK Select | 5 | Low | Targeted Absolute Return | GB00BNY7YM73 |
| Troy Asset Management Ltd Trojan Ethical | 8.00 | Medium | Flexible Investment | GB00BJP0XX17 |
| Cash | 6 | Low |
My Portfolio asset mix
My portfolio asset mix is now around 59% exposure to equities. Last month's figures are shown in brackets
-
- UK Equities 12% (18%)
- North American Equities 14% (18%)
- Asian/Emerging Market Equities 0% (0%)
- Japanese Equities 0% (0%)
- European Equities 0% (9%)
- Chinese equities 0% (0%)
- Other equity 17% (6%)
- Commodities and energy 15% (12%)
- UK Fixed Interest 0% (0%)
- Global Fixed Interest 11% (9%)
- Cash 6% (0%)
- Alternative Investment Strategies 20% (23%)
- Property 5% (5%)
Damien's higher risk and lower risk portfolios
Using the logic described in my post: Update to Damien’s alternative risk portfolios I created hypothetical higher and lower risk versions of my portfolio below:
Lower risk
| Fund | Allocation % |
| Fidelity American Special Situations | 10 |
| Fidelity Global Property | 7 |
| Invesco High Yield (UK) | 10 |
| Invesco UK Opportunities (UK) | 8 |
| iShares Physical Gold ETC | 6 |
| Premier Miton Defensive Growth | 14 |
| M&G Global Dividend | 10 |
| SVS BM Brooks Macdonald Defensive Capital | 12 |
| Thesis TM Tellworth UK Select | 6 |
| Troy Asset Management Ltd Trojan Ethical | 10 |
| Cash | 7 |
Higher risk
| Fund | Allocation % |
| BlackRock Natural Resources Growth & Income | 10 |
| Fidelity American Special Situations | 14 |
| Fidelity Global Property | 9 |
| Fidelity US Index | 19 |
| Invesco UK Opportunities (UK) | 12 |
| iShares Physical Gold ETC | 8 |
| M&G Global Dividend | 14 |
| Troy Asset Management Ltd Trojan Ethical | 14 |

£200 Pension Cashback Offer
Make a qualifying deposit or transfer a pension to our partner Interactive Investor.
- Deposit or transfer a pension of at least £20k and you could earn £200 cashback
- Terms and Fees apply, Capital at risk
- New & Existing customers opening a SIPP
- Offer ends 31st July 2026
Before starting your transfer, check you won't lose any valuable benefits (such as guaranteed annuity rates or a lower protected pension age) and find out what exit fees you might have to pay
