

The background to my portfolio
Back in March 2015 I decided to invest £50,000 of my own money using 80-20 Investor. The purpose was twofold, firstly to show how you can use 80-20 Investor to invest and outperform the market with only a few minutes effort every now and then. Secondly, no other investment commentator, journalist or research provider invests their own money for fear of failing. This is a sorry state of affairs and is precisely why I committed to openly running my own portfolio for 80-20 Investor members to see.
Since then I have periodically changed my portfolio using the fund suggestions provided by the 80-20 Investor algorithm and associated research. I always disclose the changes at the time they are made.
Performance update
As is usual in my portfolio reviews, the chart below shows how my portfolio has outperformed since I started the challenge in March 2015. The green line is the performance of my portfolio while the red line is the benchmark showing the average return achieved by professional fund managers given the same asset mix. To accurately calculate this I have used the average return for each sector in which my portfolio invested. The blue line shows what the average multi-asset fund with comparable equity content achieved. In other words, the red line would show the extra performance added by just the asset mix of my portfolio (where I was invested i.e European equities etc) over picking a typical multi-asset fund (the blue line). While the green line (which is my actual performance) shows the impact of being in the right funds at the right time, as identified by the 80-20 Investor algorithm.
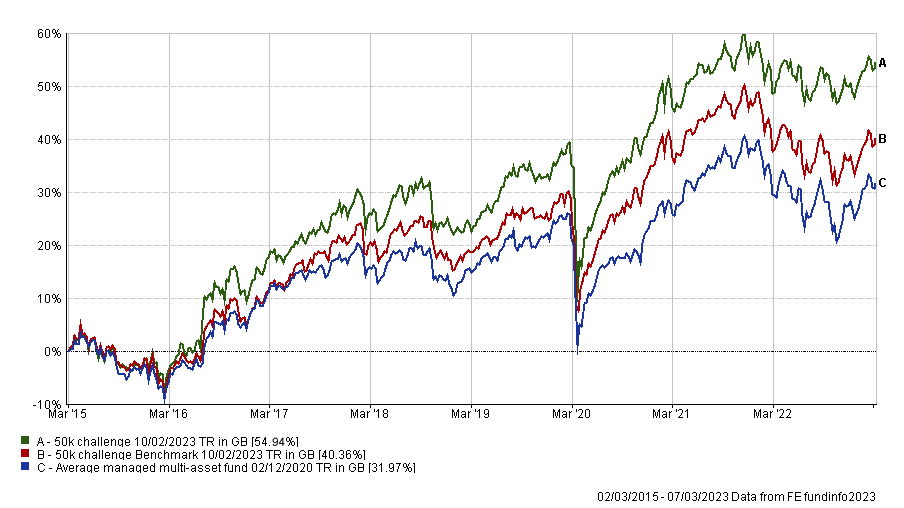
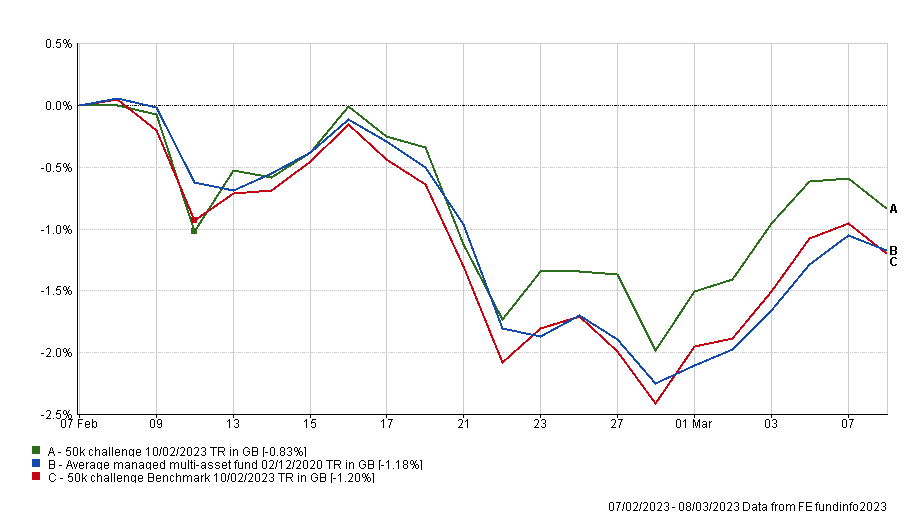
As the chart above shows, my portfolio continues to outperform its benchmarks over the last 8 years and the chart below shows how it has outperformed since my last update in February.
As I explained in February's monthly newsletter, it was a tough month for investors with market moves resembling 2022 when the US dollar rallied and bond and equity markets tumbled in tandem. The catalyst for the change in trend was investor fear that inflation might prove more stubborn than previously thought, following stronger than expected inflation and economic data in the US and Europe. It meant that February was a month where those assets that tend to perform better when the US dollar strengthens ended up outperforming while those that struggle in a strong dollar environment lagged. So over the course of February the FTSE 100 rose 1.35% while the Nikkei 225 in Japan rose 0.43%, as both benefited from weaker domestic currencies versus the US dollar. European equities also performed well, up around 1.5% as measured by the FTSE Eurofirst 300. At the other end of the scale the laggards were emerging markets equities and US equities - in local currency terms. The MSCI Emerging Market Index was down 4.71% while the S&P 500 fell 2.61%. Both asset classes tend to struggle when the dollar rallies. Meanwhile, bond yields also rallied meaning the value of most bond funds took a hit.
So taking a closer look at the funds within my portfolio, the above explains much of what we see in the table below. The table shows the individual performance of each holding in my portfolio since my last review on 7th February. I could have just named the table '"the strong US dollar winners and losers list". Interestingly Jupiter Merlin Balanced Portfolio, a fund that was on my watchlist following a dip in performance, had a strong month. Meanwhile global bonds, US equities and Asia/emerging markets and gold propped up the table.
|
Fund |
Performance since last review on 7th February |
| Jupiter Merlin Balanced Portfolio | 0.7 |
| Jupiter Global Value Equity | 0.51 |
| TB Saracen Global Income & Growth | 0 |
| Cash | 0 |
| Thesis TM Tellworth UK Select | -0.16 |
| abrdn High Yield Bond | -0.55 |
| TB Evenlode Income | -0.98 |
| BlackRock Natural Resources Growth & Income | -1.03 |
| BNY Mellon Global Income | -1.12 |
| M&G Global Dividend | -1.5 |
| iShares Physical Gold ETC | -1.5 |
| Invesco Global Bond (UK | -1.87 |
| Fidelity American Special Situations | -2.66 |
| FSSA Asia Focus | -3.26 |
As usual, the table below shows which funds within my portfolio are in the current BOTB or BFBS tables and which are not. Those funds in blue are still in the BOTB while those in orange are not in the BOTB but remain in the BFBS list. Meanwhile, any funds in red have dropped out of both shortlists.
| Fund | Allocation | Risk | Sector | ISIN |
| abrdn High Yield Bond | 9 | Low | Sterling High Yield | GB00B79RR984 |
| BlackRock Natural Resources Growth & Income | 4.5 | High | Commodity/Natural Resource | GB00B6865B79 |
| BNY Mellon Global Income | 6.5 | Medium | Global Equity Income | GB00B7XK5M25 |
| Cash | 7 | Low | ||
| Fidelity American Special Situations | 8.5 | Medium | North America | GB00B89ST706 |
| FSSA Asia Focus | 5.5 | High | Asia Pacific Excluding Japan | GB00BWNGXJ86 |
| Invesco Global Bond (UK) | 9 | Low | Global Bonds | GB00B3RW7B97 |
| iShares Physical Gold ETC | 5 | Medium | Commodity & Energy ETF | IE00B4ND3602 |
| Jupiter Global Value Equity | 10 | Medium | Global | GB00BF5DRF26 |
| Jupiter Merlin Balanced Portfolio | 12 | Medium | Mixed Investment 40-85% Shares | GB0031845141 |
| M&G Global Dividend | 7 | Medium | Global Equity Income | GB00B46J9127 |
| TB Evenlode Income | 5 | Medium | UK All Companies | GB00BD0B7D55 |
| TB Saracen Global Income & Growth | 5.5 | Medium | Global Equity Income | GB00B5B35X02 |
| Thesis TM Tellworth UK Select | 5.5 | Low | Targeted Absolute Return | GB00BNY7YM73 |
You can see that only two funds are not in either the BOTB or the BFBS tables and are therefore highlighted in red. Those funds are:
- Fidelity American Special Situations
- TB Evenlode Income
Fidelity American Special Situations has dipped in and out of the BFBS tables recently and its performance has been lacklustre. The chart below shows the performance of the fund over the last six months which highlights how it had performed broadly in line with its peer group average, before beginning to lag from December onwards.
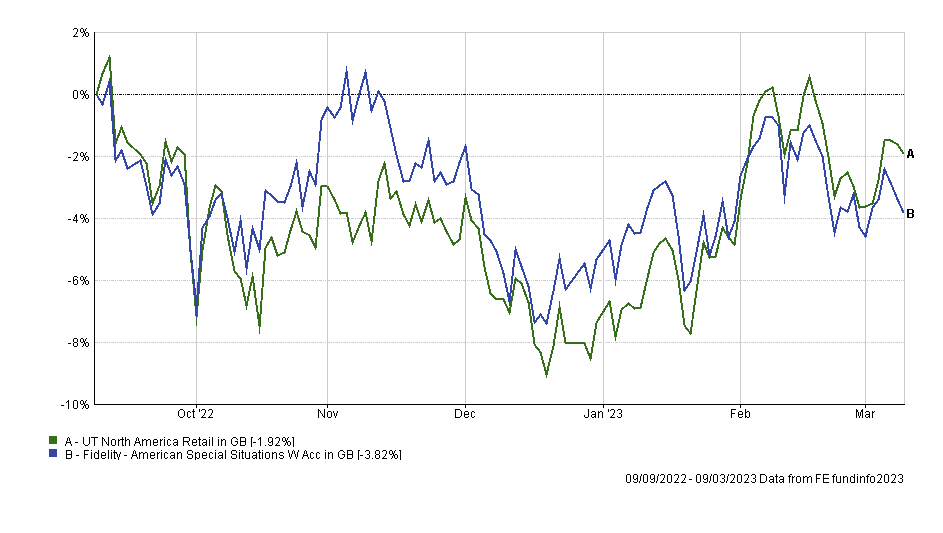
So I think now is a time for a change given that the fund had a stay of execution as recently as the start of 2023. Not only that but the BOTB asset mix has again reduced its US equity exposure as well as removed any US equity funds. So I will look to follow suit by switching out the fund. I plan to split the proceeds equally between TB Saracen Global Income & Growth, which I already hold, and LF Brook Continental European which is a European equity fund from the current BOTB. In doing so, I am increasing my exposure to one of the best performing funds in my portfolio at present (so backing a winner) while introducing some direct European equity fund exposure, in line with the BOTB. The switch will reduce my US equity exposure and increase my European equity exposure following a period where the latter has outperformed the former.
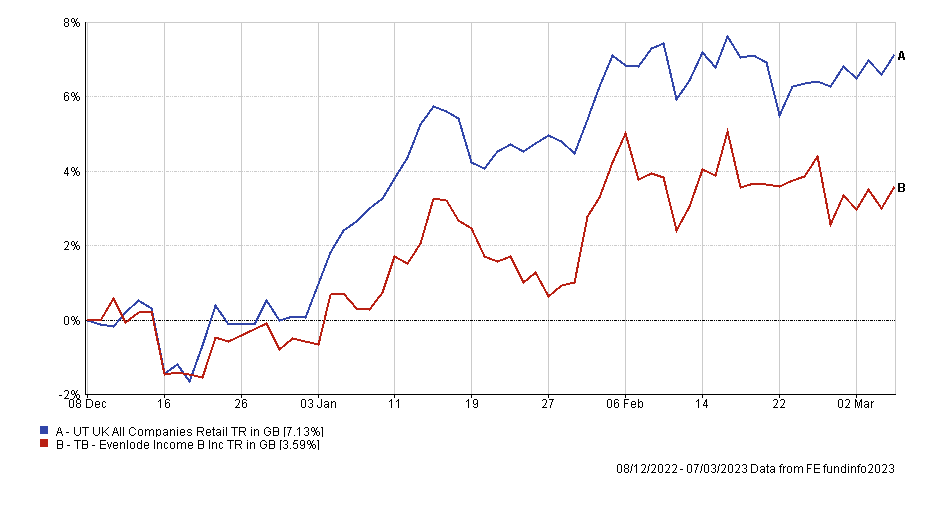
Elsewhere,TB Evenlode Income was already on my watchlist from last month. At the time I decided to maintain the fund in my portfolio partly because it was a fairly recent addition so there had not been sufficient time for me to make a fair judgement. Now after having held the fund for three months the fund's returns have continued to disappoint. The chart below shows the performance of the fund since I first invested in it back in December. While it is good that the fund made a positive return, it has lagged the average of its peer group and better opportunities from a momentum perspective lie elsewhere. I therefore plan to replace it with another UK equity fund (this time an income fund) in order to maintain my portfolio's exposure to this asset class. I will invest the proceeds into the Jupiter Income Trust.
The other funds within my portfolio remain in the BOTB and/or BFBS lists so I am happy to maintain my exposure to them. Interestingly that includes Jupiter Merlin Balanced Portfolio which was on my watchlist after last month's portfolio review. However, since my last review Jupiter Merlin Balanced Portfolio has been the top performing fund out of the 255 funds within the Mixed Investment 40-85% Shares sector, which is no mean feat. It is also currently the largest holding within my portfolio. It has made its way back onto the BFBS list and so will remain in my portfolio. It is a good example of how allowing a portfolio to evolve and not necessarily making a knee-jerk decision, as soon as a fund slips out of the 80-20 Investor tables, can pay off.
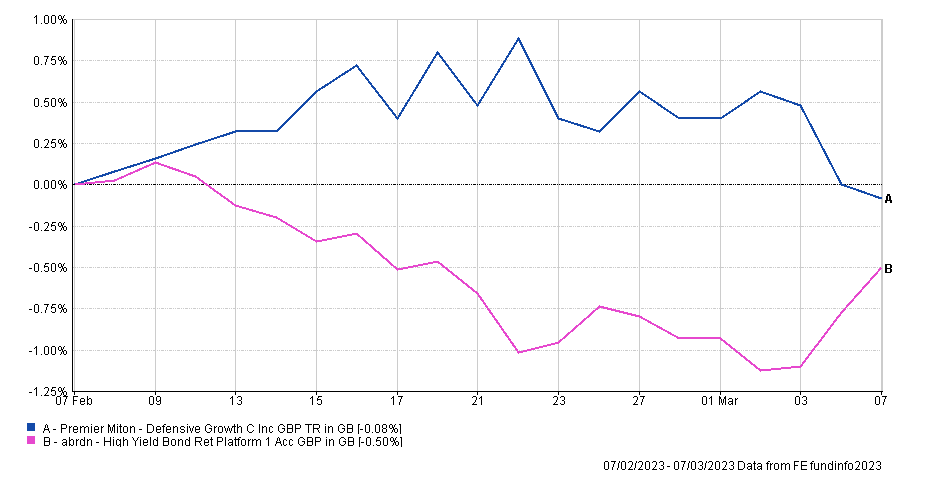
Interestingly last time I replaced Premier Miton Defensive Growth with abrdn High Yield Bond and the chart below shows that, as result of the subsequent weakness in bond markets during February, the abrdn fund significantly underperformed the Premier Miton fund it replaced, at least initially. However, the divergence in performance has narrowed significantly in the last few days. So it is still too early to say if the switch will ultimately prove the right move or not. However, I just wanted to use this example to highlight that you can't get every decision right. That is part of investing.
In summary, the planned transactions impact the medium risk equity portion of my portfolio. At present the portfolio is performing well and there is no urgency or need to change things wholesale, a spring clean will hopefully suffice. In my last review I wrote that I would review my Chinese and Japanese equity exposure. Interestingly market movements have meant that the BOTB no longer has any fund with focussed Chinese or Asian equity exposure. Meanwhile the BOTB's Japanese exposure has dropped ever so slightly. In light of this I have no intention to increase or introduce exposure to these assets this month.
Fund switch
- 100% out of Fidelity American Special Situations and 50% into TB Saracen Global Income & Growth and 50% into LF Brook Continental European
- 100% out of TB Evenlode Income and 100% in Jupiter Income Trust
The fund changes this month are moderate and only impact approximately 14% of my portfolio.
My portfolio
My portfolio now looks like this:
| Fund | Allocation | Risk | Sector | ISIN |
| abrdn High Yield Bond | 9 | Low | Sterling High Yield | GB00B79RR984 |
| BlackRock Natural Resources Growth & Income | 4.5 | High | Commodity/Natural Resource | GB00B6865B79 |
| BNY Mellon Global Income | 6.5 | Medium | Global Equity Income | GB00B7XK5M25 |
| Cash | 7 | Low | ||
| FSSA Asia Focus | 5 | High | Asia Pacific Excluding Japan | GB00BWNGXJ86 |
| Invesco Global Bond (UK) | 9 | Low | Global Bonds | GB00B3RW7B97 |
| iShares Physical Gold ETC | 5 | Medium | Commodity & Energy ETF | IE00B4ND3602 |
| Jupiter Global Value Equity | 10.5 | Medium | Global | GB00BF5DRF26 |
| Jupiter Income Trust | 5 | Medium | UK Equity Income | GB0004791389 |
| Jupiter Merlin Balanced Portfolio | 12.5 | Medium | Mixed Investment 40-85% Shares | GB0031845141 |
| LF Brook Continental European | 4 | High | Europe Excluding UK | GB0031831570 |
| M&G Global Dividend | 7 | Medium | Global Equity Income | GB00B46J9127 |
| TB Saracen Global Income & Growth | 9.5 | Medium | Global Equity Income | GB00B5B35X02 |
| Thesis TM Tellworth UK Select | 5.5 | Low | Targeted Absolute Return | GB00BNY7YM73 |
My Portfolio asset mix
My portfolio asset mix has around 61% exposure to equities. Last month's figures are shown in brackets.
-
- UK Equities 18% (17%)
- North American Equities 11% (14%)
- Asian/Emerging Market Equities 5% (7%)
- Japanese Equities 0% (0%)
- European Equities 13% (9%)
- Chinese equities 0% (0%)
- Other equity 13% (11%)
- Commodities and energy 8% (8%)
- UK Fixed Interest 0% (0%)
- Global Fixed Interest 17% (17%)
- Cash 7% (7%)
- Alternative Investment Strategies 8% (10%)
- Property 0% (0%)
Damien's higher risk and lower risk portfolios
Using the logic described in my post: Update to Damien’s alternative risk portfolios I created hypothetical higher and lower risk versions of my portfolio below:
Lower risk
| Fund | Allocation % |
| BNY Mellon Global Income | 8 |
| Cash | 9 |
| iShares Physical Gold ETC | 6 |
| Invesco Global Bond (UK) | 10 |
| TB Saracen Global Income & Growth | 11 |
| Jupiter Global Value Equity | 12 |
| M&G Global Dividend | 8 |
| Jupiter Merlin Balanced Portfolio | 14 |
| abrdn High Yield Bond | 10 |
| Jupiter Income Trust | 6 |
| Thesis TM Tellworth UK Select | 6 |
Higher risk
| Fund | Allocation % |
| BlackRock Natural Resources Growth & Income | 7 |
| BNY Mellon Global Income | 10 |
| LF Brook Continental European | 6 |
| FSSA Asia Focus | 7 |
| iShares Physical Gold ETC | 7 |
| TB Saracen Global Income & Growth | 14 |
| Jupiter Global Value Equity | 15 |
| M&G Global Dividend | 10 |
| Jupiter Merlin Balanced Portfolio | 17 |
| Jupiter Income Trust | 7 |

£200 Pension Cashback Offer
Make a qualifying deposit or transfer a pension to our partner Interactive Investor.
- Deposit or transfer a pension of at least £20k and you could earn £200 cashback
- Terms and Fees apply, Capital at risk
- New & Existing customers opening a SIPP
- Offer ends 31st July 2026
Before starting your transfer, check you won't lose any valuable benefits (such as guaranteed annuity rates or a lower protected pension age) and find out what exit fees you might have to pay
