

The background to my portfolio
Back in March 2015 I decided to invest £50,000 of my own money using 80-20 Investor. The purpose was twofold, firstly to show how you can use 80-20 Investor to invest and outperform the market with only a few minutes effort every now and then. Secondly, no other investment commentator, journalist or research provider invests their own money for fear of failing. This is a sorry state of affairs and is precisely why I committed to openly running my own portfolio for 80-20 Investor members to see.
Since then I have periodically changed my portfolio using the fund suggestions provided by the 80-20 Investor algorithm and associated research. I always disclose the changes at the time they are made.
Performance update
As is usual in my portfolio reviews, the chart below shows how my portfolio has outperformed since I started the challenge in March 2015. The green line is the performance of my portfolio while the red line is the benchmark showing the average return achieved by professional fund managers given the same asset mix. To accurately calculate this I have used the average return for each sector in which my portfolio invested. The blue line shows what the average multi-asset fund with comparable equity content achieved. In other words, the red line would show the extra performance added by just the asset mix of my portfolio (where I was invested i.e European equities etc) over picking a typical multi-asset fund (the blue line). While the green line (which is my actual performance) shows the impact of being in the right funds at the right time, as identified by the 80-20 Investor algorithm.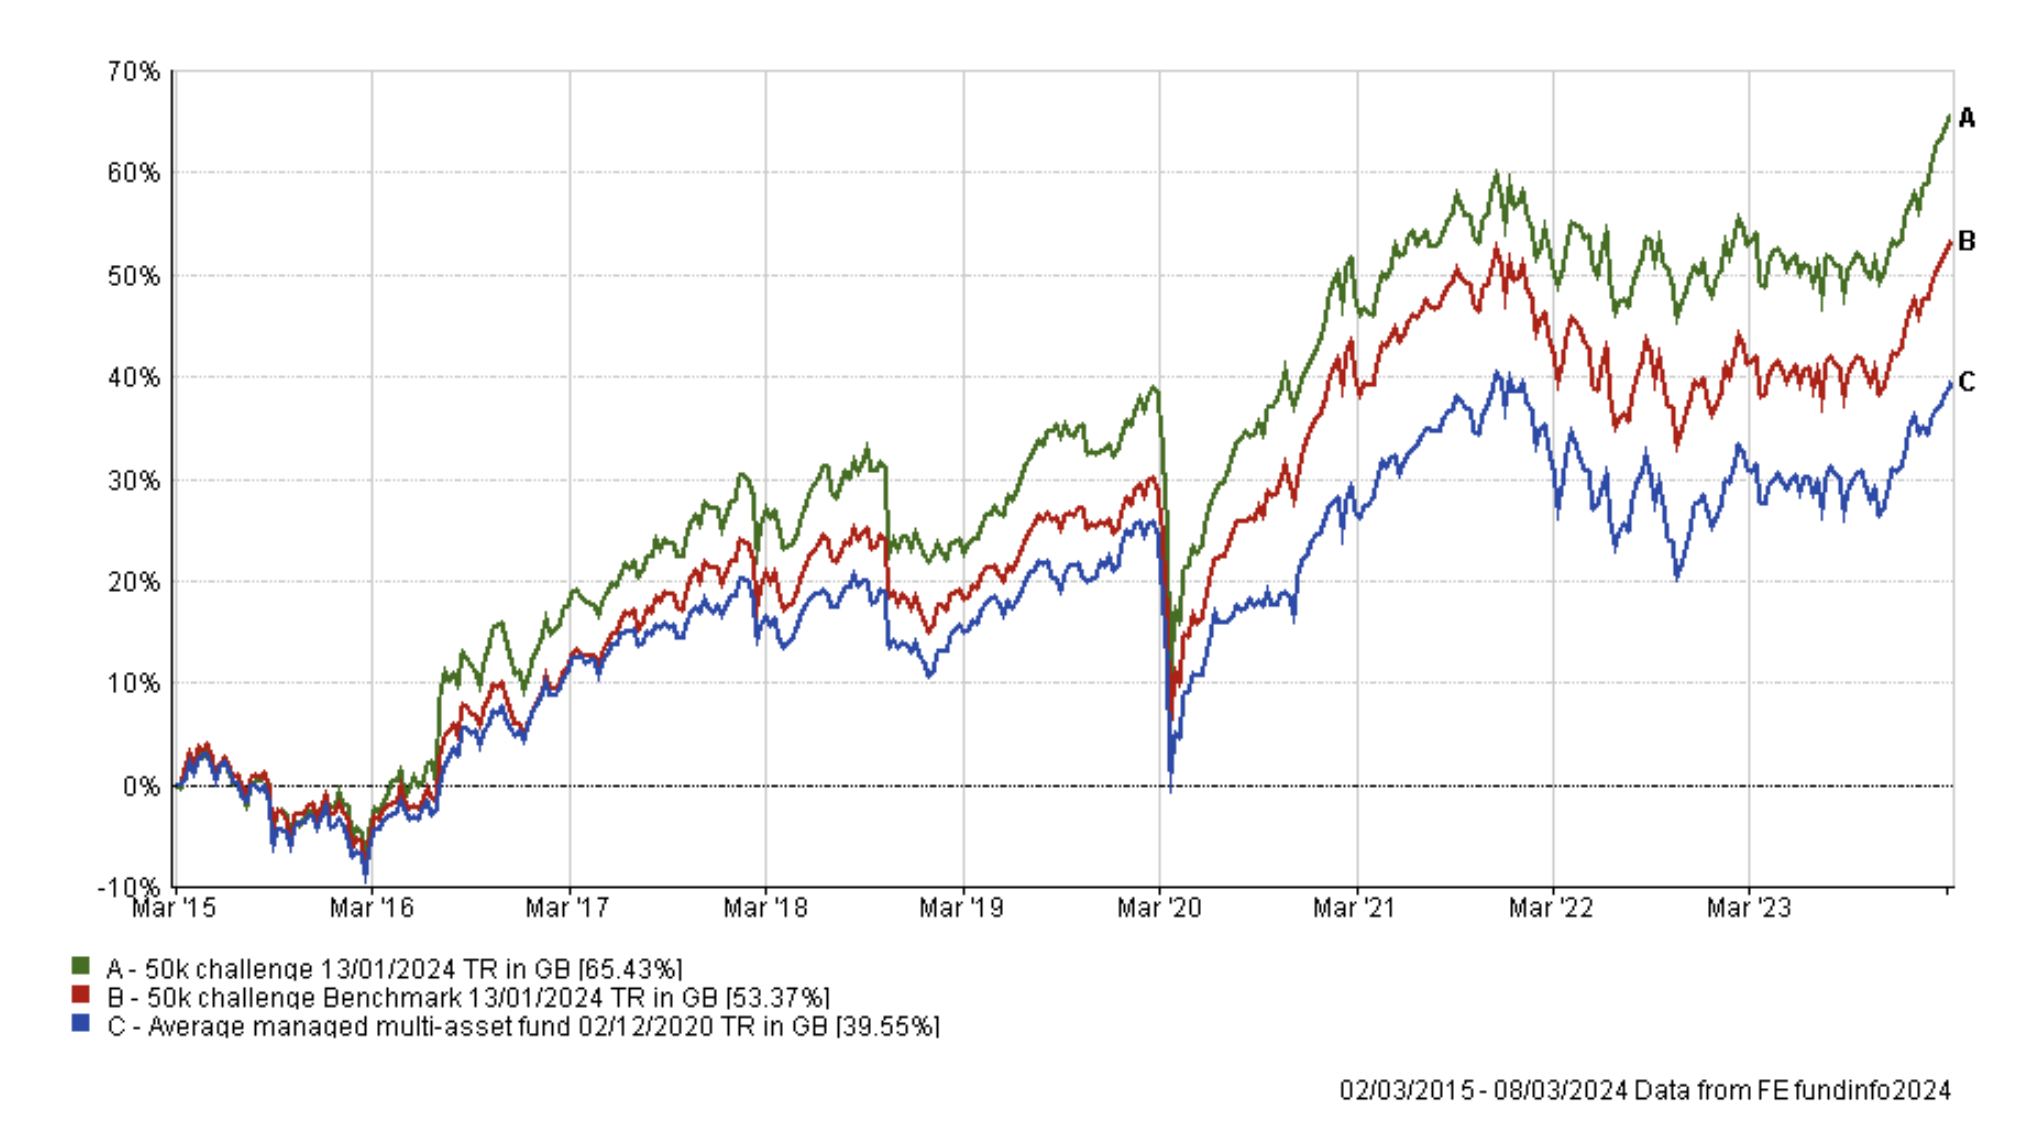
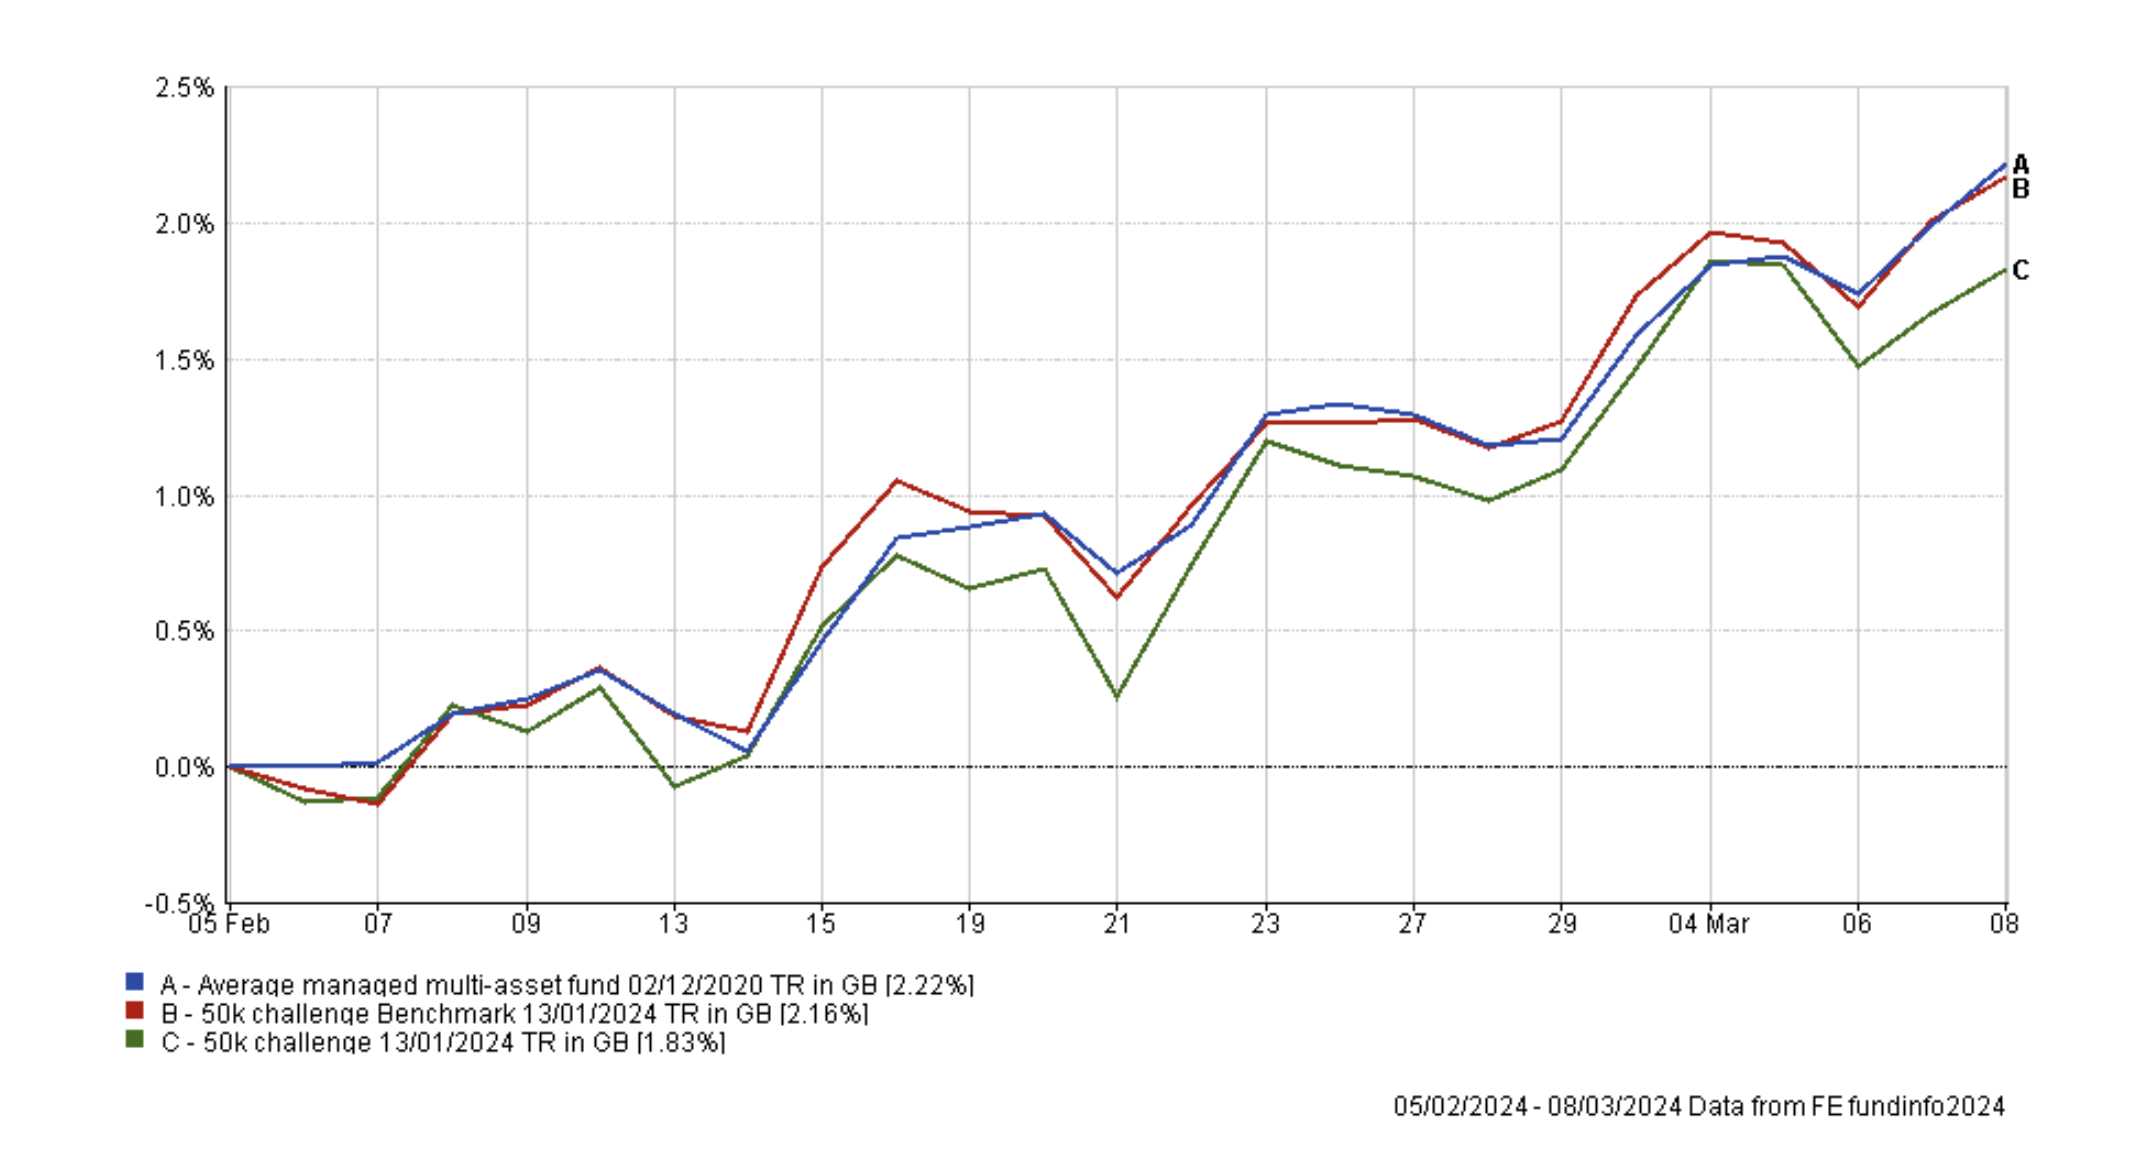
The chart below shows the performance of my portfolio since my last review a month ago and you can see that while my portfolio underperformed its benchmarks it had another strong month.
It means that my portfolio now sits at yet another new all-time high, as shown in the first chart. My £50,000 portfolio is now worth over £82,735 which equates to a profit of 65.43% in 9 years, which is a great result. But it's not just the profit that is important, so is the management of risk over that time to achieve that profit as I explained in detail last month. I have achieved this by managing risk and squeezing more return from the risk that I have taken than most professional fund managers.
So how have the holdings within my portfolio performed since my last review? The table below shows the performance of the individual funds within my portfolio since my last review just under a month ago.
As you can see there has been a huge turnaround for WS Saracen Global Income and Growth which was propping up the performance chart last time. By contrast Troy Asset Management Ltd Trojan Global Equity has gone from near the top of my monthly performance chart to the bottom this time around. Meanwhile the consistently strong performers across the last two months have been Fidelity Index Japan, Liontrust India and Fidelity American. The consistent underperformer has been Fidelity UK Smaller Companies.
| Name | % return over the last month (since February's review) |
| Fidelity Index Japan | 5.22 |
| iShares Physical Gold | 4.57 |
| WS Saracen Global Income and Growth | 3.54 |
| Fidelity American | 2.6 |
| Liontrust India | 2.46 |
| BNY Mellon Multi-Asset Balanced | 2.21 |
| L&G Global 100 Index Trust | 1.91 |
| T. Rowe Price US Large Cap Growth Equity | 1.69 |
| Thesis TM Tellworth UK Select | 1.64 |
| abrdn High Yield Bond | 1.01 |
| Schroder Strategic Credit | 1 |
| Fidelity UK Smaller Companies | 0.4 |
| Troy Asset Management Ltd Trojan Global Equity | -1.09 |
As usual the table below shows which funds within my portfolio are in the current BOTB or BFBS tables and which are not. Those funds in blue are still in the BOTB while those in orange are not in the BOTB but remain in the BFBS list. Meanwhile, any funds in red have dropped out of both shortlists.
| Fund | Allocation (%) | Risk | Sector | ISIN |
| abrdn High Yield Bond | 14.5 | Lower | Sterling High Yield |
GB00B79RR984
|
| BNY Mellon Multi-Asset Balanced | 8.5 | Medium | Mixed Investment 40-85% Shares | GB00B8K9JZ06 |
| Fidelity American | 5 | Medium | North America |
GB00B8GPC429
|
| Fidelity Index Japan | 5.5 | Medium | Japan |
GB00BHZK8872
|
| Fidelity UK Smaller Companies | 5 | Higher | UK Smaller Companies |
GB00B7VNMB18
|
| iShares Physical Gold ETC | 5 | Medium | Commodity & Energy ETF | IE00B4ND3602 |
| T. Rowe Price US Large Cap Growth Equity | 10.5 | Higher | North America |
GB00BD5FHW12
|
| L&G Global 100 Index Trust | 5 | Medium | Global |
GB00B0CNH056
|
| Liontrust India | 5.5 | Higher | India/Indian Subcontinent |
GB00B1L6DV51
|
| Schroder Strategic Credit | 8.5 | Lower | Sterling Strategic Bond | GB00BJZ2ZC09 |
| Thesis TM Tellworth UK Select | 6 | Lower | Targeted Absolute Return |
GB00BNY7YM73
|
| Troy Asset Management Ltd Trojan Global Equity | 11 | Medium | Global | GB00B0ZJ5S47 |
| WS Saracen Global Income & Growth | 10 | Medium | Global Equity Income | GB00B5B35X02 |
The table looks similar to last month with the only differences being that Schroder Strategic Credit is now in the BOTB having been in the BFBS table last time around. Meanwhile Troy Asset Management Ltd Trojan Global Equity has fallen out of the BOTB and BFBS altogether. In fact, I think it is the first time ever that my portfolio has only had 'blue' and 'red' funds at a review point and no 'orange' BFBS funds.
It means this month there are now six funds that have fallen outside out the BOTB and BFBS tables and are coloured in red. They are:
- BNY Mellon Multi-Asset Balanced
- Fidelity American
- L&G Global 100 Index Trust
- WS Saracen Global Income & Growth
- Fidelity UK Smaller Companies
- Troy Asset Management Ltd Trojan Global Equity
All of the funds except Troy Asset Management Ltd Trojan Global Equity were on the 'red' list last month as well. Interestingly, in the last few weeks we've seen some weakness in US technology stocks which has hampered funds such as L&G Global 100 Index Trust as well as T. Rowe Price US Large Cap Growth Equity, both of which have significant exposure to US tech stocks and the Magnificent 7 in particular. But as mentioned in my recent newsletter other sectors have started to outperform the Magnificent 7 over the last month. There are plenty of investment opportunities and bull markets beyond the Magnificent 7.
Of the six funds listed Fidelity UK Smaller Companies has been the biggest disappointment since I've held it in my portfolio. The chart below shows the performance of the fund since it first entered my portfolio in January. While it is a relatively short holding period you can see the underperformance versus its sector average has been significant although it has managed to recoup the losses it incurred during February.
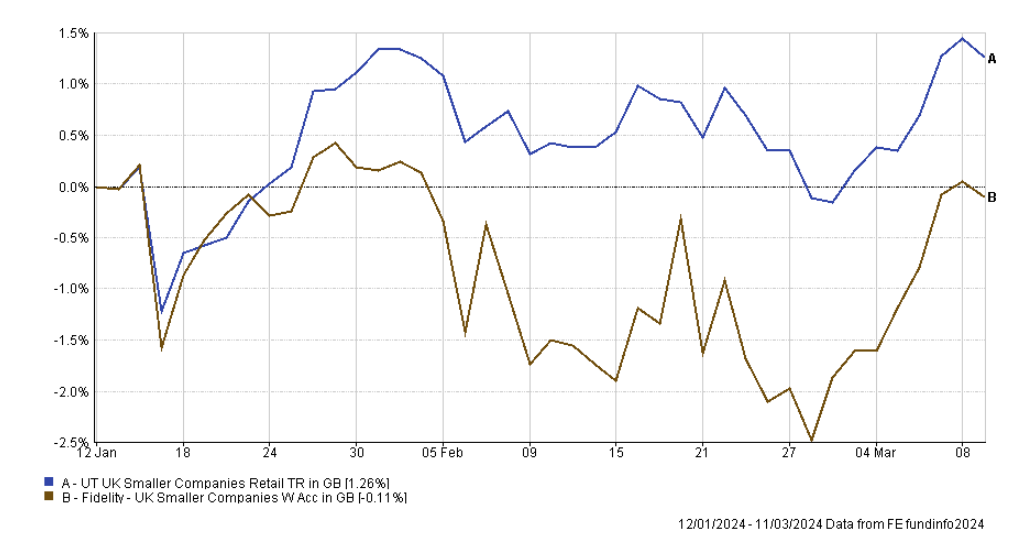
Given the fund's disappointing performance and the fact that we are soon exiting the favourable "winter" period for UK Smaller Companies funds I think it is an opportune moment to invest the money elsewhere. In order to maintain my portfolio's UK equity exposure, so it remains in keeping with that of the BOTB selection, I will invest the proceeds into the Ninety One UK Special Situations fund. This fund is in the current BOTB and by comparison has rallied 8.56% over the same period that I've held the Fidelity fund.
Moving on to Fidelity American, I plan to give the fund a stay of execution. As mentioned earlier the fund has been among the most consistent performers over the last couple of months. That is partly a result of its slight underweight in some of the Magnificent 7 versus its peer group, most notably Nvidia where it doesn't have any exposure at all.
If you look at its performance year to date versus T. Rowe Price US Large Cap Growth Equity, which is the other North American equity fund in my portfolio, you can see the impact of this underweight.
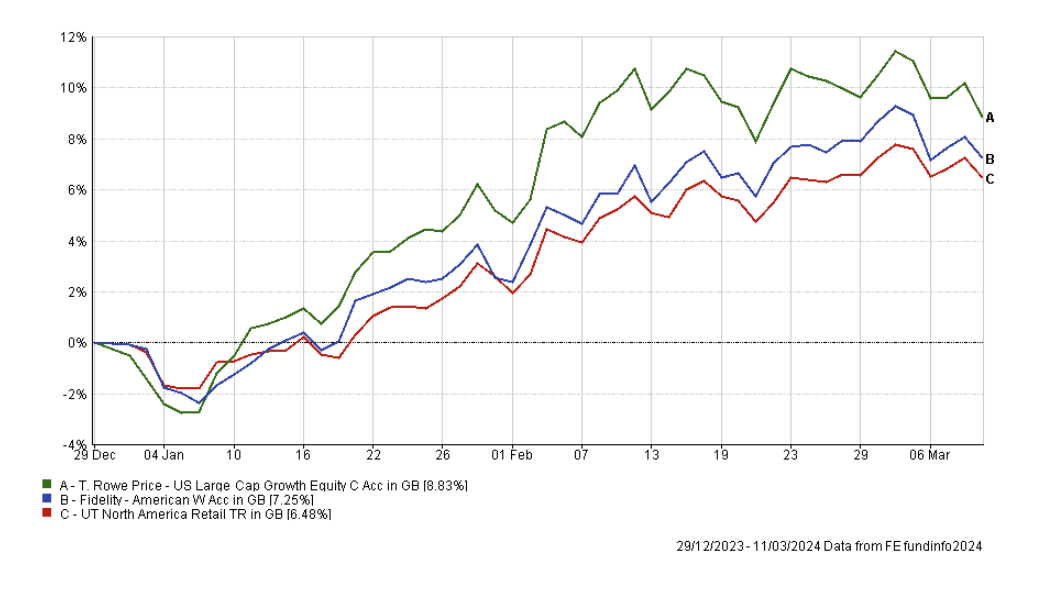
The alternative North American funds with momentum right now all have significant exposure to the Magnificent 7 and for now I don't want to increase my exposure further. Given that Fidelity American continues to outperform its peer group average (the red line above) I plan to keep it in my portfolio for now.
L&G Global 100 Index Trust has fallen out of the BOTB and BFBS tables. It has performed adequately since I've held the fund as shown in the chart below. After initially lagging its sector average it eventually gained ground and overtook its peers. But ultimately it has performed more or less in line with the typical global equity fund.
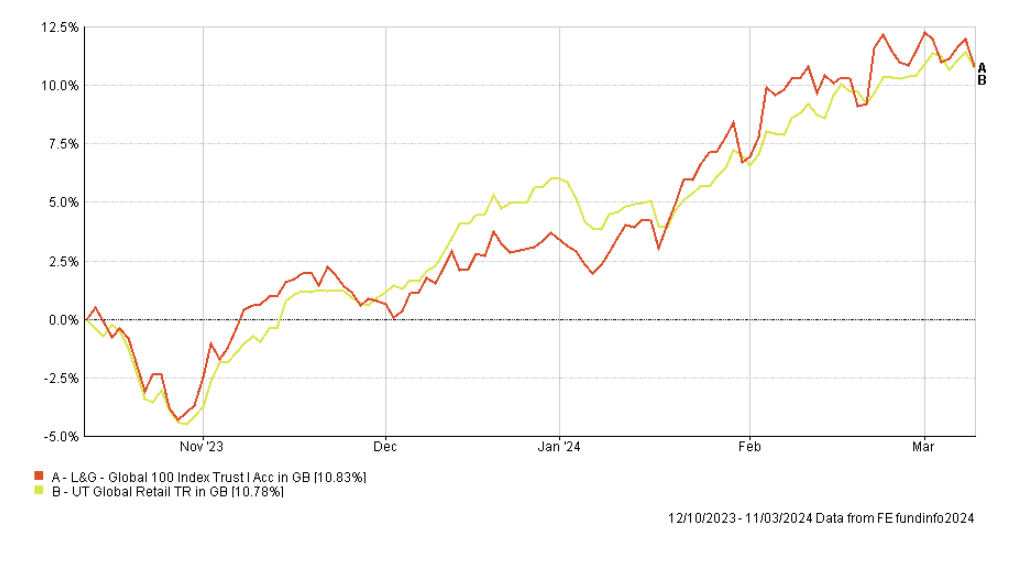
I think it is now time for a change and also an opportunity to more accurately reflect the recent uplift in European equity exposure in the BOTB, but also to reduce my portfolio's exposure to US technology stocks, which are the dominant holdings within the L&G fund. Therefore I plan to sell out of the L&G fund and invest the proceeds into Artemis European Select fund, which is a member of the current BOTB and has significantly outperformed the L&G Global 100 Index Trust so far this year. Don't forget it's not just been US stock market indices that have been setting new all-time highs, European equities have been too.
The remaining funds that have fallen outside of the BOTB and BFBS tables are BNY Mellon Multi-Asset Balanced, WS Saracen Global Income & Growth and Troy Asset Management Ltd Trojan Global Equity. The overall performance of my portfolio suggests that wholesale changes aren't necessary, especially given that the first two funds mentioned are among my portfolio's top performers since my last review. I will keep them under review for next time. It's worth pointing out that BNY Mellon Multi-Asset Balanced is among the top quartile of performing funds within the Mixed Investment 40-85% Shares sector since the turn of the year. So there's no need to panic.
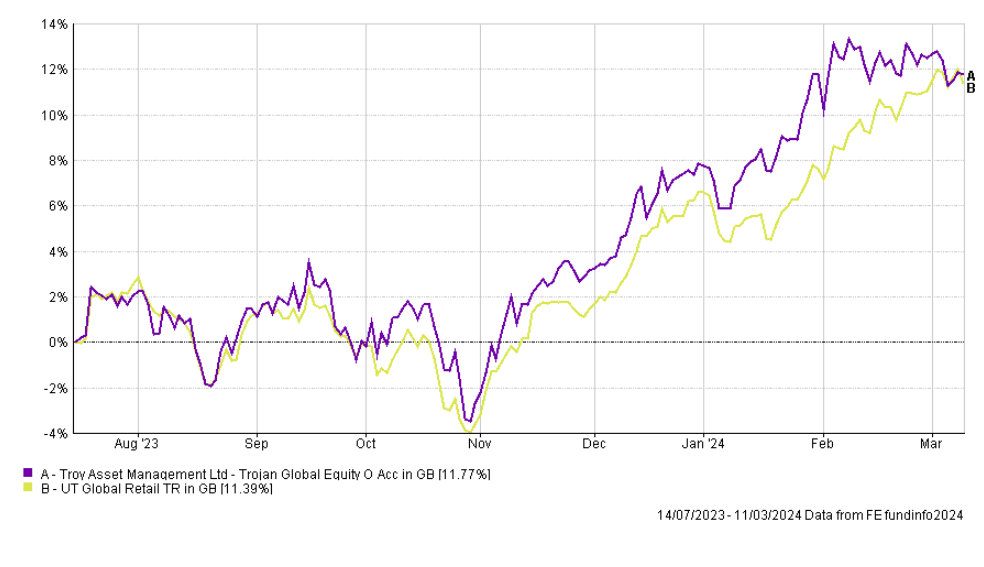
Meanwhile, Troy Asset Management Ltd Trojan Global Equity struggled last month but it was in the BOTB as recently as February. The chart below shows the performance of the fund since I first held it in July 2023, and it was flying high versus its peers until the dip in recent weeks. Either way I will hold the fund for now and review it once again next month.
The other funds in my portfolio remain in the BOTB and are performing well so will stay in my portfolio.
Fund switches
The fund switches I plan to make this month are listed below, and affect 10% of my portfolio. The changes will bring my portfolio's asset mix more in line with that of the BOTB although there are differences, most notably a slightly lower overall equity exposure thanks to a marginally lower emerging market and US equity exposure.
100% out of Fidelity UK Smaller Companies and 100% into Ninety One UK Special Situations
100% out of L&G Global 100 Index Trust and 100% into Artemis European Select
My portfolio
My portfolio now looks like this:
| Fund | Allocation | Risk | Sector | ISIN |
| abrdn High Yield Bond | 14.5 | Lower | Sterling High Yield | GB00B79RR984 |
| Artemis European Select | 5 | Medium | Europe Excluding UK | GB00B6WFCR53 |
| BNY Mellon Multi-Asset Balanced | 8 | Medium | Mixed Investment 40-85% Shares | GB00B8K9JZ06 |
| Fidelity American | 5 | Medium | North America | GB00B8GPC429 |
| Fidelity Index Japan | 6 | Medium | Japan | GB00BHZK8872 |
| iShares Physical Gold ETC | 5 | Medium | Commodity & Energy ETF | IE00B4ND3602 |
| Liontrust India | 6 | Higher | India/Indian Subcontinent | GB00B1L6DV51 |
| Ninety One UK Special Situations | 5 | Higher | UK All Companies | GB00B1XFJS91 |
| Schroder Strategic Credit | 8 | Lower | Sterling Strategic Bond | GB00BJZ2ZC09 |
| T. Rowe Price US Large Cap Growth Equity | 11 | Higher | North America | GB00BD5FHW12 |
| Thesis TM Tellworth UK Select | 5.5 | Lower | Targeted Absolute Return | GB00BNY7YM73 |
| Troy Asset Management Ltd Trojan Global Equity | 11 | Medium | Global | GB00B0ZJ5S47 |
| WS Saracen Global Income & Growth | 10 | Medium | Global Equity Income | GB00B5B35X02 |
My Portfolio asset mix
My portfolio asset mix has approximately 62% exposure to equities. Last month's figures are shown in brackets.
-
- UK Equities 8% (8%)
- North American Equities 24% (25%)
- Asian/Emerging Market Equities 6% (6%)
- Japanese Equities 6% (6%)
- European Equities 11% (7%)
- Chinese equities 0% (0%)
- Other equity 7% (10%)
- Commodities and energy 5% (5%)
- UK Fixed Interest 4% (4%)
- Global Fixed Interest 20% (20%)
- Cash 2% (0%)
- Alternative Investment Strategies 7% (9%)
- Property 0% (0%)
Damien's higher risk and lower risk portfolios
Using the logic described in my post: Update to Damien’s alternative risk portfolios I created hypothetical higher and lower risk versions of my portfolio below:
Lower risk
| Fund | Allocation % |
| abrdn High Yield Bond | 19 |
| Artemis European Select | 6 |
| BNY Mellon Multi-Asset Balanced | 11 |
| Fidelity American | 6 |
| Fidelity Index Japan | 8 |
| iShares Physical Gold ETC | 6 |
| Schroder Strategic Credit | 10 |
| Thesis TM Tellworth UK Select | 7 |
| Troy Asset Management Ltd Trojan Global Equity | 14 |
| WS Saracen Global Income & Growth | 13 |
Higher risk
| Fund | Allocation % |
| Artemis European Select | 7 |
| BNY Mellon Multi-Asset Balanced | 11 |
| Fidelity American | 7 |
| Fidelity Index Japan | 8 |
| iShares Physical Gold ETC | 7 |
| Liontrust India | 8 |
| Ninety One UK Special Situations | 7 |
| T. Rowe Price US Large Cap Growth Equity | 15 |
| Troy Asset Management Ltd Trojan Global Equity | 15 |
| WS Saracen Global Income & Growth | 15 |

£200 Pension Cashback Offer
Make a qualifying deposit or transfer a pension to our partner Interactive Investor.
- Deposit or transfer a pension of at least £20k and you could earn £200 cashback
- Terms and Fees apply, Capital at risk
- New & Existing customers opening a SIPP
- Offer ends 31st July 2026
Before starting your transfer, check you won't lose any valuable benefits (such as guaranteed annuity rates or a lower protected pension age) and find out what exit fees you might have to pay
