

The background to my portfolio
Back in March 2015 I decided to invest £50,000 of my own money using 80-20 Investor. The purpose was twofold, firstly to show how you can use 80-20 Investor to invest and outperform the market with only a few minutes effort every now and then. Secondly, no other investment commentator, journalist or research provider invests their own money for fear of failing. This is a sorry state of affairs and is precisely why I committed to openly running my own portfolio for 80-20 Investor members to see.
Since then I have periodically changed my portfolio using the fund suggestions provided by the 80-20 Investor algorithm and associated research. I always disclose the changes at the time they are made.
Performance update
As is usual in my portfolio reviews, the chart below shows how my portfolio has outperformed since I started the challenge in March 2015, three years ago. The green line is the performance of my portfolio while the red line is the benchmark showing the average return achieved by professional fund managers given the same asset mix. To accurately calculate this I have used the average return for each sector in which my portfolio invested. The blue line shows what the average multi-asset fund with comparable equity content achieved. In other words, the red line would show the extra performance added by just the asset mix of my portfolio (where I was invested i.e European equities etc) over picking a typical multi-asset fund (the blue line). While the green line (which is my actual performance) shows the impact of being in the right funds at the right time, as identified by the 80-20 Investor algorithm.

My portfolio extended its lead over its benchmarks since my last portfolio update as stock markets staged a rebound.
The table below shows my current portfolio, with those funds in green still in the BOTB while those in yellow are not in the BOTB but remain in the BFBS list. Meanwhile, any funds in red have dropped out of both shortlists.
| Name | Allocation % (rounded) | Risk | Sector | ISIN Code | SEDOL Code |
| 7IM US Equity Value | 6.5 | High | North America | GB00BWBSHX88 | BWBSHX8 |
| AXA Framlington American Growth | 4.5 | High | North America | GB00B5LXGG05 | B5LXGG0 |
| Baring Eastern Trust | 5 | High | Asia Pacific Excluding Japan Ret | GB0000799923 | 79992 |
| Fidelity China Consumer | 7 | High | China/Greater China | GB00B82ZSC67 | B82ZSC6 |
| FP Pictet Multi Asset Portfolio | 7 | Low | Targeted Absolute Return | GB00BVYTTC41 | BVYTTC4 |
| Jupiter Japan Income | 5 | High | Japan | GB00B0HZTZ55 | B0HZTZ5 |
| Man GLG UK Income | 3.5 | Medium | UK Equity Income | GB00B0117B11 | B0117B1 |
| Cash | 6.5 | Low | |||
| Premier Diversified | 19 | Medium | Mixed Investment 40-85% Shares | GB00B8BJV423 | B8BJV42 |
| Standard Life Investments UK Real Estate | 6 | Low | Property | GB00BYPHP536 | BYPHP53 |
| TM Cavendish AIM | 11 | High | UK Smaller Companies | GB00B0JX3Z52 | B0JX3Z5 |
| TwentyFour Dynamic Bond | 19 | Low | Sterling Strategic Bond | GB00B5KPRZ34 | B5KPRZ3 |
Glancing at the table above there are a number of funds that are coloured red. But, as I wrote last month, when a fund falls out of the 80-20 Investor fund lists it doesn't suddenly become a bad fund, don't forget the research behind 80-20 Investor allows for funds to be held for 6 months. Both Premier Diversified and Fidelity China Consumer have recently fallen out of both the BOTB and BFBS lists only to return. Chinese equities, in particular, look like they have finally found their footing after lagging other global equity markets and proving a drag on my portfolio.
However, two funds that fell out of both the BOTB and BFBS last month have remained so, namely 7IM US Equity Value and TM Cavendish AIM, although the latter made a brief reappearance in the BFBS in recent weeks. With the technology sector leading the rebound in stocks the 7IM US Equity Value has lagged its peers. This is partly because it has a closer correlation to the Dow Jones Industrial Average, which is less exposed to technology stocks while also being more hampered by fears over the escalating trade war between China and the US. It's not a bad fund but value stocks are again underperforming growth stocks and given that I began dripping out of the fund last month I plan to now complete the process.
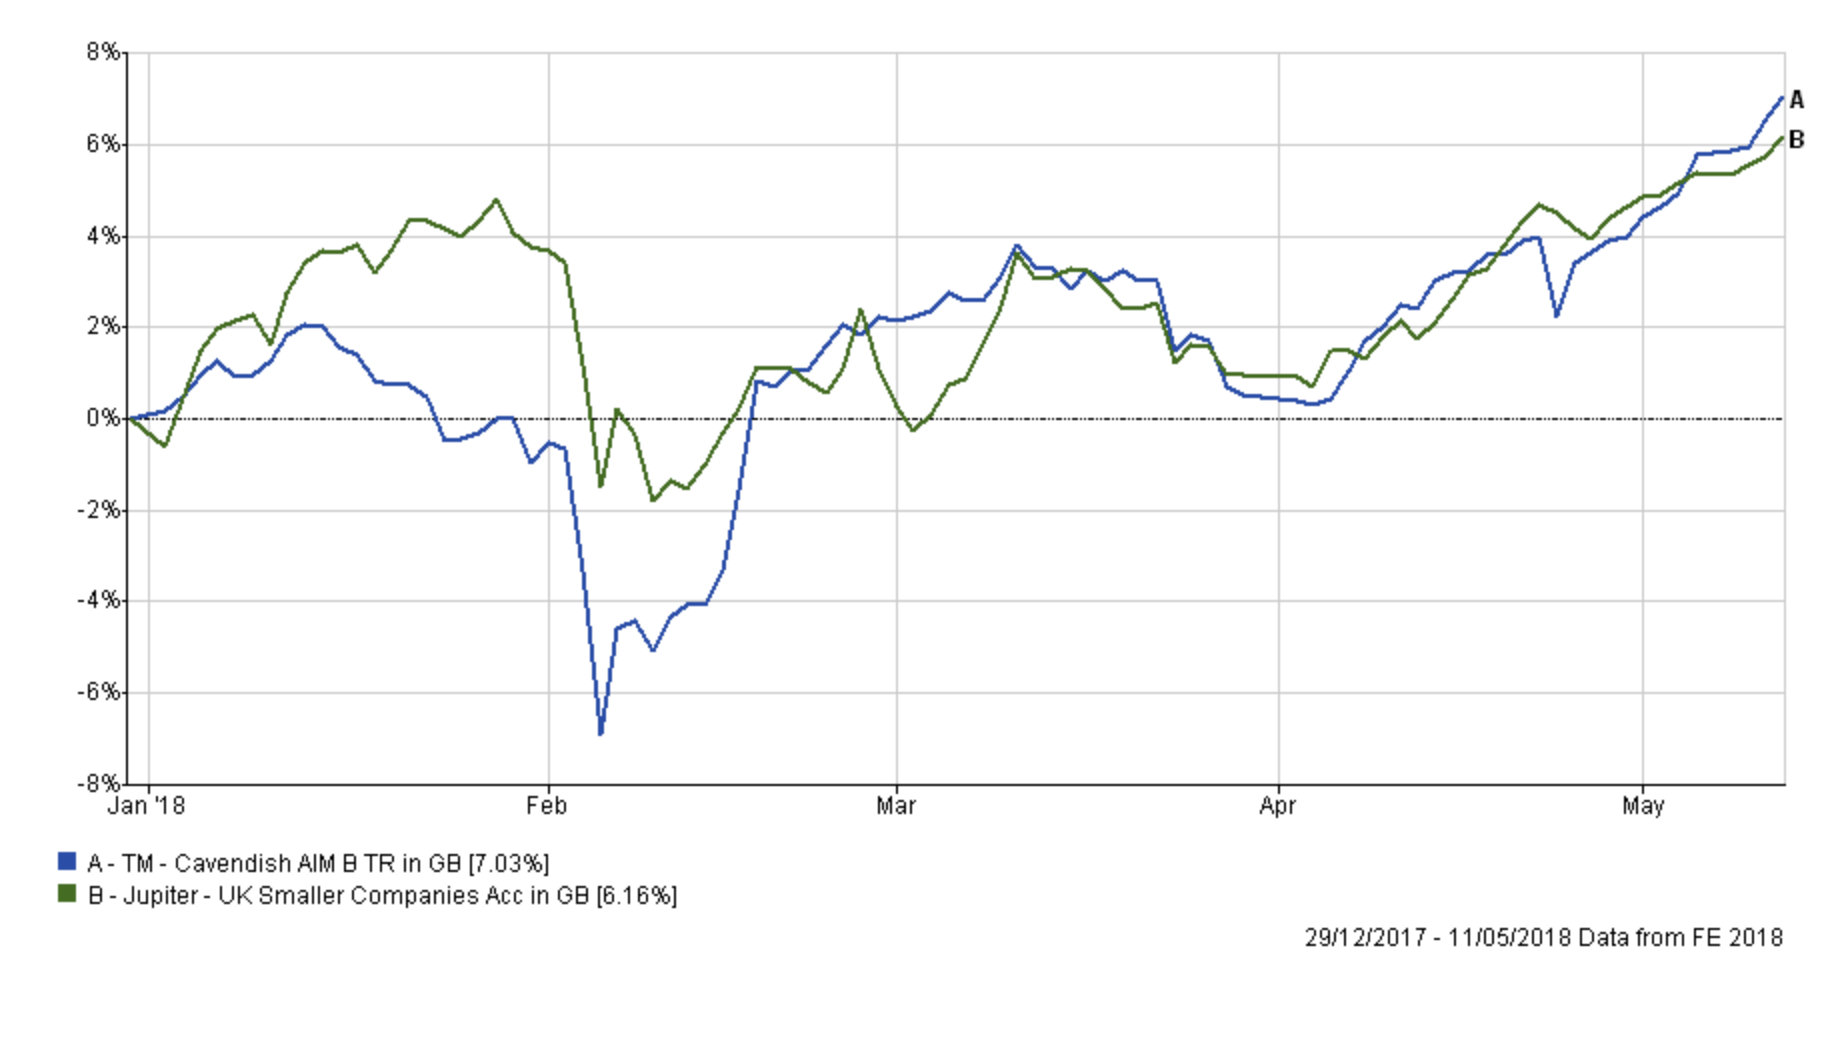
Cavendish AIM on the other has performed very well since the market lows in February, but it did start from a lower base after struggling in February's stock market correction. If you look at the year-to-date performance of the fund versus a BOTB regular from the same sector, namely Jupiter UK Smaller Companies, you can see the downside risks posed by the Cavendish fund. It is, therefore, an opportune time to review its inclusion in my portfolio especially as stock market volatility has reduced. I'm looking for more consistency of returns as the stock market remains prone to pullbacks.
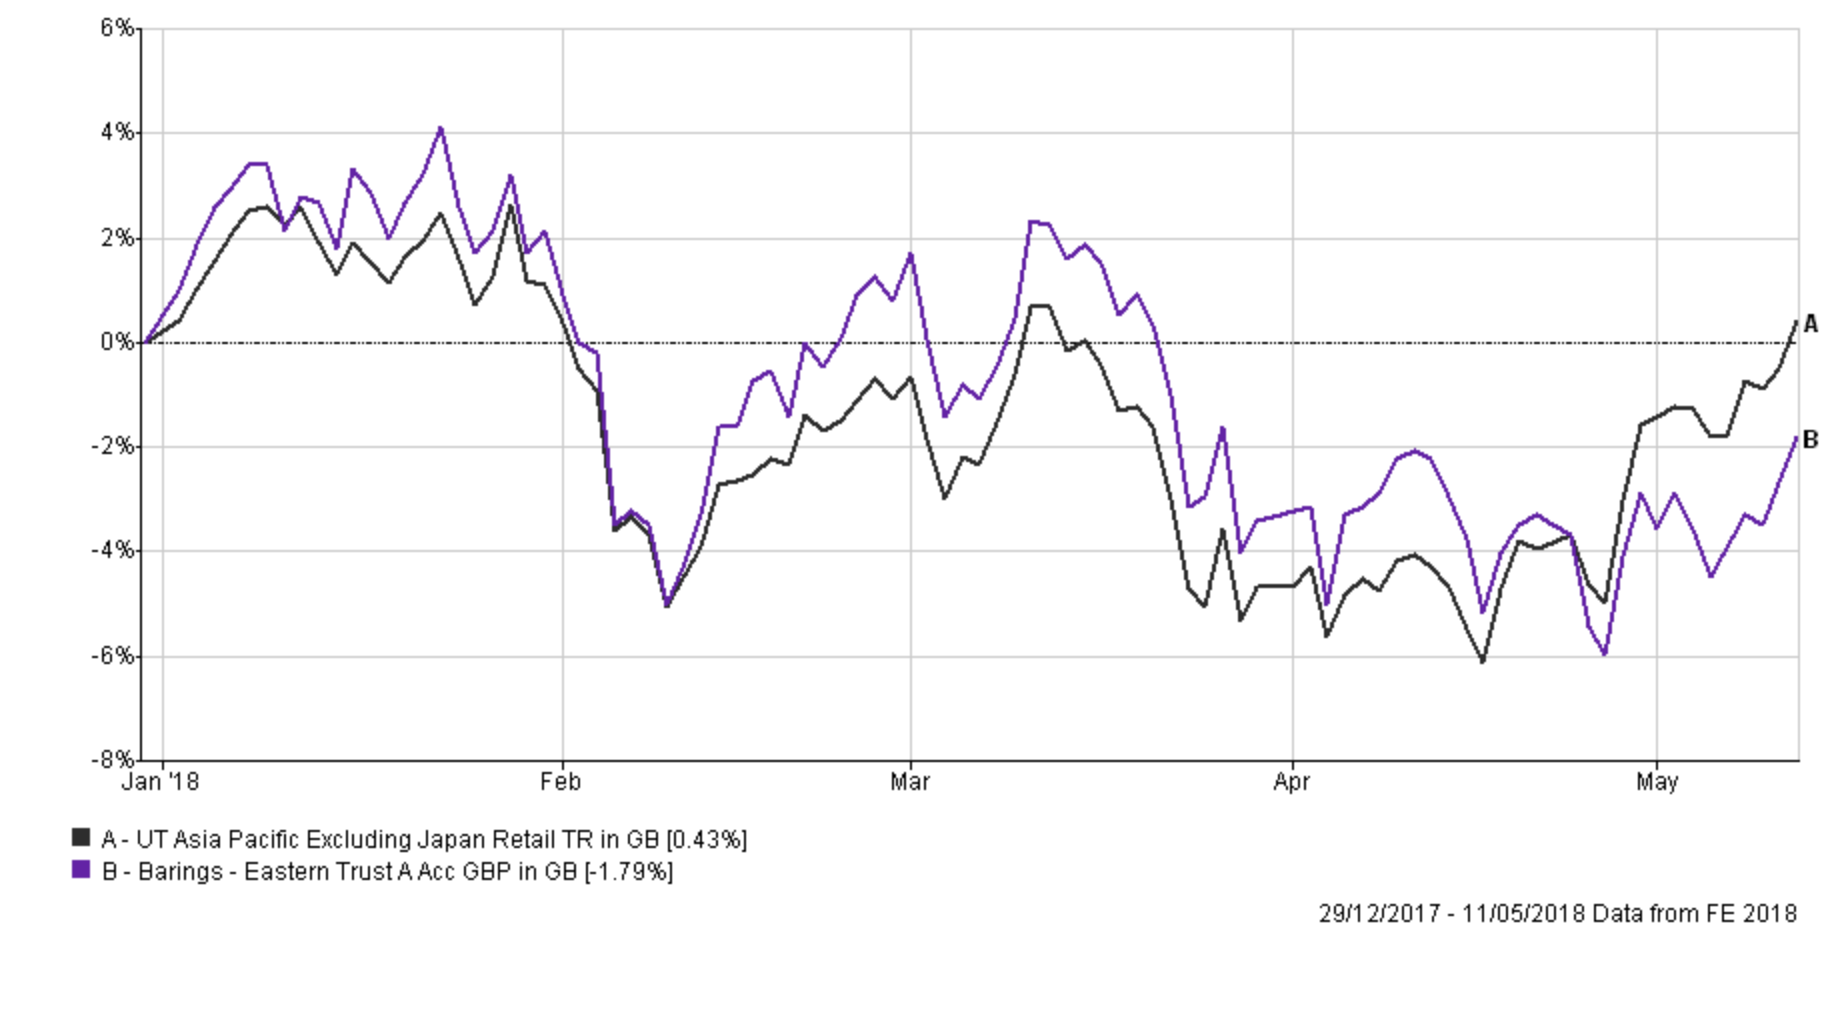
Baring Eastern Trust, while not a significant holding, has disappointed in the last month. If you look at the chart below the fund has not enjoyed the rebound other Asian equity funds have. Yet again, it's not a terrible fund but as things stand better opportunities are emerging elsewhere.
That then leaves us with my three low-risk holdings that are coloured red. They are:
- FP Pictet Multi Asset Portfolio
- Standard Life Investments UK Real Estate
- TwentyFour Dynamic Bond
All three narrowly missed out being included in the most recent BFBS update. This is a sign of their consistency and while bond markets continue to be twitchy I am more concerned with diversifying my low-risk holdings and capital preservation rather than just focusing on the potential upside. The FP Pictet Multi Asset Portfolio has performed well over the last month (up over 1.5%) outperforming most low-risk funds out there. The Standard Life UK Real Estate fund has been boring but reliable while Twentyfour Dynamic continues to outperform most other bond funds as shown below. Until the nervousness in bond markets settles down I am loathed to increase my exposure to bonds.

It was particularly pleasing to see that those funds that I kept faith with last month, and which similarly had fallen out of the 80-20 Investor tables at the time, rewarded that faith and performed well. Fidelity China Consumer even bounced back into the BFBS tables. Let's hope the three low-risk funds mentioned above can do the same.
Looking at the remaining funds in my portfolio. I have no intention of changing any of the funds that are highlighted yellow or green. In addition, my overall asset allocation is broadly in line with the BOTB, In fact, the BOTB asset allocation has moved closer to that of my portfolio in the latest update. The only exception is that my portfolio has a slightly higher cash position and a lower Japanese equity exposure. In the fund switches listed below I rectify this. Given that I plan to maintain the current asset mix in light of the most recent BOTB update, you will notice that most of the fund switches are like-for-like (i.e to and from the same asset class). This made the exercise far easier as I focused on picking funds with no bid/offer spread which were in the BOTB/BFBS tables and available on my platform. That in fact led me to back a number of my existing winners.
For that reason I am carrying out the switches listed below:
Fund switches
- 100% out of cash and 100% into AXA Framlington American Growth
- 100% out of TM Cavendish AIM and 33% into Man GLG UK Income and 64% into Jupiter UK Smaller Companies
- 100% out of Baring Eastern Trust and 100% into Fidelity Asia
- 100% out of 7IM US Equity Value and 75% into Baillie Gifford Global Discovery and 25% into Jupiter Japan Income
In carrying out the above switches I:
- bring my portfolio's cash position down in line with that of the BOTB
- raise my overall equity exposure, in the same vein as this month's BOTB
- doubled down on some of my funds which have been performing well (i.e. backed my winners)
- reduced the number of positions within my portfolio
Overall I am switching about 30% of my portfolio, which is one of the biggest changes I've made for some time, and my new portfolio will look as follows with an equity exposure of around 53% (marginally up from 51%).
| Name | Allocation % (rounded) | Risk | Sector | ISIN Code | SEDOL Code |
| Baillie Gifford Global Discovery | 5 | Medium | Global | GB0006059330 | 605933 |
| AXA Framlington American Growth | 11.5 | High | North America | GB00B5LXGG05 | B5LXGG0 |
| Fidelity Asia | 4.5 | High | Asia Pacific Excluding Japan Ret | GB00B6Y7NF43 | B6Y7NF4 |
| Fidelity China Consumer | 7 | High | China/Greater China | GB00B82ZSC67 | B82ZSC6 |
| FP Pictet Multi Asset Portfolio | 7 | Low | Targeted Absolute Return | GB00BVYTTC41 | BVYTTC4 |
| Jupiter Japan Income | 7 | Medium | Japan | GB00B0HZTZ55 | B0HZTZ5 |
| Man GLG UK Income | 7.5 | Medium | UK Equity Income | GB00B0117B11 | B0117B1 |
| Jupiter UK Smaller Companies | 7.5 | Medium | UK Smaller Companies | GB0004911870 | 491187 |
| Premier Diversified | 18 | Medium | Mixed Investment 40-85% Shares | GB00B8BJV423 | B8BJV42 |
| Standard Life Investments UK Real Estate | 6 | Low | Property | GB00BYPHP536 | BYPHP53 |
| TwentyFour Dynamic Bond | 19 | Low | Sterling Strategic Bond | GB00B5KPRZ34 | B5KPRZ3 |
My new asset mix
This means my new asset mix is (previous asset mix is in brackets):
-
- UK Equities 19% (18%)
- North American Equities 17% (14%)
- Global Fixed Interest 13% (13%)
- Japanese Equities 8% (7%)
- Other International Equities 0% (0%)
- Asian equities 4% (5%)
- European Equities 0% (0%)
- UK Fixed Interest 6% (6%)
- Cash 5% (7%)
- Alternative Investment Strategies 15% (18%)
- Emerging Asia equities 6% (5%)
- Emerging Market Fixed Interest 0% (0%)
- Property 7% (7%)
Damien's high risk and low risk portfolios
Using the logic described in my post New: Damien’s Higher Risk Portfolio the higher and lower risk versions of my portfolio would like as follows:
Higher risk
| Name | Allocation % (rounded) |
| Baillie Gifford Global Discovery | 7.4 |
| AXA Framlington American Growth | 16.9 |
| Fidelity Asia | 6.6 |
| Fidelity China Consumer | 10.3 |
| Jupiter Japan Income | 10.3 |
| Man GLG UK Income | 11.0 |
| Jupiter UK Smaller Companies | 11.0 |
| Premier Diversified | 26.5 |
Lower risk
| Name | Allocation % (rounded) |
| Baillie Gifford Global Discovery | 6.5 |
| FP Pictet Multi Asset Portfolio | 9.1 |
| Jupiter Japan Income | 9.1 |
| Man GLG UK Income | 9.7 |
| Jupiter UK Smaller Companies | 9.7 |
| Premier Diversified | 23.4 |
| Standard Life Investments UK Real Estate | 7.8 |
| TwentyFour Dynamic Bond | 24.7 |

£200 Pension Cashback Offer
Make a qualifying deposit or transfer a pension to our partner Interactive Investor.
- Deposit or transfer a pension of at least £20k and you could earn £200 cashback
- Terms and Fees apply, Capital at risk
- New & Existing customers opening a SIPP
- Offer ends 31st July 2026
Before starting your transfer, check you won't lose any valuable benefits (such as guaranteed annuity rates or a lower protected pension age) and find out what exit fees you might have to pay
