

The background to my portfolio
Back in March 2015 I decided to invest £50,000 of my own money using 80-20 Investor. The purpose was twofold, firstly to show how you can use 80-20 Investor to invest and outperform the market with only a few minutes effort every now and then. Secondly, no other investment commentator, journalist or research provider invests their own money for fear of failing. This is a sorry state of affairs and is precisely why I committed to openly running my own portfolio for 80-20 Investor members to see.
Since then I have periodically changed my portfolio using the fund suggestions provided by the 80-20 Investor algorithm and associated research. I always disclose the changes at the time they are made.
Performance update
As is usual in my portfolio reviews, the chart below shows how my portfolio has outperformed since I started the challenge in March 2015, which is five years ago. The green line is the performance of my portfolio while the red line is the benchmark showing the average return achieved by professional fund managers given the same asset mix. To accurately calculate this I have used the average return for each sector in which my portfolio invested. The blue line shows what the average multi-asset fund with comparable equity content achieved. In other words, the red line would show the extra performance added by just the asset mix of my portfolio (where I was invested i.e European equities etc) over picking a typical multi-asset fund (the blue line). While the green line (which is my actual performance) shows the impact of being in the right funds at the right time, as identified by the 80-20 Investor algorithm.
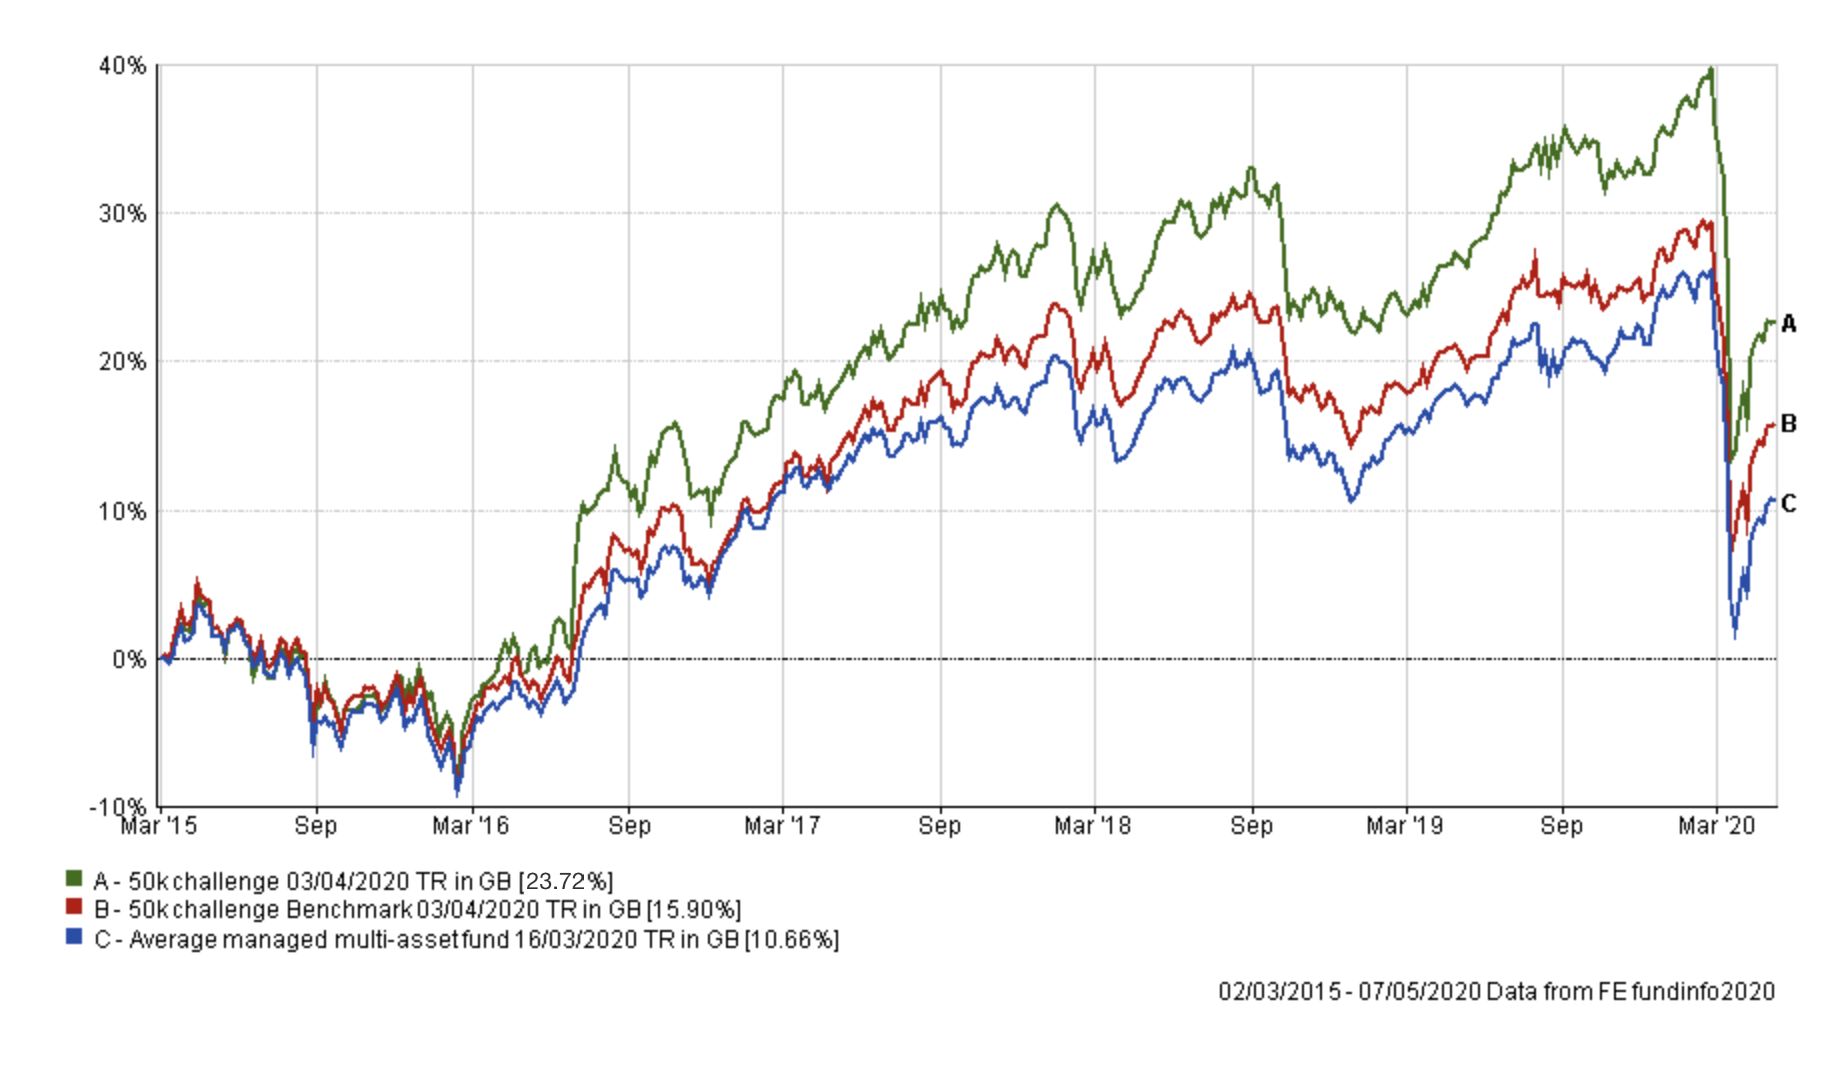
My portfolio continues to outperform its benchmarks since inception. The chart below shows the performance of my portfolio versus its benchmarks since my portfolio review a month ago and as you can see it's performed almost exactly in line with its benchmarks. That is a pretty good result especially given the level of cash I have been holding (20% of my portfolio). 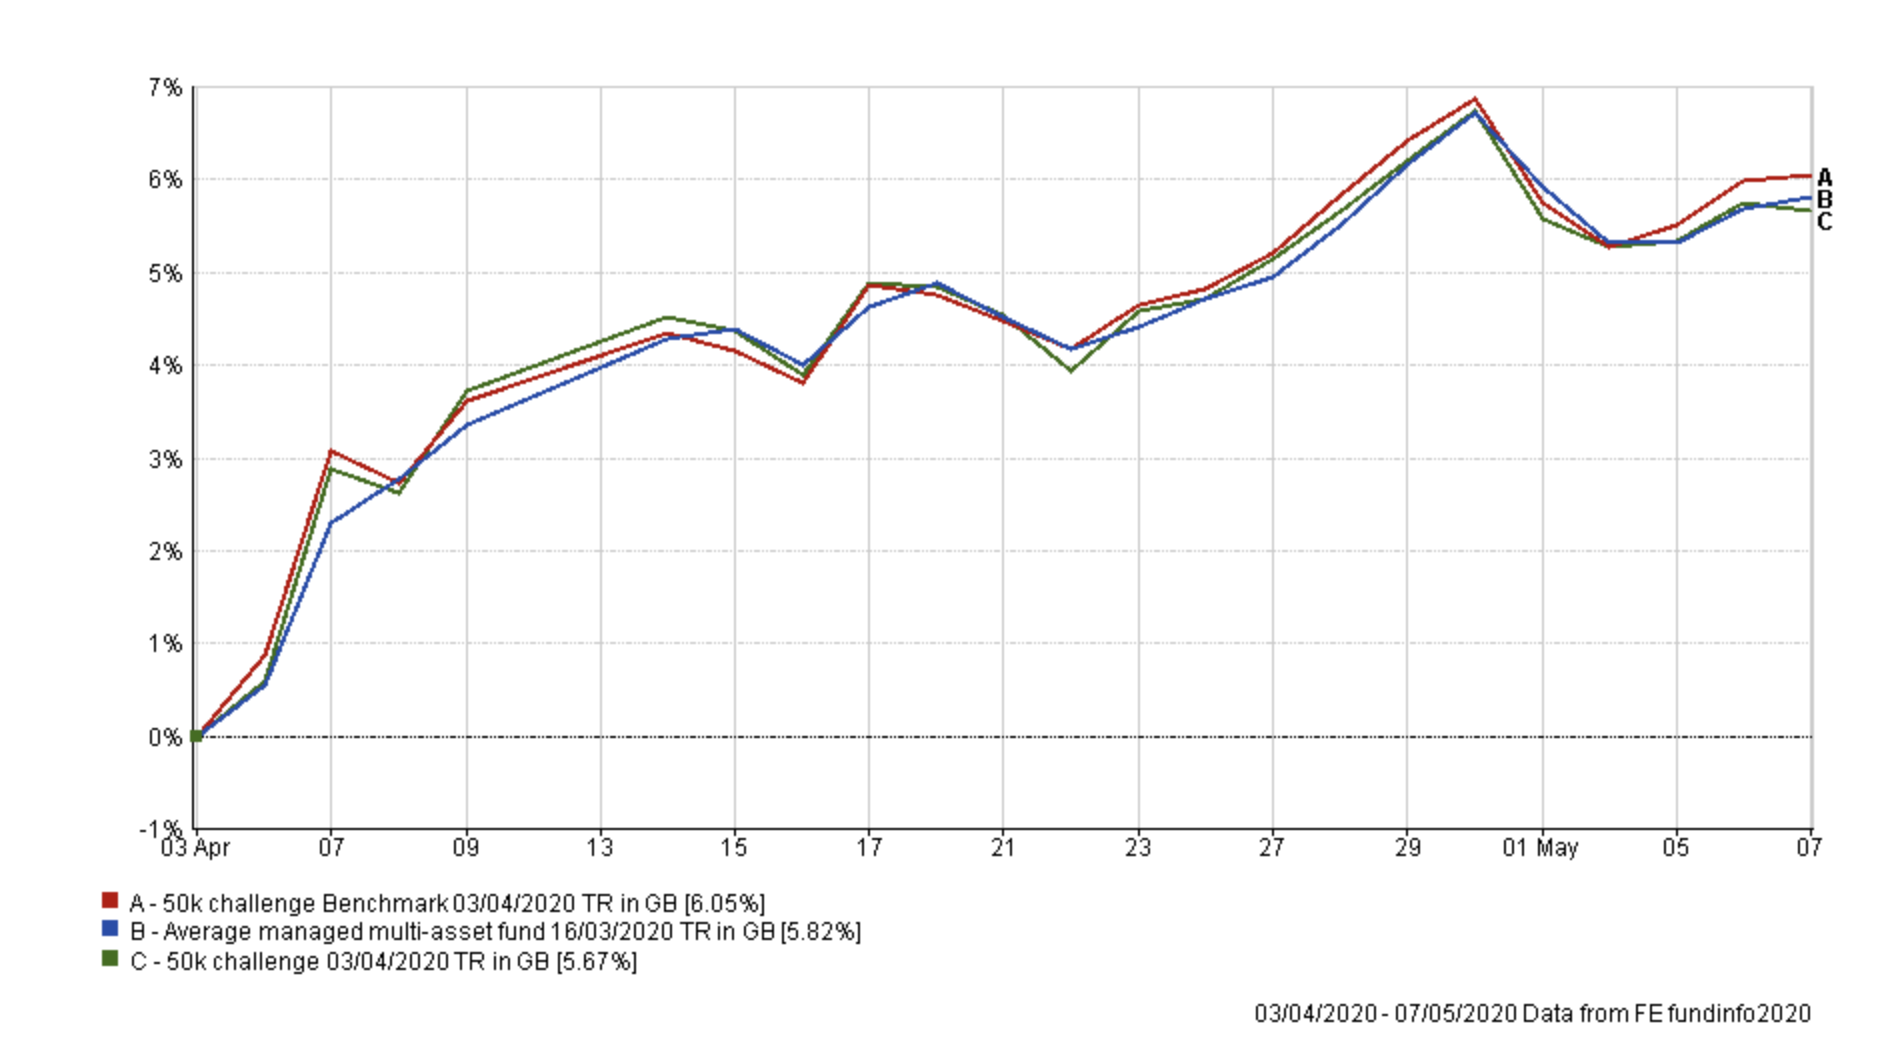
As is the tradition in these portfolio reviews, the table below shows which funds within my portfolio are in the current BOTB or BFBS tables and which are not. Those funds in green are still in the BOTB while those in yellow are not in the BOTB but remain in the BFBS list. Meanwhile, any funds in red have dropped out of both shortlists.
| Name | Allocation % (rounded) | Risk | Sector | ISIN Code |
| Fidelity European | 4.5 | Medium | Europe Excluding UK | GB00BFRT3504 |
| Jupiter Japan Income | 6 | High | Japan | GB00B0HZTZ55 |
| M&G Global Listed Infrastructure | 6.5 | Medium | Global | GB00BF00R928 |
| Slater Growth | 6.5 | Medium | UK All Companies | GB00B0706C66 |
| VT Gravis Clean Energy Income | 10.5 | Medium | Global | GB00BFN4H792 |
| ASI UK Real Estate Share | 4 | High | Property Other |
GB00B0XWNN66
|
| Premier Diversified Growth | 9 | Medium | Mixed Investment 40-85% Shares | GB00B8BJV423 |
| Royal London UK Government Bond | 16 | Medium | UK Gilts | GB00B881TW52 |
| Allianz Strategic Bond | 10 | Medium | Sterling Strategic Bond | GB00B06T9362 |
| Troy Asset Management Ltd Trojan Ethical | 7 | Low | Flexible Investment | GB00BJP0XX17 |
| Cash | 20 | Low |
In April I refrained from making wholesale changes to my portfolio but I did decide to diversify my portfolio to invest in government bonds in the US and the UK, via Royal London UK Government Bond (which I already held) and the Allianz Strategic Bond. I also invested in Troy Asset Management Ltd Trojan Ethical which invests in a range of assets including US dollars, treasuries and gold. All of these assets are enjoying a continued bull market as demonstrated in May's Monthly newsletter. Also in April I reduced my UK equity holdings (namely ASI UK Real Estate Share & Slater Growth) which had been portfolio laggards, as well as invested some cash.
We are now a month on from my last review and more than two months into this crisis. There's been much speculation over whether we will have a v-shaped recovery with markets quickly heading back to new all-time highs or whether it will be a more drawn-out affair. The market certainly enjoyed a strong rebound in April, as did my portfolio shown above.
Despite this, only two funds within my portfolio are in the BOTB or BFBS tables. This is a reflection of the pre & post-coronavirus world. The market narrative has changed and those equity funds that have performed the best since the market crash began are largely technology stocks, consumer staples stocks, and healthcare stocks. The last two in particular often perform well in recessionary environments, such as we have now. It is therefore not surprising that the top equity fund performers from the BOTB in the last two months have exposure to these sectors.
The chart below shows how each of the funds in my portfolio, that I've held since at least February, have performed since the market began falling due to the coronavirus pandemic.
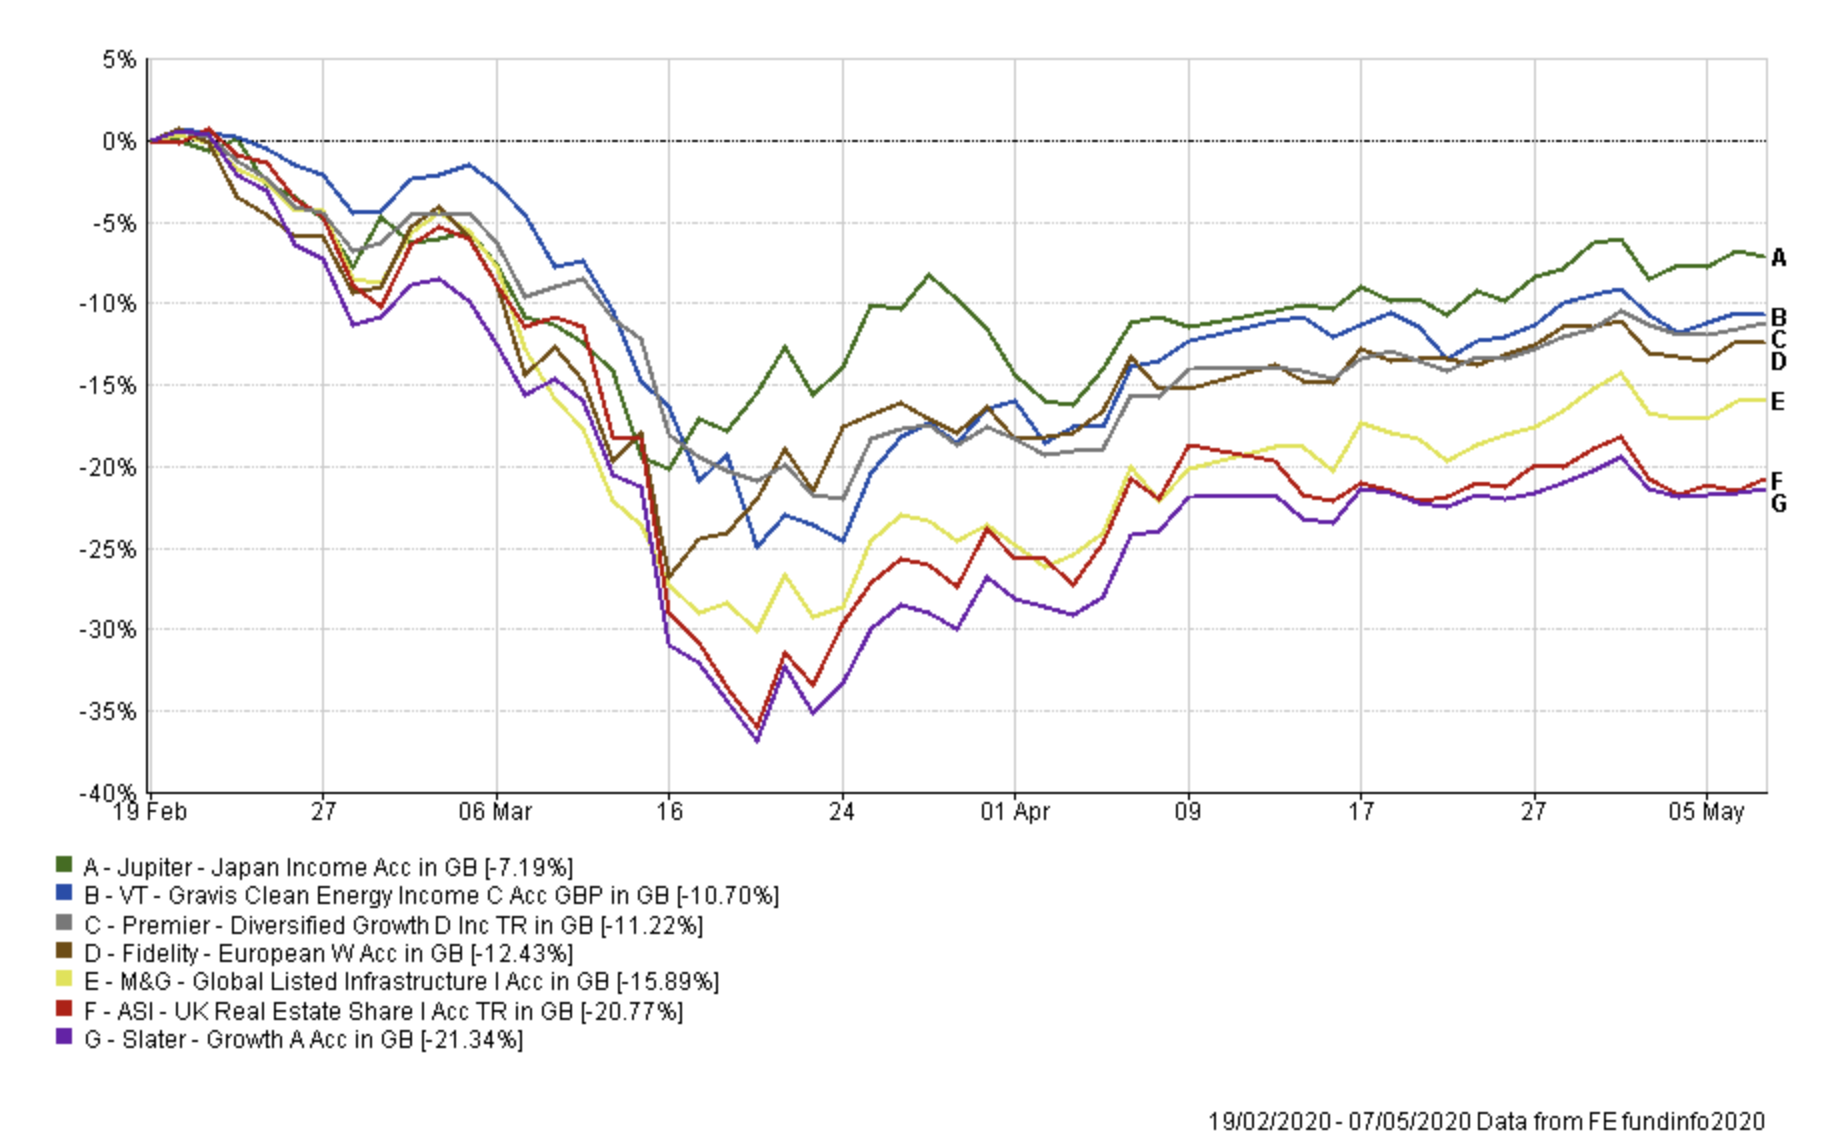
You will notice that my UK equity funds, namely Slater Growth and ASI UK Real Estate tumbled as much as 35% before rallying and still sit around 20% below their February highs. This is reflective of UK equities in general. By way of example, the FTSE 100 is still down -20.40% from its February high point. But as you can see much of the rebound for UK equities occurred between 19th March and the 9th of April, after which the rebound largely stalled. The same is not universally true of all my other holdings. It's unsurprising that the BOTB has no exposure to UK equities for the second month in a row. My holdings with overseas equity exposure, particularly in the US such as M&G Global Infrastructure, have rallied far more.
It is for this reason that I am going to sell the remnants of my UK holdings and reinvest the proceeds elsewhere. Theoretically, this will crystalline the losses but I am moving straight into new funds which hopefully have better prospects (and momentum) in the current market environment. The UK Real Estate fund, in particular, is exposed to the fortunes of the UK economy, and while it held up well at the start of the sell-off once the scale of the impending recession grew apparent it started to lag.
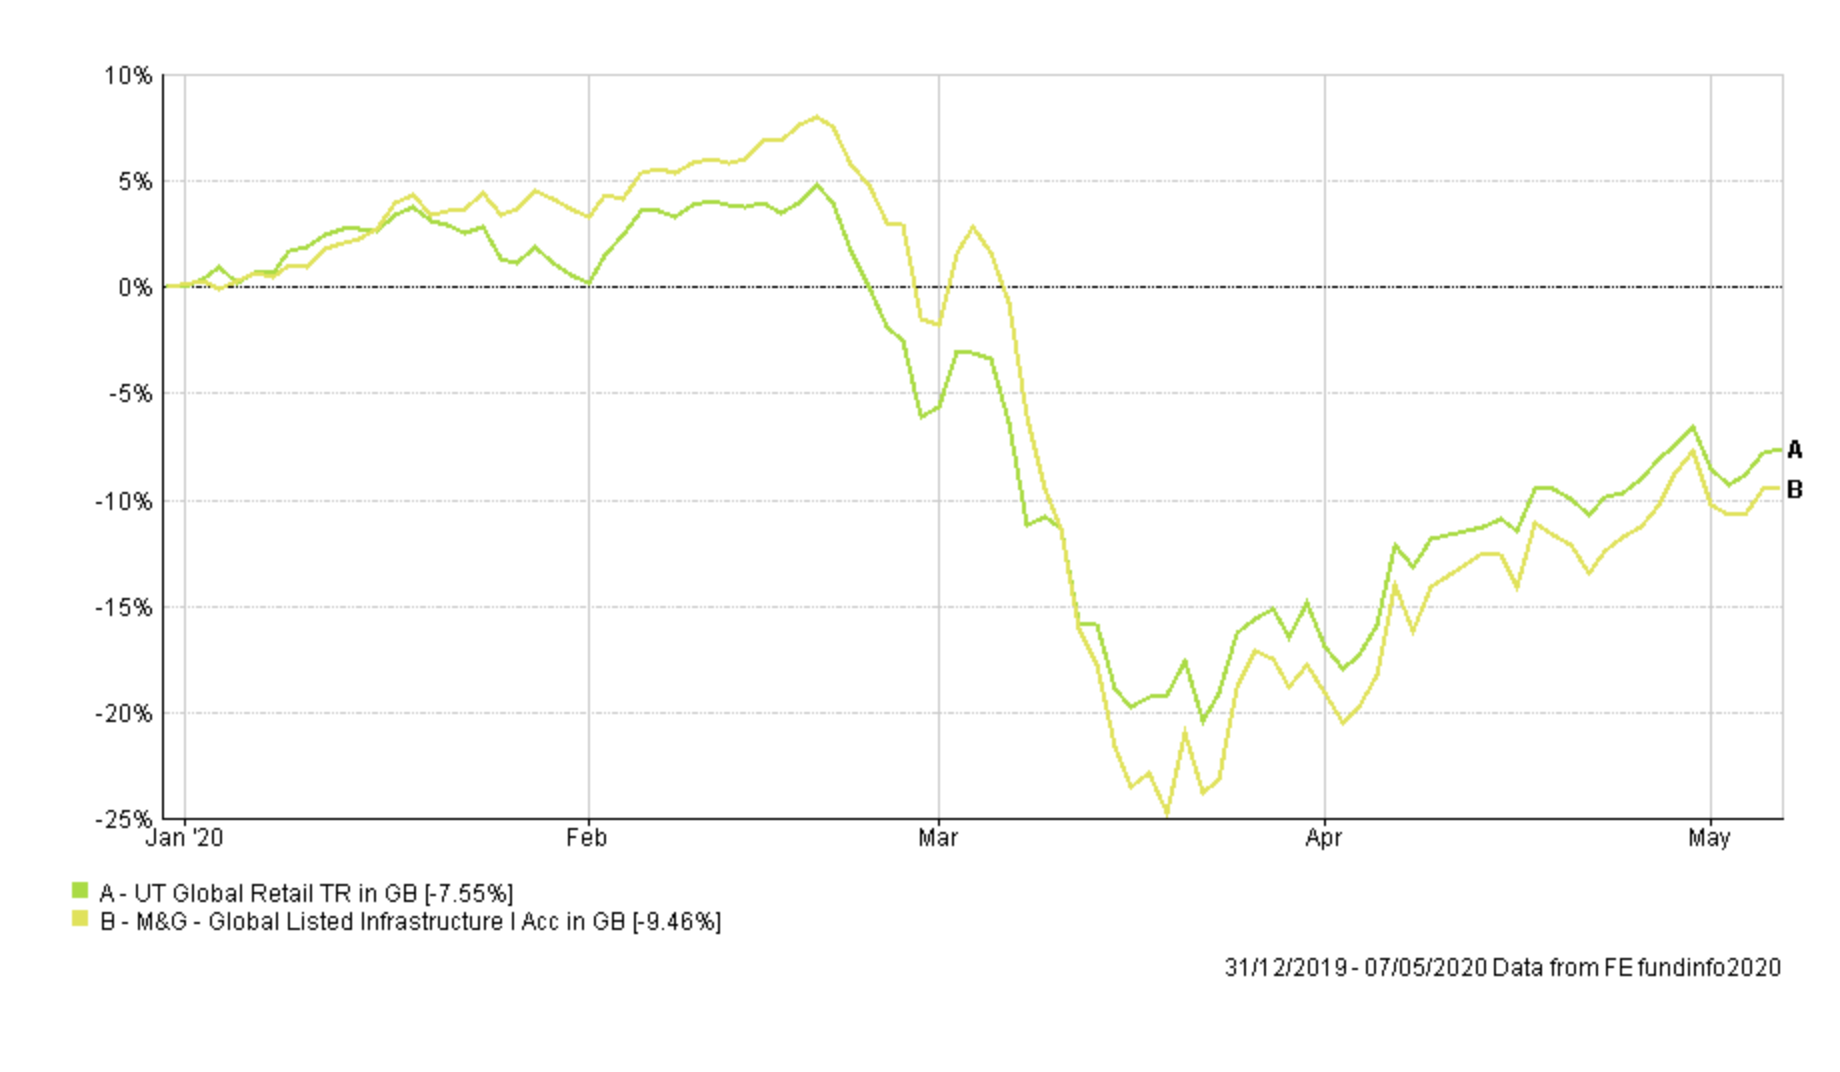
Interestingly the same can be said of the M&G Global Listed Infrastructure fund, despite its rebound. The fund has exposure to utilities and performed very well initially during the sell-off. After all, utilities tend to perform better in a recession. However, since early March the fund has lagged. Having now recouped half of its losses better potential opportunities lie elsewhere. That's not to say it's a bad fund, indeed the chart below shows its performance since I've held it, which is for more than a year. During that time it has made more than 10% profit, while its peers have made 4.8% in comparison.
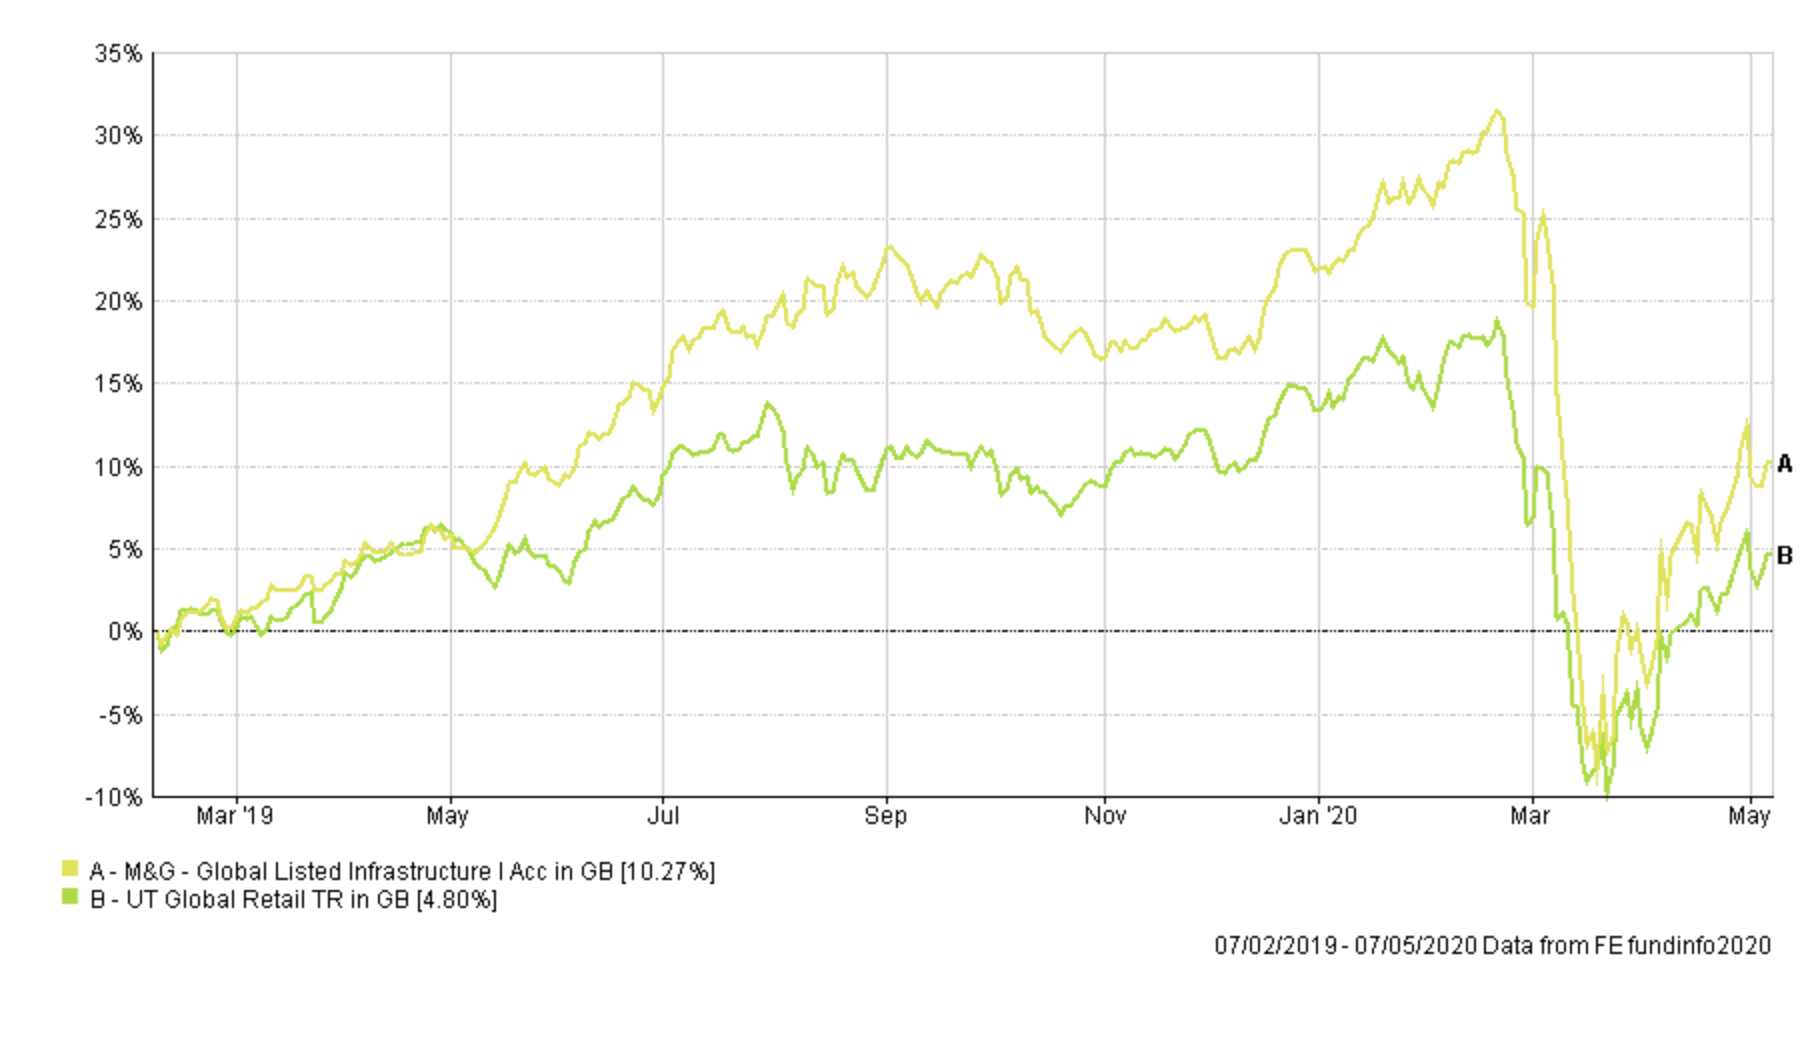
However, despite its recent recovery if you look at its recent performance since the start of the year it is now lagging its peers in the global sector as shown below.
So I am now looking to move out of the fund into others within its peer group that have fared better in the current economic backdrop.
In the next section, I list a number of fund switches which I will implement. The aim of which is to:
- trim my losing equity positions, bolster some of my winning bond positions (namely the Allianz Strategic Bond funds)
- remove my direct UK equity fund exposure
- bring my asset mix back more line with the BOTB, although some key differences remain
- put some cash back to work
- keep my overall equity exposure largely the same
For now I'm only focussing on making minor changes to my portfolio due to the volatility in equity markets. In total the changes only impact 17.5% of my portfolio. I am happy to keep the remaining funds in my portfolio that are not in the 80-20 Investor fund lists (i.e. highlighted in red in the table above for now). The market backdrop is an uncertain one so I am looking to morph my portfolio slowly. Put simply, what worked in February, didn't work in March but did start to work again in April. With this level of volatility, it is prudent to make gradual changes.
The two new funds I am investing in include Baillie Gifford Long Term Global Growth Investment, which is essentially a technology stock play. It's biggest holdings include the likes of Amazon and Netflix, which have benefited from the 'work from home' movement. The other fund is Schroder Global Healthcare which as the name suggests has exposure to healthcare. Both are in the current BOTB selection while the latter has been in the BOTB and BFBS for most of this year.
You will notice from the list of fund switches below that rather than switch from my existing equity holdings directly into the new ones, I have mostly used my cash holding to buy the new funds while simultaneously selling my old funds and using the proceeds to top up my cash holding. The reason I have done this is that it actually speeds up the switching process. Normally a switch requires two transactions, a sell one day and then a buy which happens at least one or two days later. By making the transaction in the way shown below I'm more likely to spend less time out of equity markets as the sale and buy instructions happen at the same time.
Fund switches
- 100% out of ASI UK Real Estate Share and into cash
- 100% out of M&G Global Listed Infrastructure and into cash
- 100 % out of Slater Growth and into 100% Allianz Strategic Bond
- 100% out of cash and 20% into Troy Asset Management Ltd Trojan Ethical, 40% into Schroder Global Healthcare and 40% Baillie Gifford Long Term Global Growth Investment
My portfolio now looks like this:
| Name | Allocation % (rounded) | Risk | Sector | ISIN Code |
| Fidelity European | 4.5 | Medium | Europe Excluding UK | GB00BFRT3504 |
| Jupiter Japan Income | 6 | High | Japan | GB00B0HZTZ55 |
| Schroder Global Healthcare | 8 | Medium | Global | GB00B76V7Q08 |
| Baillie Gifford Long Term Global Growth Investment | 8 | High | Global | GB00BD5Z0Z54 |
| VT Gravis Clean Energy Income | 10.5 | Medium | Global | GB00BFN4H792 |
| Premier Diversified Growth | 9 | Medium | Mixed Investment 40-85% Shares | GB00B8BJV423 |
| Royal London UK Government Bond | 16 | Medium | UK Gilts | GB00B881TW52 |
| Allianz Strategic Bond | 16.5 | Low | Sterling Strategic Bond | GB00B06T9362 |
| Troy Asset Management Ltd Trojan Ethical | 10.5 | Medium | Flexible Investment | GB00BJP0XX17 |
| Cash | 11 | Low |
My Portfolio asset mix
My portfolio asset mix is as shown below (the previous asset mix is in brackets). My equity exposure is approximately 45%:
-
- UK Equities 4% (10%)
- North American Equities 18% (11%)
- Global Fixed Interest 21% (13%)
- Japanese Equities 6% (6%)
- European Equities 10% (9%)
- UK Fixed Interest 0% (0%)
- UK Gilt 15% (15%)
- Cash 13% (22%)
- Alternative Investment Strategies 7% (4%)
- Emerging Market Fixed Interest 0% (0%)
- Commodities and energy 6% (6%)
- Property 0% (4%)
Damien's higher risk and lower risk portfolios
Using the logic described in my post: Update to Damien’s alternative risk portfolios I created hypothetical higher and lower risk versions of my portfolio below:
Higher risk
| Fund | Allocation % |
| Fidelity European | 6.2 |
| Jupiter Japan Income | 8.3 |
| Schroder Global Healthcare | 11 |
| Baillie Gifford Long Term Global Growth Investment | 11 |
| VT Gravis Clean Energy Income | 14.5 |
| Premier Diversified Growth | 12.4 |
| Royal London UK Government Bond | 22.1 |
| Troy Asset Management Ltd Trojan Ethical | 14.5 |
Lower risk
| Fund | Allocation % |
| Fidelity European | 5.2 |
| Schroder Global Healthcare | 9.3 |
| VT Gravis Clean Energy Income | 12.2 |
| Premier Diversified Growth | 10.5 |
| Royal London UK Government Bond | 18.6 |
| Allianz Strategic Bond | 19.2 |
| Troy Asset Management Ltd Trojan Ethical | 12.2 |
| Cash | 12.8 |

£200 Pension Cashback Offer
Make a qualifying deposit or transfer a pension to our partner Interactive Investor.
- Deposit or transfer a pension of at least £20k and you could earn £200 cashback
- Terms and Fees apply, Capital at risk
- New & Existing customers opening a SIPP
- Offer ends 31st July 2026
Before starting your transfer, check you won't lose any valuable benefits (such as guaranteed annuity rates or a lower protected pension age) and find out what exit fees you might have to pay
