

The background to my portfolio
Back in March 2015 I decided to invest £50,000 of my own money using 80-20 Investor. The purpose was twofold, firstly to show how you can use 80-20 Investor to invest and outperform the market with only a few minutes effort every now and then. Secondly, no other investment commentator, journalist or research provider invests their own money for fear of failing. This is a sorry state of affairs and is precisely why I committed to openly running my own portfolio for 80-20 Investor members to see.
Since then I have periodically changed my portfolio using the fund suggestions provided by the 80-20 Investor algorithm and associated research. I always disclose the changes at the time they are made.
Performance update
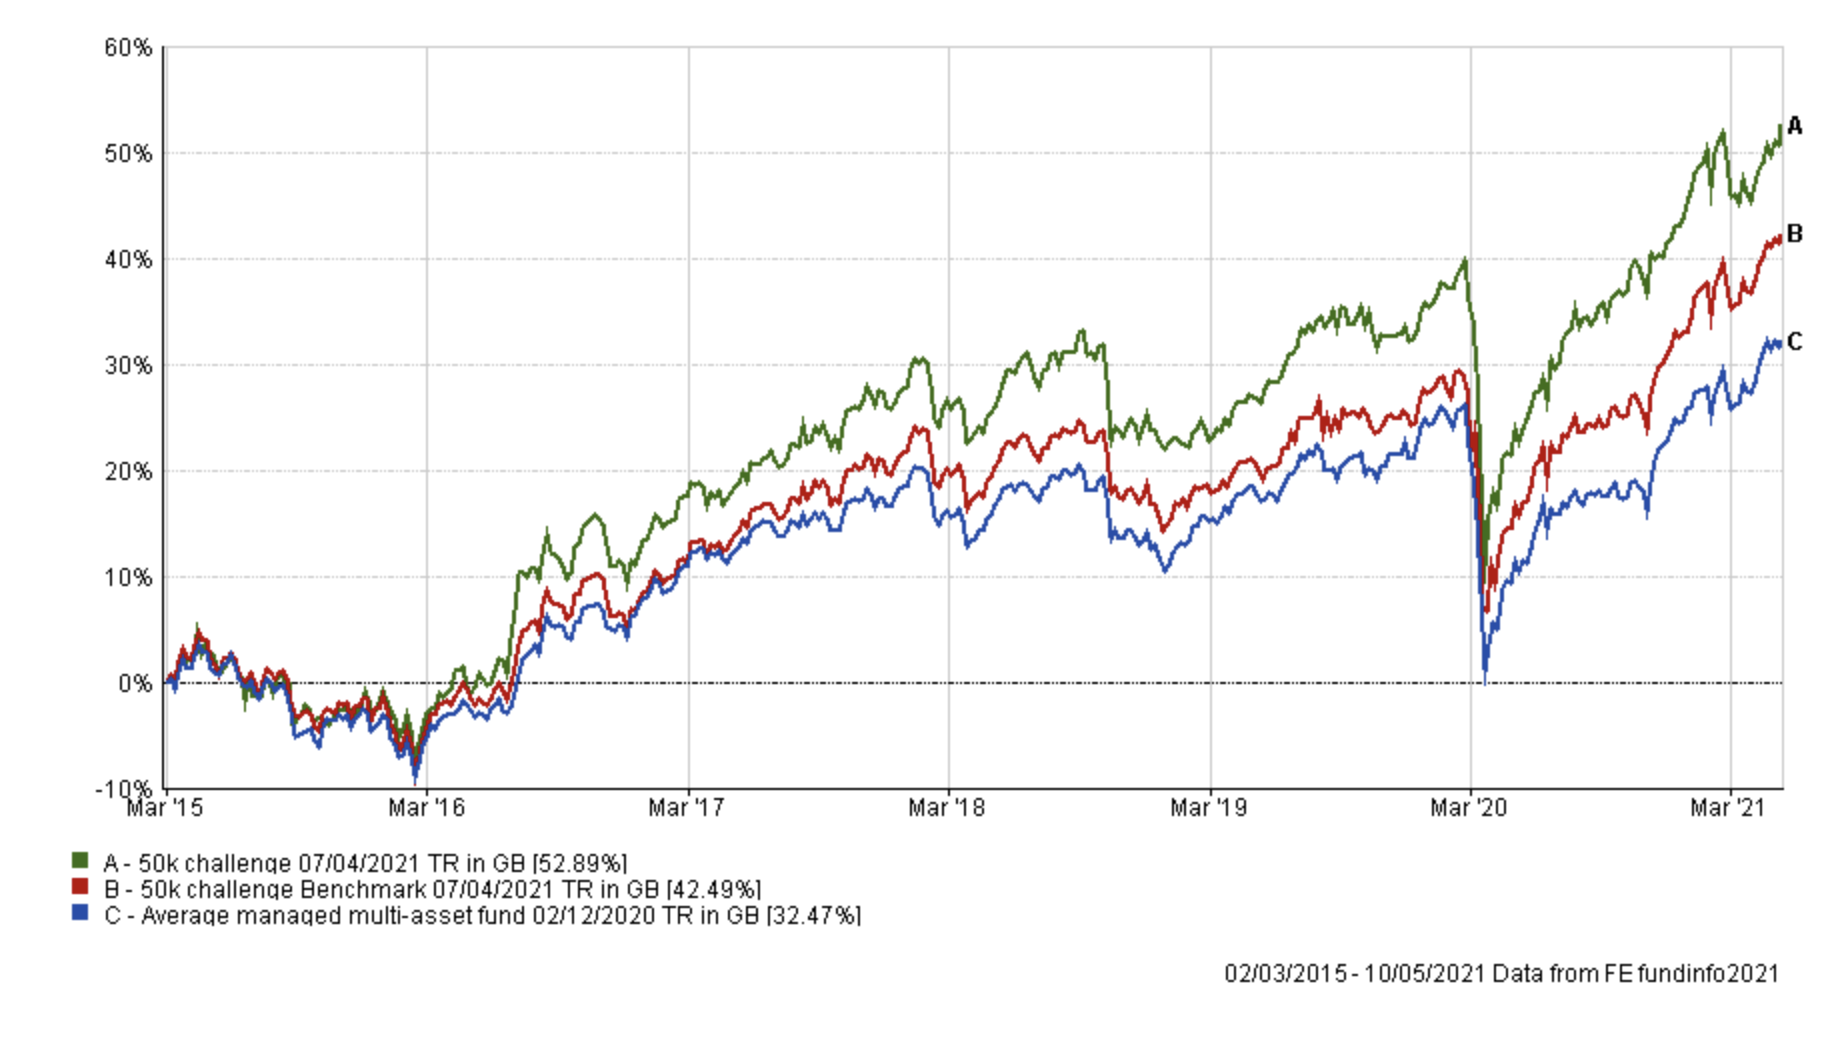
As is usual in my portfolio reviews, the chart below shows how my portfolio has outperformed since I started the challenge in March 2015, which is over six years ago. The green line is the performance of my portfolio while the red line is the benchmark showing the average return achieved by professional fund managers given the same asset mix. To accurately calculate this I have used the average return for each sector in which my portfolio invested. The blue line shows what the average multi-asset fund with comparable equity content achieved. In other words, the red line would show the extra performance added by just the asset mix of my portfolio (where I was invested i.e European equities etc) over picking a typical multi-asset fund (the blue line). While the green line (which is my actual performance) shows the impact of being in the right funds at the right time, as identified by the 80-20 Investor algorithm.
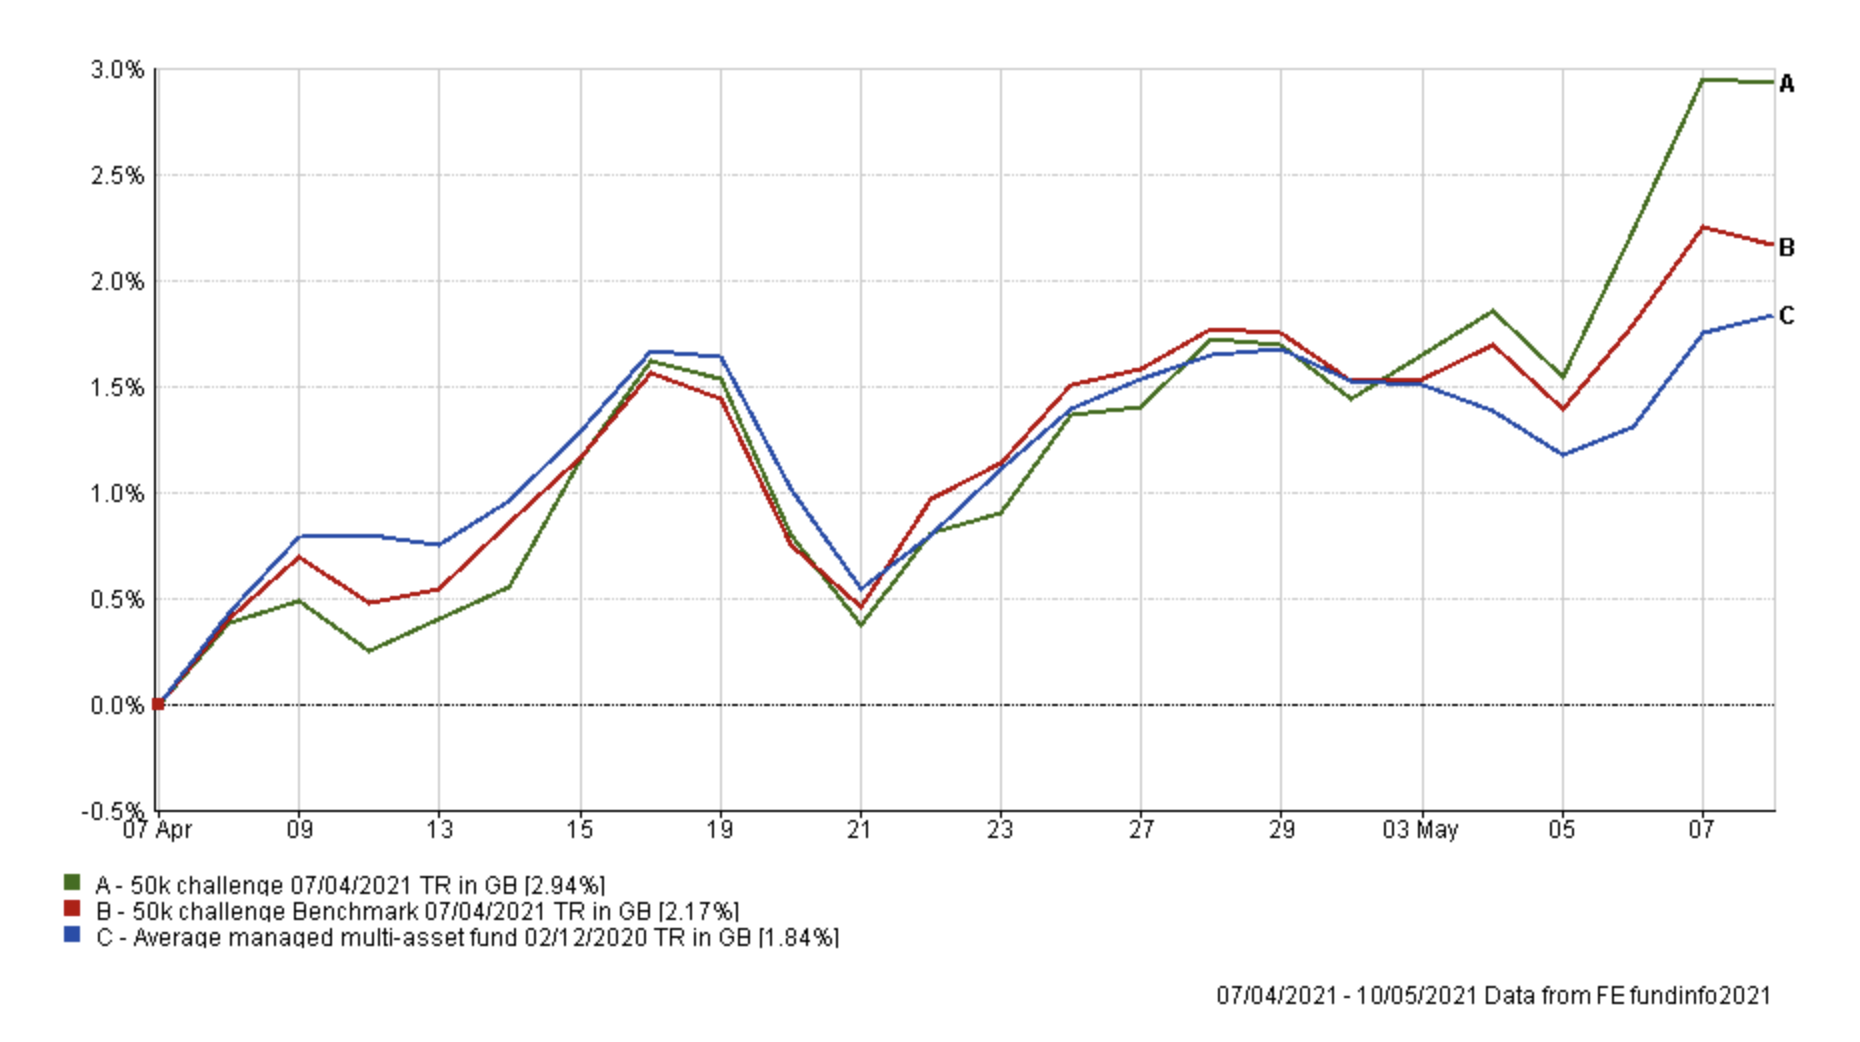
Thanks to the changes that I made last month, my £50k portfolio now sits at a new all-time high. The chart below shows the performance of my portfolio versus its benchmarks during April. As you can see my portfolio outperformed its benchmarks and remains well ahead of its benchmarks over the long term, as shown above.
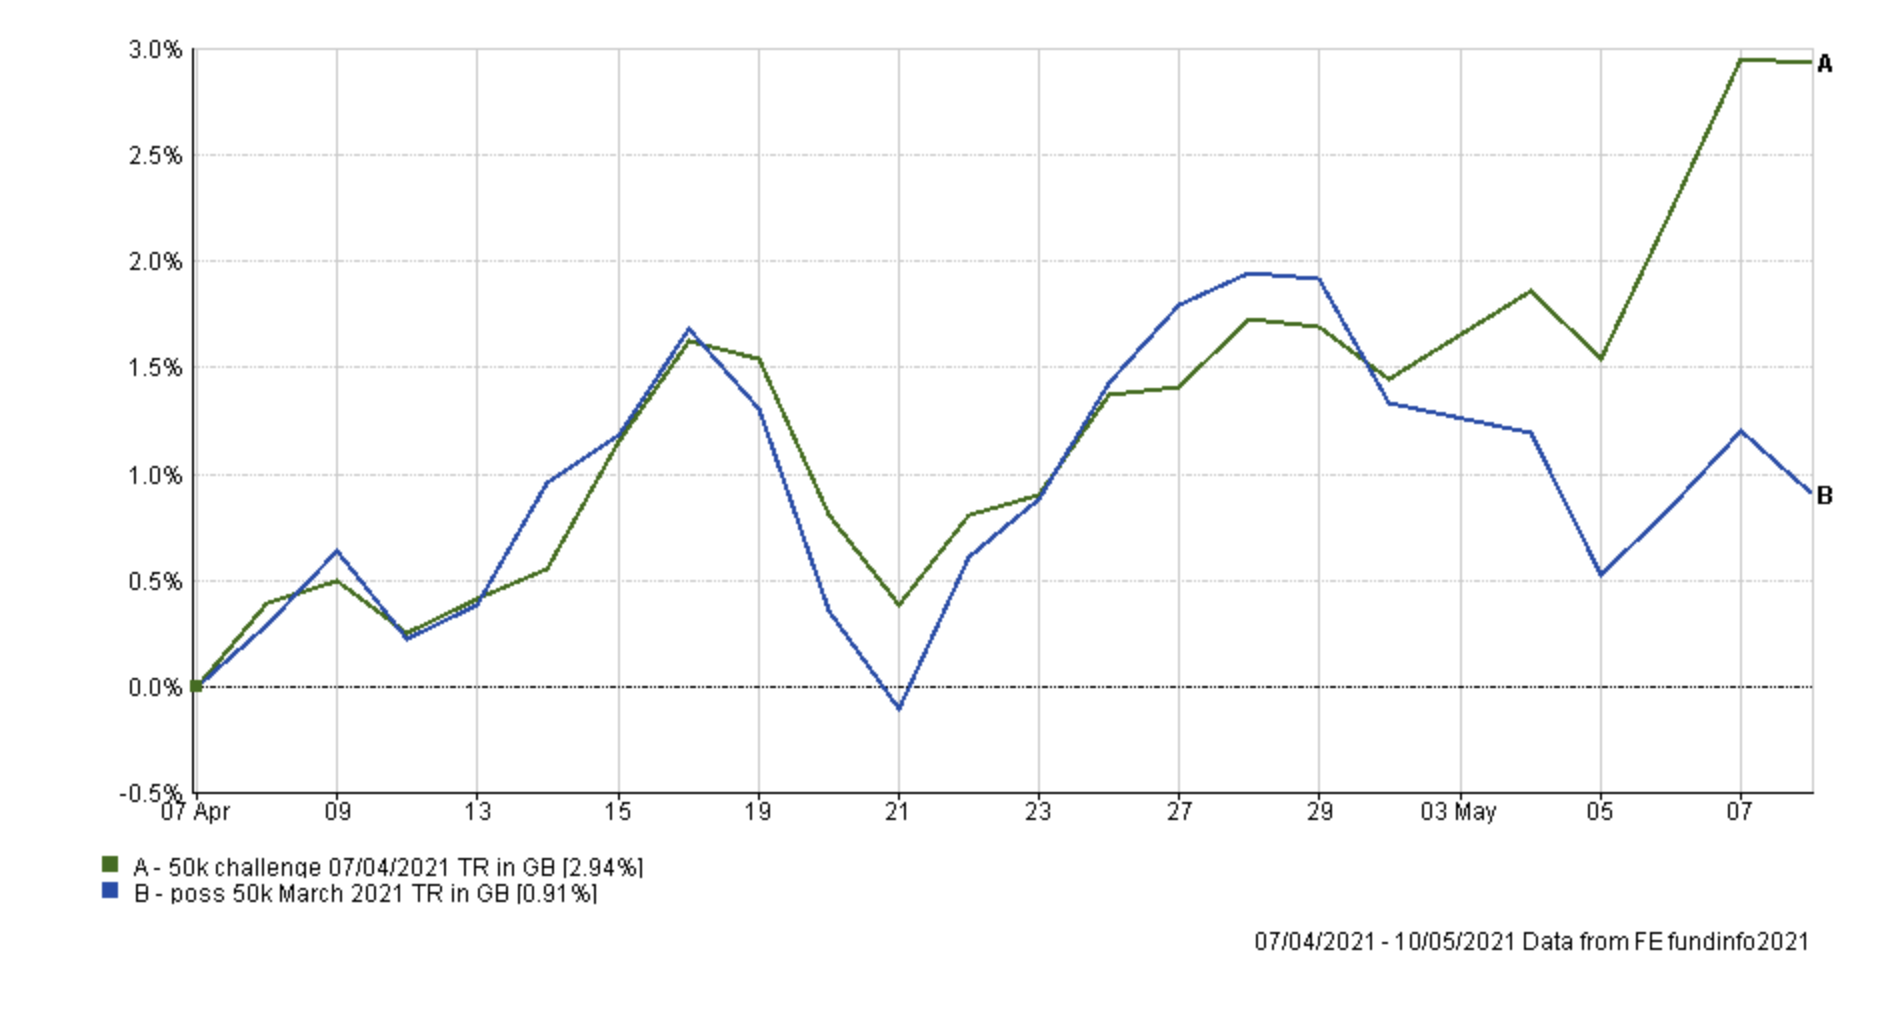
If you recall, last time I made the decision that it was time for something different and made wholesale changes to the portfolio, shifting its core from growth towards value/cyclical assets. Of course, at the time I had no way of knowing whether the reflation trade would reignite or whether it had run its course. The chart below shows the impact of the changes on my portfolio's return. The green line shows the performance of my current £50k portfolio (after the changes were made last month) while the blue line shows the performance assuming I had made no changes at all. You can see the huge difference in performance since the beginning of May when the reflation trade reignited following Janet Yellen's comments and the market's anticipation of a spike in inflation.
Indeed I received the following feedback from one 80-20 Investor via May's Chatterbox.
"As someone who tracks your 80-20 Portfolio for my pension pot, what an inspired set of fund changes last month! All of the "sold" funds have bombed, all the new ones have performed. Thanks Damien!"
When I looked more closely at the individual funds' performance numbers it turns out that the user's observation was valid. The table below shows the performance, since my last review, of the individual funds within my portfolio as well as those funds that I removed at the start of April. The funds are ranked in order of their performance since 7th April and those marked in red were the funds removed from my portfolio at the time. The fund in yellow is the one fund that I reduced my exposure to as a result of my April portfolio review while the funds in green were the new additions.
| Name | % return since last portfolio review (7th April) |
| JPM Natural Resources | 8.06 |
| Marlborough European Multi-Cap | 6.36 |
| Fidelity UK Smaller Companies | 6.3 |
| Fidelity American Special Situations | 4.6 |
| ES R&M UK Recovery | 4.29 |
| iShares Physical Gold ETC | 4.2 |
| Jupiter Income Trust | 3.7 |
| Artemis Global Growth | 3.27 |
| Schroder Global Equity Income | 2.51 |
| Premier Miton Diversified Growth | 2.11 |
| ASI Strategic Bond | 1.1 |
| Fidelity Global High Yield | 1.07 |
| Sarasin Global Dividend | 0.86 |
| Invesco Global Emerging Markets (UK) | 0.21 |
| T. Rowe Price Global Focused Growth Equity | -0.68 |
| Baillie Gifford Positive Change | -2.24 |
| VT Gravis Clean Energy Income | -2.58 |
| Allianz Total Return Asian Equity | -3.18 |
| Baillie Gifford Long Term Global Growth Investment | -3.97 |
The last month has been a great example of an occasion when a plan comes together beautifully, as I avoided the drops shown in red above while taking advantage of the acceleration in the reflation trade. But it's important to be humble. The market narrative could just as easily change tomorrow or next week and the pattern reverse. However, the table above explains why my portfolio has been propelled to a new all-time high. It is interesting to see my exposure to commodities, via JPM Natural Resources, leading the charge.
As is routine in my portfolio reviews, the table below shows which funds within my current portfolio are in the current BOTB or BFBS tables and which are not. Those funds in green are still in the BOTB while those in orange are not in the BOTB but remain in the BFBS list. Meanwhile, any funds in red have dropped out of both shortlists.
| Name | Allocation % (rounded) | Risk | Sector | ISIN Code |
| Artemis Global Growth | 5.5 | Medium | Global | GB00B2PLJP95 |
| ASI Strategic Bond | 15.5 | Low | Sterling Strategic Bond |
GB00BWK27X12
|
| ES R&M UK Recovery | 6 | Medium | UK All Companies | GB00B614J053 |
| Fidelity American Special Situations | 5 | High | North America | GB00B89ST706 |
| Fidelity Global High Yield | 8 | Low | Sterling High Yield |
GB00B7K7SQ18
|
| Fidelity UK Smaller Companies | 9 | High | UK Smaller Companies |
GB00B7VNMB18
|
| Invesco Global Emerging Markets (UK) | 7 | Medium | Global Emerging Markets |
GB00B3RW7S64
|
| iShares Physical Gold ETC | 4 | Medium | Commodity & Energy ETF | IE00B4ND3602 |
| JPM Natural Resources | 5 | High | Specialist | GB0031835118 |
| Jupiter Income Trust | 6 | Medium | UK Equity Income | GB0004791389 |
| Marlborough European Multi-Cap | 3.5 | High risk | Europe Excluding UK | GB0001719730 |
| Premier Diversified Growth | 10 | Medium | Mixed Investment 40-85% Shares | GB00B8BJV423 |
| Sarasin Global Dividend | 8.5 | Medium | Global Equity Income |
GB00BGDF8F44
|
| Schroder Global Equity Income | 7 | Medium | Global Equity Income |
GB00B76V7M69
|
As you can see every fund is either in the BOTB or the BFBS tables, with the exception of Sarasin Global Dividend. Last month I wrote at length about the Sarasin fund and why it ultimately had a stay of execution. At the time it was the one fund within my then growth-orientated portfolio that had exposure to value stocks. Yet since my last portfolio review it has been one of the more modest performers within my portfolio. But having said that it is still up 0.86% for the month, which isn't bad at all. Now ordinarily I may look to remove the fund from the portfolio but given the wholesale changes I made last month and the recent success of the portfolio, in a market where technology stocks have been crashing, I will instead keep it on the watch list with a view of removing it next time.
If you look at the asset mix of my portfolio it still resembles that of the BOTB with the largest asset exposure being to UK equities (at 23% of assets). The overall equity exposure is 62% which is almost the same as that of the BOTB. The one area where there is a notable difference is in the low risk portion of the portfolio. My portfolio has around 10% more exposure to bonds than the current BOTB, with the latter favouring a greater exposure to absolute targeted return funds. This is something to be mindful of especially if there is renewed weakness in the bond market. However, for now, ASI Strategic Bond and Fidelity Global High Yield are holding their own.
So overall I see no reason to make changes to my portfolio right now.
My portfolio
My portfolio remains unchanged:
| Name | Allocation % (rounded) | Risk | Sector | ISIN Code |
| Artemis SmartGARP Global Equity | 5.5 | Medium | Global | GB00B2PLJP95 |
| ASI Strategic Bond | 15.5 | Low | Sterling Strategic Bond |
GB00BWK27X12
|
| ES R&M UK Recovery | 6 | Medium | UK All Companies | GB00B614J053 |
| Fidelity American Special Situations | 5 | High | North America | GB00B89ST706 |
| Fidelity Global High Yield | 8 | Low | Sterling High Yield |
GB00B7K7SQ18
|
| Fidelity UK Smaller Companies | 9 | High | UK Smaller Companies |
GB00B7VNMB18
|
| Invesco Global Emerging Markets (UK) | 7 | Medium | Global Emerging Markets |
GB00B3RW7S64
|
| iShares Physical Gold ETC | 4 | Medium | Commodity & Energy ETF | IE00B4ND3602 |
| JPM Natural Resources | 5 | High | Specialist | GB0031835118 |
| Jupiter Income Trust | 6 | Medium | UK Equity Income | GB0004791389 |
| Marlborough European Multi-Cap | 3.5 | High risk | Europe Excluding UK | GB0001719730 |
| Premier Diversified Growth | 10 | Medium | Mixed Investment 40-85% Shares | GB00B8BJV423 |
| Sarasin Global Dividend | 8.5 | Medium | Global Equity Income |
GB00BGDF8F44
|
| Schroder Global Equity Income | 7 | Medium | Global Equity Income |
GB00B76V7M69
|
My Portfolio asset mix
My portfolio asset mix is as shown below which has around a 62% exposure to equities. The numbers in brackets are last month's equivalent figures.
-
- UK Equities 23% (23%)
- North American Equities 11% (11%)
- Asian/Emerging Market Equities 6% (6%)
- Japanese Equities 0% (0%)
- European Equities 5% (5%)
- Chinese equities 2% (2%)
- Other equity 9% (9%)
- Commodities and energy 9% (9%)
- UK Fixed Interest 7% (7%)
- Global Fixed Interest 15% (15%)
- Cash 5% (5%)
- Alternative Investment Strategies 8% (8%)
Damien's higher risk and lower risk portfolios
Using the logic described in my post: Update to Damien’s alternative risk portfolios I created hypothetical higher and lower risk versions of my portfolio below:
Higher risk
| Fund | Allocation % |
| Artemis SmartGARP Global Equity | 7 |
| ES R&M UK Recovery | 8 |
| Fidelity American Special Situations | 6.5 |
| Fidelity UK Smaller Companies | 12 |
| Invesco Global Emerging Markets (UK) | 9 |
| iShares Physical Gold ETC | 5 |
| JPM Natural Resources | 6.5 |
| Jupiter Income Trust | 8 |
| Marlborough European Multi-Cap | 5 |
| Premier Diversified Growth | 13 |
| Sarasin Global Dividend | 11 |
| Schroder Global Equity Income | 9 |
Lower risk
| Fund | Allocation % |
| Artemis SmartGARP Global Equity | 7 |
| ASI Strategic Bond | 20 |
| ES R&M UK Recovery | 8 |
| Fidelity Global High Yield | 10 |
| Invesco Global Emerging Markets (UK) | 9 |
| iShares Physical Gold ETC | 5 |
| Jupiter Income Trust | 8 |
| Premier Diversified Growth | 13 |
| Sarasin Global Dividend | 11 |
| Schroder Global Equity Income | 9 |

£200 Pension Cashback Offer
Make a qualifying deposit or transfer a pension to our partner Interactive Investor.
- Deposit or transfer a pension of at least £20k and you could earn £200 cashback
- Terms and Fees apply, Capital at risk
- New & Existing customers opening a SIPP
- Offer ends 31st July 2026
Before starting your transfer, check you won't lose any valuable benefits (such as guaranteed annuity rates or a lower protected pension age) and find out what exit fees you might have to pay
