

The background to my portfolio
Back in March 2015 I decided to invest £50,000 of my own money using 80-20 Investor. The purpose was twofold, firstly to show how you can use 80-20 Investor to invest and outperform the market with only a few minutes effort every now and then. Secondly, no other investment commentator, journalist or research provider invests their own money for fear of failing. This is a sorry state of affairs and is precisely why I committed to openly running my own portfolio for 80-20 Investor members to see.
Since then I have periodically changed my portfolio using the fund suggestions provided by the 80-20 Investor algorithm and associated research. I always disclose the changes at the time they are made.
Performance update
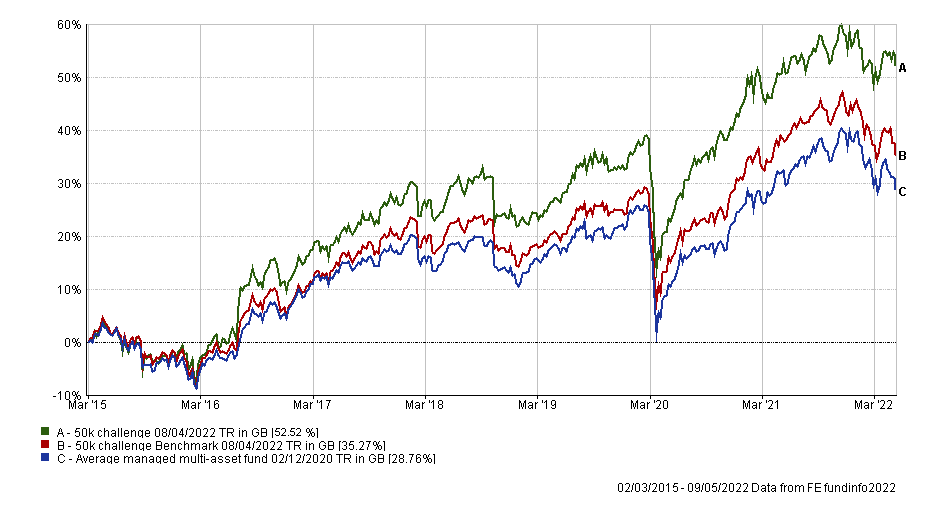
As is usual in my portfolio reviews, the chart below shows how my portfolio has outperformed since I started the challenge in March 2015, which is over seven years ago. The green line is the performance of my portfolio while the red line is the benchmark showing the average return achieved by professional fund managers given the same asset mix. To accurately calculate this I have used the average return for each sector in which my portfolio invested. The blue line shows what the average multi-asset fund with comparable equity content achieved. In other words, the red line would show the extra performance added by just the asset mix of my portfolio (where I was invested i.e European equities etc) over picking a typical multi-asset fund (the blue line). While the green line (which is my actual performance) shows the impact of being in the right funds at the right time, as identified by the 80-20 Investor algorithm.
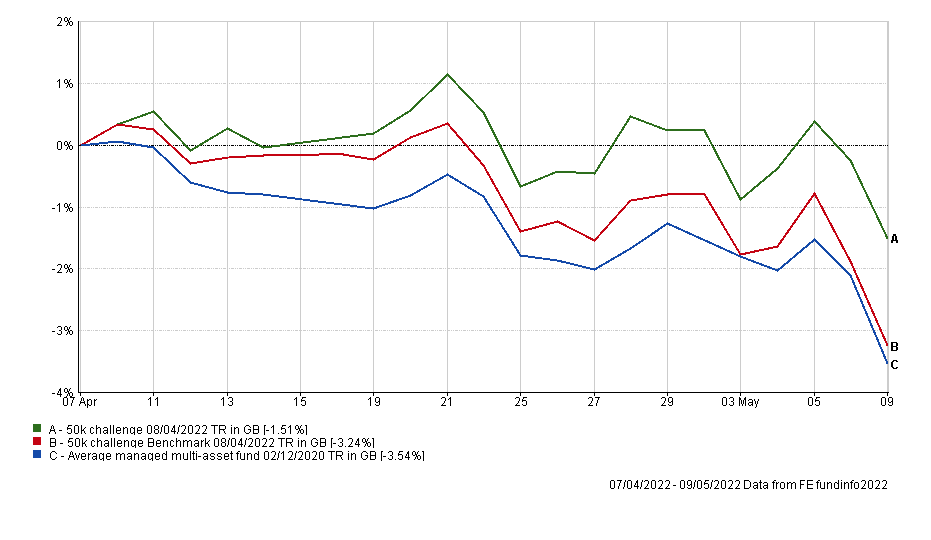
As you can see, during a month where equity markets were hammered, particularly the S&P 500 which fell 8.8% during April it's fantastic to see that my £50k portfolio significantly extended its lead over its benchmarks. The chart below shows how my portfolio performed versus its benchmarks since my last review, benefiting from its multi-asset approach.
The table below shows the individual performance of each holding in my portfolio since my last review a month ago. As you can see gold was the strongest performer as stock markets faltered. The table rankings are almost the exact inverse of what we saw in March when equities outperformed while safer assets lagged.
| Fund/asset | 1 month % return |
| Gold | 2.24 |
| Premier Miton Defensive Growth | 1.49 |
| Fidelity American Special Situations | 0.75 |
| BlackRock Natural Resources Growth & Income | 0.73 |
| Thesis TM Tellworth UK Select | 0.51 |
| Cash | 0 |
| M&G Global Dividend | -1.18 |
| Troy Asset Management Ltd Trojan Ethical | -1.6 |
| BM SVS Brooks Macdonald Defensive Capital | -1.86 |
| Invesco UK Opportunities (UK | -3.22 |
| Invesco High Yield (UK) | -3.86 |
| Fidelity Index US | -4.43 |
| Fidelity Global Property | -5.8 |
Interestingly cash proved a useful asset in a time when bonds and equities continued to fall in tandem, as they have done for most of 2022. That was something that was highlighted as likely to happen in my article "The diversification dilemma - when bonds and equities fall together".
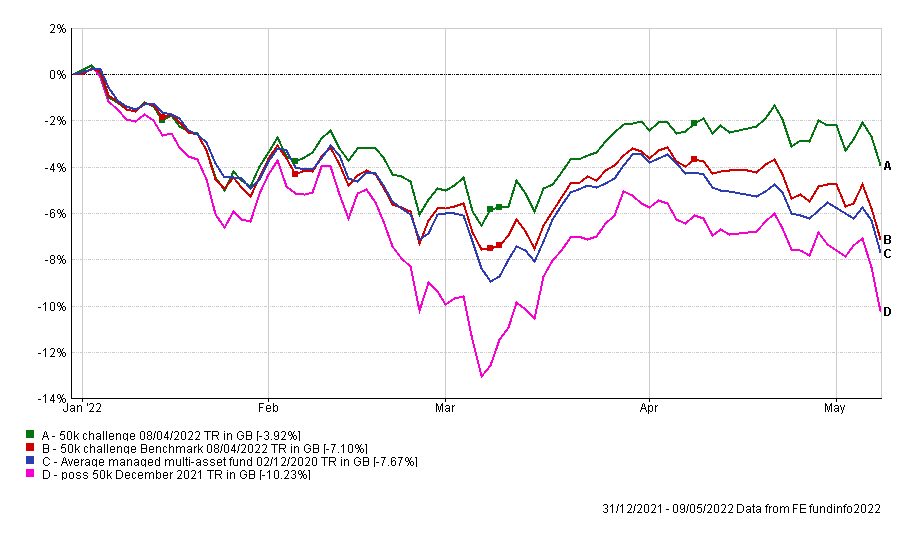
The chart below shows the outperformance of my portfolio since the start of the year versus its benchmarks. It shows that being in the right assets (not just bonds and equities) has helped buoy performance, but also being in the right sectors within asset classes (such as energy and oil stocks) has helped too.
As usual, the table below shows which funds within my portfolio are in the current BOTB or BFBS tables and which are not. Those funds in green are still in the BOTB while those in orange are not in the BOTB but remain in the BFBS list. Meanwhile, any funds in red have dropped out of both shortlists.
| Name | Allocation % (rounded) | Risk | Sector | ISIN Code |
| BlackRock Natural Resources Growth & Income | 6% | High | Commodity/Natural Resource | GB00B6865B79 |
| BM SVS Brooks Macdonald Defensive Capital | 10% | Low | Targeted Absolute Return | GB00B61MR835 |
| Cash | 3% | Low | ||
| Fidelity American Special Situations | 8% | Medium | North America | GB00B89ST706 |
| Fidelity Global Property | 8.5% | High | Property Other | GB00B7K2NZ09 |
| Fidelity Index US | 11% | High | North America | GB00BJS8SH10 |
| Invesco High Yield (UK) | 7.5% | Low | Sterling High Yield | GB00B3RW7649 |
| Invesco UK Opportunities (UK) | 7.5% | Medium | UK All Companies | GB00B1W7HM62 |
| iShares Physical Gold ETC | 5% | Medium | Commodity & Energy ETF | IE00B4ND3602 |
| M&G Global Dividend | 9% | Medium | Global | GB00B46J9127 |
| Premier Miton Defensive Growth | 11.5% | Low | Targeted Absolute Return | GB00B832BD89 |
| Thesis TM Tellworth UK Select | 5% | Low | Targeted Absolute Return | GB00BNY7YM73 |
| Troy Asset Management Ltd Trojan Ethical | 8% | Low | Flexible Investment | GB00BJP0XX17 |
Once again nearly all of the funds within my portfolio are still in the BOTB or BFBS tables. Fidelity Global Property returned to the BOTB on the back of its recent strong performance, despite having a mixed month. Also, it is interesting to see Troy Asset Management Ltd Trojan Ethical re-enter the BOTB partly on account of its exposure to gold. It means that there are now only two funds that have fallen outside of the BOTB and BFBS which are highlighted in red above. These are:
- Invesco High Yield (UK)
- Fidelity US Index
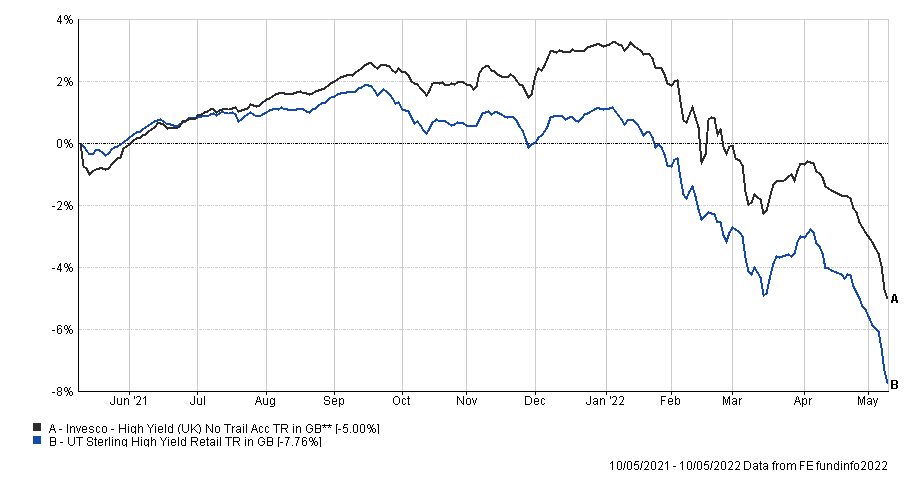
The latter is a direct result of it essentially tracking the S&P 500 which had a tough month versus other global equity markets. But once again Invesco High Yield is on the watchlist so I am going to reduce my exposure by 50% and move the proceeds into cash - until such time as a better opportunity (perhaps in the bond space) comes along. The reason that I have decided to reduce exposure this time is that the fortunes of the fund have tumbled in the last month - as shown in the chart below. A month ago the fund was holding up relatively well versus its peers. That clearly is no longer the case and the fund has been one of the portfolio's worst performers for a number of months.
Now of course the risks are that bonds could suddenly rally as inflation fears subside and fears of a recession increase. My portfolio has limited exposure to bonds - which is one of the reasons why it has outperformed - but also has exposure to gold and other commodities. If we have a global economic growth shock then bonds could rally strongly, while equity markets could fall along with commodities. That would be negative for my portfolio. So while my portfolio is outperforming significantly right now I am humble enough to realise that could change if the market narrative suddenly pivots. It may therefore seem odd that I am trimming my bond exposure further but the fortunes of high yield bonds are often more closely linked to those of equities anyway.
The performance of the portfolio, and the level of volatility in the market (both bonds and equities) at the moment, mean that I don't want to make more radical changes to the portfolio - hence why I'm leaving the Fidelity Index US in my portfolio for now. It still remains true that if my portfolio was to reside in the Mixed Investment 40-85% Shares sector of professionally managed funds it would be ranked in the top quartile for Alpha and Sharpe ratios since the portfolio's inception 7 years ago. Not only that but it would also now rank in the top quartile for performance too (despite its relatively modest equity exposure).
Just as a reminder, Alpha is a figure which measures a manager’s apparent skill at picking winning investments versus their benchmark. Alpha is the excess return versus the return of a fund’s benchmark (i.e the market). So a fund with a positive alpha indicates that the fund manager has outperformed through skill. While a negative alpha figure would indicate underperformance.
The Sharpe ratio is not a widely known statistic yet it indicates how much extra return a fund manager has achieved for the increased risk they have taken. There is nothing wrong with fund managers taking calculated investment risks if they result in additional returns for investors. So the higher a fund’s Sharpe ratio the better.
Performing so well for these metrics is great and further confirms that continuing to manage risk and managing the portfolio in the current style is prudent.
Fund switches
The fund switch below keeps my portfolio broadly in line with the BOTB, in terms of total equity exposure and asset mix.
- 50% out of Invesco High Yield (UK) and 100% into Cash
Overall it means that the equity exposure within my portfolio still sits around 60% while the change only affects 3.5% of my portfolio.
My portfolio
My portfolio now looks like this:
| Name | Allocation % (rounded) | Risk | Sector | ISIN Code |
| BlackRock Natural Resources Growth & Income | 6% | High | Commodity/Natural Resource | GB00B6865B79 |
| BM SVS Brooks Macdonald Defensive Capital | 10% | Low | Targeted Absolute Return | GB00B61MR835 |
| Cash | 6.5% | Low | ||
| Fidelity American Special Situations | 8.5% | Medium | North America | GB00B89ST706 |
| Fidelity Global Property | 8% | High | Property Other | GB00B7K2NZ09 |
| Fidelity Index US | 11% | High | North America | GB00BJS8SH10 |
| Invesco High Yield (UK) | 3.5% | Low | Sterling High Yield | GB00B3RW7649 |
| Invesco UK Opportunities (UK) | 7.5% | Medium | UK All Companies | GB00B1W7HM62 |
| iShares Physical Gold ETC | 5% | Medium | Commodity & Energy ETF | IE00B4ND3602 |
| M&G Global Dividend | 9% | Medium | Global | GB00B46J9127 |
| Premier Miton Defensive Growth | 12% | Low | Targeted Absolute Return | GB00B832BD89 |
| Thesis TM Tellworth UK Select | 5% | Low | Targeted Absolute Return | GB00BNY7YM73 |
| Troy Asset Management Ltd Trojan Ethical | 8% | Low | Flexible Investment | GB00BJP0XX17 |
My Portfolio asset mix
My portfolio asset mix now sits around 60% exposure to equities. Last month's figures are shown in brackets. You will notice a slight increase in US and European equities as a result of the clarification by a number of funds as to where some of their assets are held, rather than lumping them into "Other equities".
-
- UK Equities 13% (13%)
- North American Equities 19% (17%)
- Asian/Emerging Market Equities 0% (0%)
- Japanese Equities 0% (0%)
- European Equities 2% (0%)
- Chinese equities 0% (0%)
- Other equity 9% (13%)
- Commodities and energy 15% (15%)
- UK Fixed Interest 0% (0%)
- Global Fixed Interest 8% (11%)
- Cash 6% (3%)
- Alternative Investment Strategies 20% (20%)
- Property 8% (8%)
Damien's higher risk and lower risk portfolios
Using the logic described in my post: Update to Damien’s alternative risk portfolios I created hypothetical higher and lower risk versions of my portfolio below:
Lower risk
| Fund | Allocation % |
| Fidelity American Special Situations | 11 |
| Invesco High Yield (UK) | 5 |
| Invesco UK Opportunities (UK) | 10 |
| iShares Physical Gold ETC | 7 |
| Premier Miton Defensive Growth | 16 |
| M&G Global Dividend | 12 |
| BM SVS Brooks Macdonald Defensive Capital | 13 |
| Thesis TM Tellworth UK Select | 7 |
| Troy Asset Management Ltd Trojan Ethical | 11 |
| Cash | 8 |
Higher risk
| Fund | Allocation % |
| BlackRock Natural Resources Growth & Income | 11 |
| Fidelity American Special Situations | 15 |
| Fidelity Global Property | 15 |
| Fidelity US Index | 20 |
| Invesco UK Opportunities (UK) | 14 |
| iShares Physical Gold ETC | 9 |
| M&G Global Dividend | 16 |

£200 Pension Cashback Offer
Make a qualifying deposit or transfer a pension to our partner Interactive Investor.
- Deposit or transfer a pension of at least £20k and you could earn £200 cashback
- Terms and Fees apply, Capital at risk
- New & Existing customers opening a SIPP
- Offer ends 31st July 2026
Before starting your transfer, check you won't lose any valuable benefits (such as guaranteed annuity rates or a lower protected pension age) and find out what exit fees you might have to pay
