

The background to my portfolio
Back in March 2015 I decided to invest £50,000 of my own money using 80-20 Investor. The purpose was twofold, firstly to show how you can use 80-20 Investor to invest and outperform the market with only a few minutes effort every now and then. Secondly, no other investment commentator, journalist or research provider invests their own money for fear of failing. This is a sorry state of affairs and is precisely why I committed to openly running my own portfolio for 80-20 Investor members to see.
Since then I have periodically changed my portfolio using the fund suggestions provided by the 80-20 Investor algorithm and associated research. I always disclose the changes at the time they are made.
Performance update
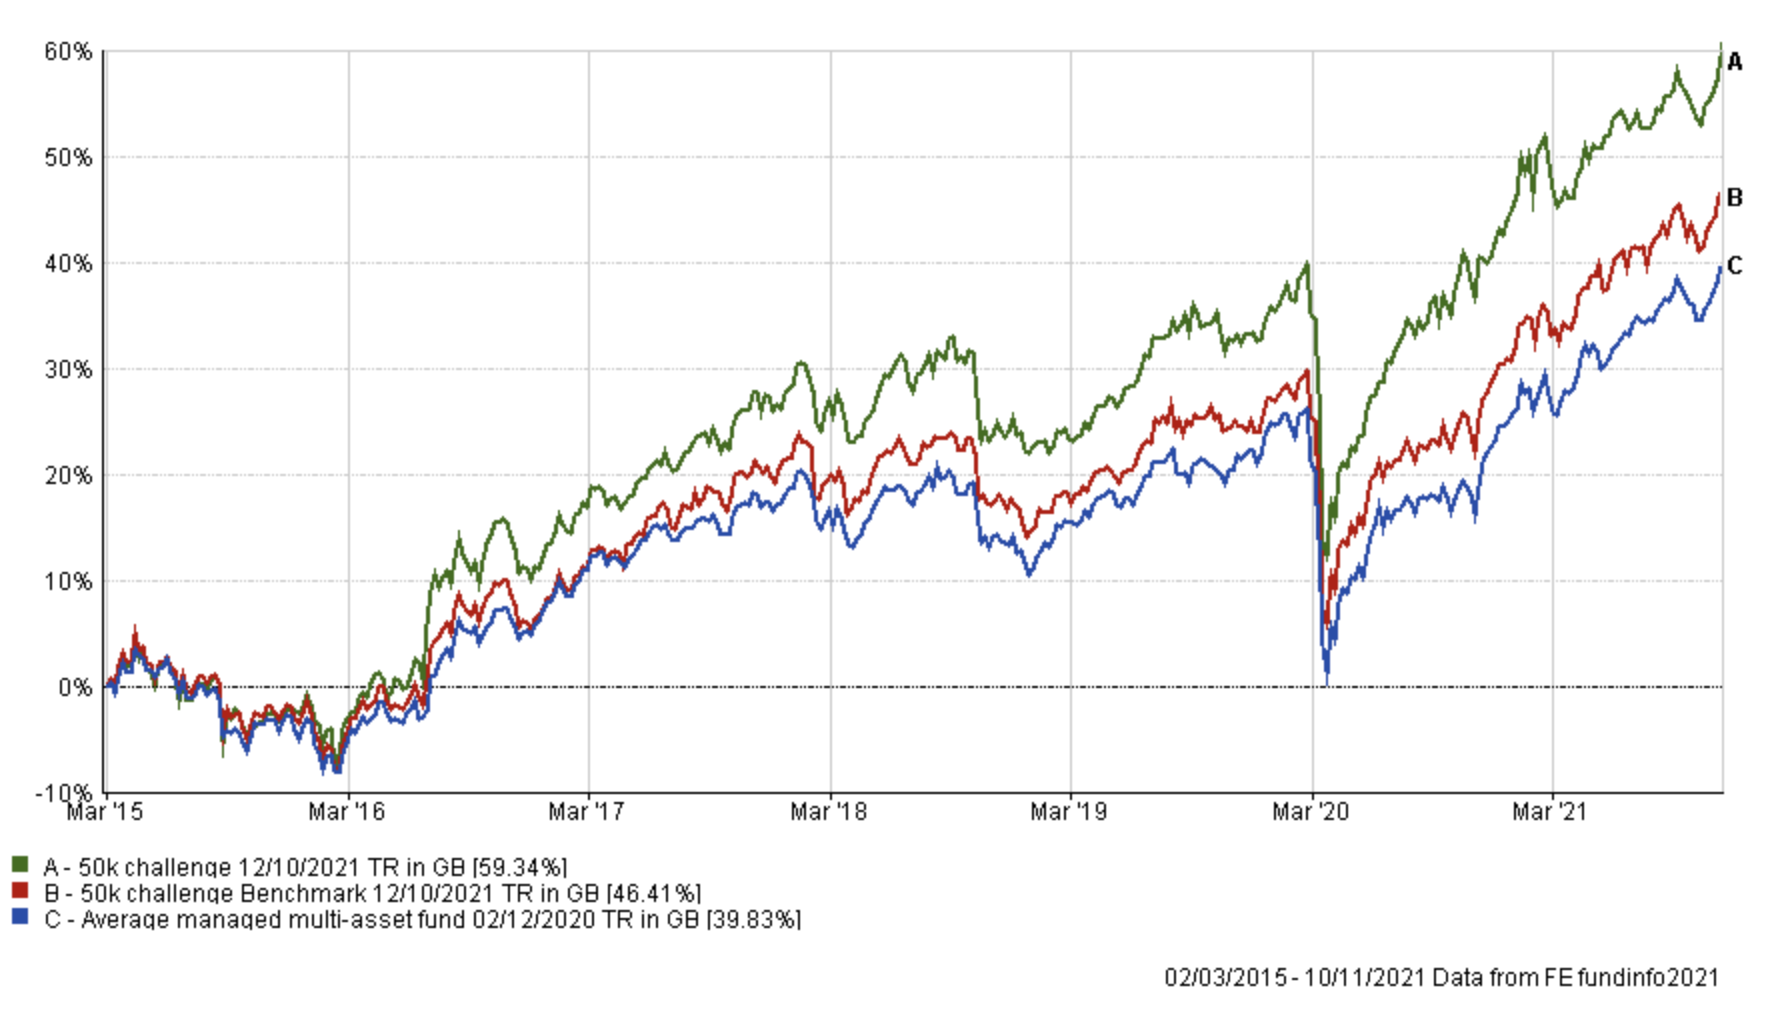
As is usual in my portfolio reviews, the chart below shows how my portfolio has outperformed since I started the challenge in March 2015, which is over six years ago. The green line is the performance of my portfolio while the red line is the benchmark showing the average return achieved by professional fund managers given the same asset mix. To accurately calculate this I have used the average return for each sector in which my portfolio invested. The blue line shows what the average multi-asset fund with comparable equity content achieved. In other words, the red line would show the extra performance added by just the asset mix of my portfolio (where I was invested i.e European equities etc) over picking a typical multi-asset fund (the blue line). While the green line (which is my actual performance) shows the impact of being in the right funds at the right time, as identified by the 80-20 Investor algorithm.
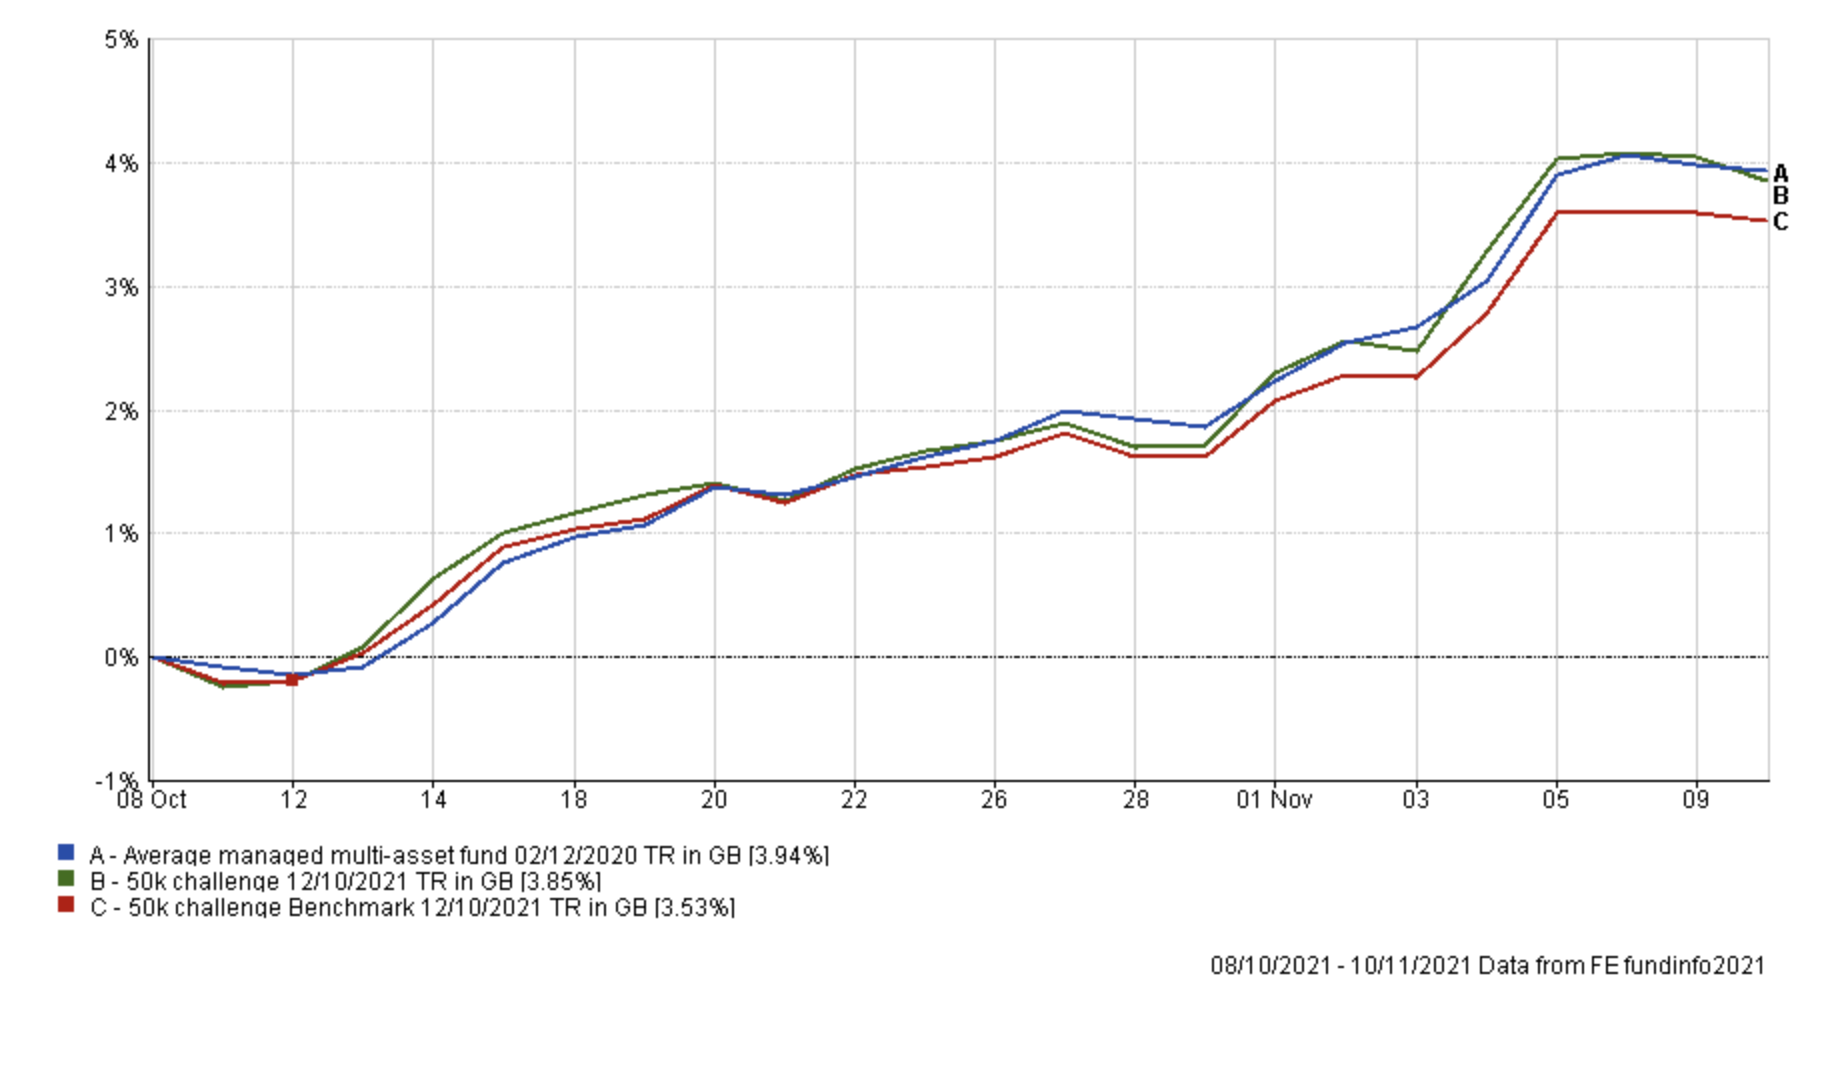
My £50k portfolio now sits at a new all-time high, after rallying more than 5% from its October low, and continues to outpace its benchmarks. The chart below shows how my portfolio performed versus its benchmarks during the last month (and since my last review).
Obviously, I am pleased with such a strong performance during such a volatile month which saw bond yields rally, before ultimately moving lower. This flip-flopping in bond markets led a lot of investors to end up chasing their tails. You can also see how volatility in bond markets had an impact on the performance of individual funds within my portfolio this month. The table below shows the performance of each fund within my portfolio since my review on 8th October.
| Fund | % return 8th October to 10th Nov |
| SVS Sanlam North American Equity | 7.78 |
| Marlborough European Multi-Cap | 6.89 |
| iShares Physical Gold ETC | 6.12 |
| Fundsmith Equity | 5.33 |
| Fidelity Global Property | 5.28 |
| Fidelity Emerging Europe Middle East and Africa | 4.87 |
| Premier Miton Diversified Growth | 4.58 |
| Wise Funds Limited TB Wise Multi-Asset Growth | 3.93 |
| BM Brooks Macdonald Defensive Capital | 3.04 |
| Fidelity UK Smaller Companies | 2.08 |
| Slater Recovery | 1.87 |
| Invesco High Yield (UK) | 0.55 |
| ASI Strategic Bond | -0.41 |
Firstly it's great to see newcomer SVS Sanlam North American Equity performing so strongly. Ironically, because we saw a pullback in yields (so bond prices rose) during the period, those funds that perform best in a low/falling rate environment outperformed. Namely, my holdings in gold, Fundsmith Equity, Fidelity Global Property and to a certain extent Premier Miton Diversified Growth. It highlights one of the benefits of dripping out of existing holdings when making changes, as the market can surprise you and can limit you chasing your tail. If you recall I dripped out of Fidelity Global Property and Premier Miton Diversified Growth last time as I adjusted my portfolio for the potential of higher bond yields.
As usual, the table below shows which funds within my current portfolio are in the current BOTB or BFBS tables and which are not. Those funds in green are still in the BOTB while those in orange are not in the BOTB but remain in the BFBS list. Meanwhile, any funds in red have dropped out of both shortlists.
| Name | Allocation % (rounded) | Risk | Sector | ISIN Code |
| ASI Strategic Bond | 10 | Low | Sterling Strategic Bond |
GB00BWK27X12
|
| BM Brooks Macdonald Defensive Capital | 5 | Low | Targeted Absolute Return |
GB00B61MR835
|
| Fidelity Emerging Europe Middle East and Africa | 9 | High | Specialist | GB00B87Z7808 |
| Fidelity Global Property | 5 | Medium | Property Other | GB00B7K2NZ09 |
| Fidelity UK Smaller Companies | 10 | High | UK Smaller Companies |
GB00B7VNMB18
|
| Fundsmith Equity | 7.5 | Medium | Global |
GB00B4Q5X527
|
| Invesco High Yield (UK) | 8 | Low | Sterling High Yield | GB00B3RW7649 |
| iShares Physical Gold ETC | 4 | Medium | Commodity & Energy ETF | IE00B4ND3602 |
| Marlborough European Multi-Cap | 6 | High | Europe Excluding UK | GB0001719730 |
| Premier Diversified Growth | 10.5 | Medium | Mixed Investment 40-85% Shares | GB00B8BJV423 |
| Slater Recovery | 6 | Medium | UK All Companies | GB0031554248 |
| SVS Sanlam North American Equity | 10.5 | Medium | North America | GB0007655698 |
| Wise Multi-Asset Growth | 8.5 | Medium | Flexible Investment | GB0034272533 |
The first thing to point out is that a number of funds have fallen out of the BOTB and BFBS and these are:
- Premier Diversified Growth
- Wise Multi-Asset Growth
- Slater Recovery
- Fundsmith Equity
- ASI Strategic Bond
The other funds within my portfolio are either still in the BOTB or BFBS tables. Given the performance of the portfolio, there is no need for drastic changes and in an environment prone to rotations (favouring a particular fund/asset one minute and then not the next minute) it pays to continue to diversify the portfolio gradually, still aiming to improve the resilience of the portfolio in an environment of higher inflation and possibly higher bond yields.
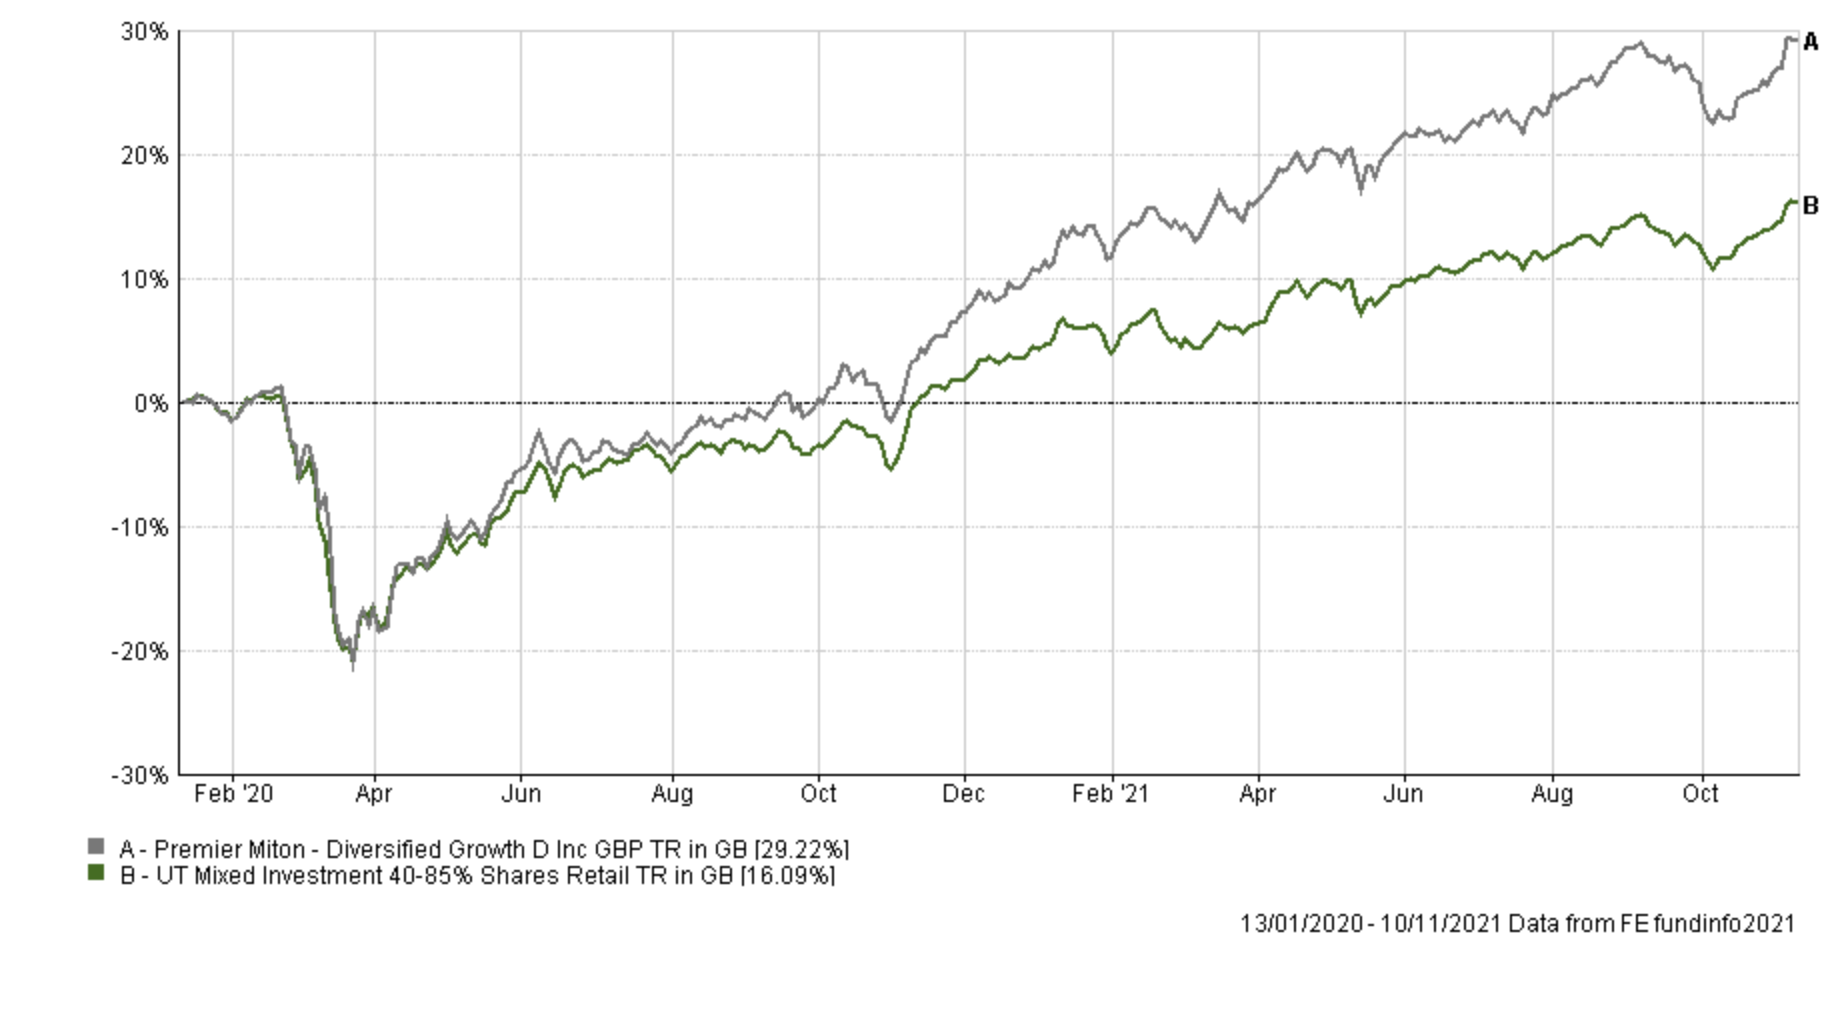
So dealing with each of the funds listed above, none of them have become bad funds overnight as emphasised by the performance table earlier. Premier Diversified Growth has been a strong performer in the portfolio as shown in the chart below but in continuing my work of diversifying my portfolio for the possibility of higher bond yields I plan to reduce my exposure to the fund further this month.
Fundsmith Equity has performed strongly in recent weeks and remains a positive contributor to the portfolio (as shown in the earlier table) despite it falling out of the BOTB and BFBS tables. This is largely due to the fall in bond yields we saw, as prior to that the fund had been showing signs of fatigue (see last month's review). Its resurgence means that the fund was in the BFBS tables as recently as a month ago, so on that basis I plan to simply reduce my exposure to the fund for now, rather than remove it completely, and keep a watching brief on my remaining exposure.
ASI Strategic Bond has been fairly lacklustre in its performance over the last few months, propping up the performance chart earlier. I had already begun reducing my exposure to the fund previously and I now plan to complete that process this month.
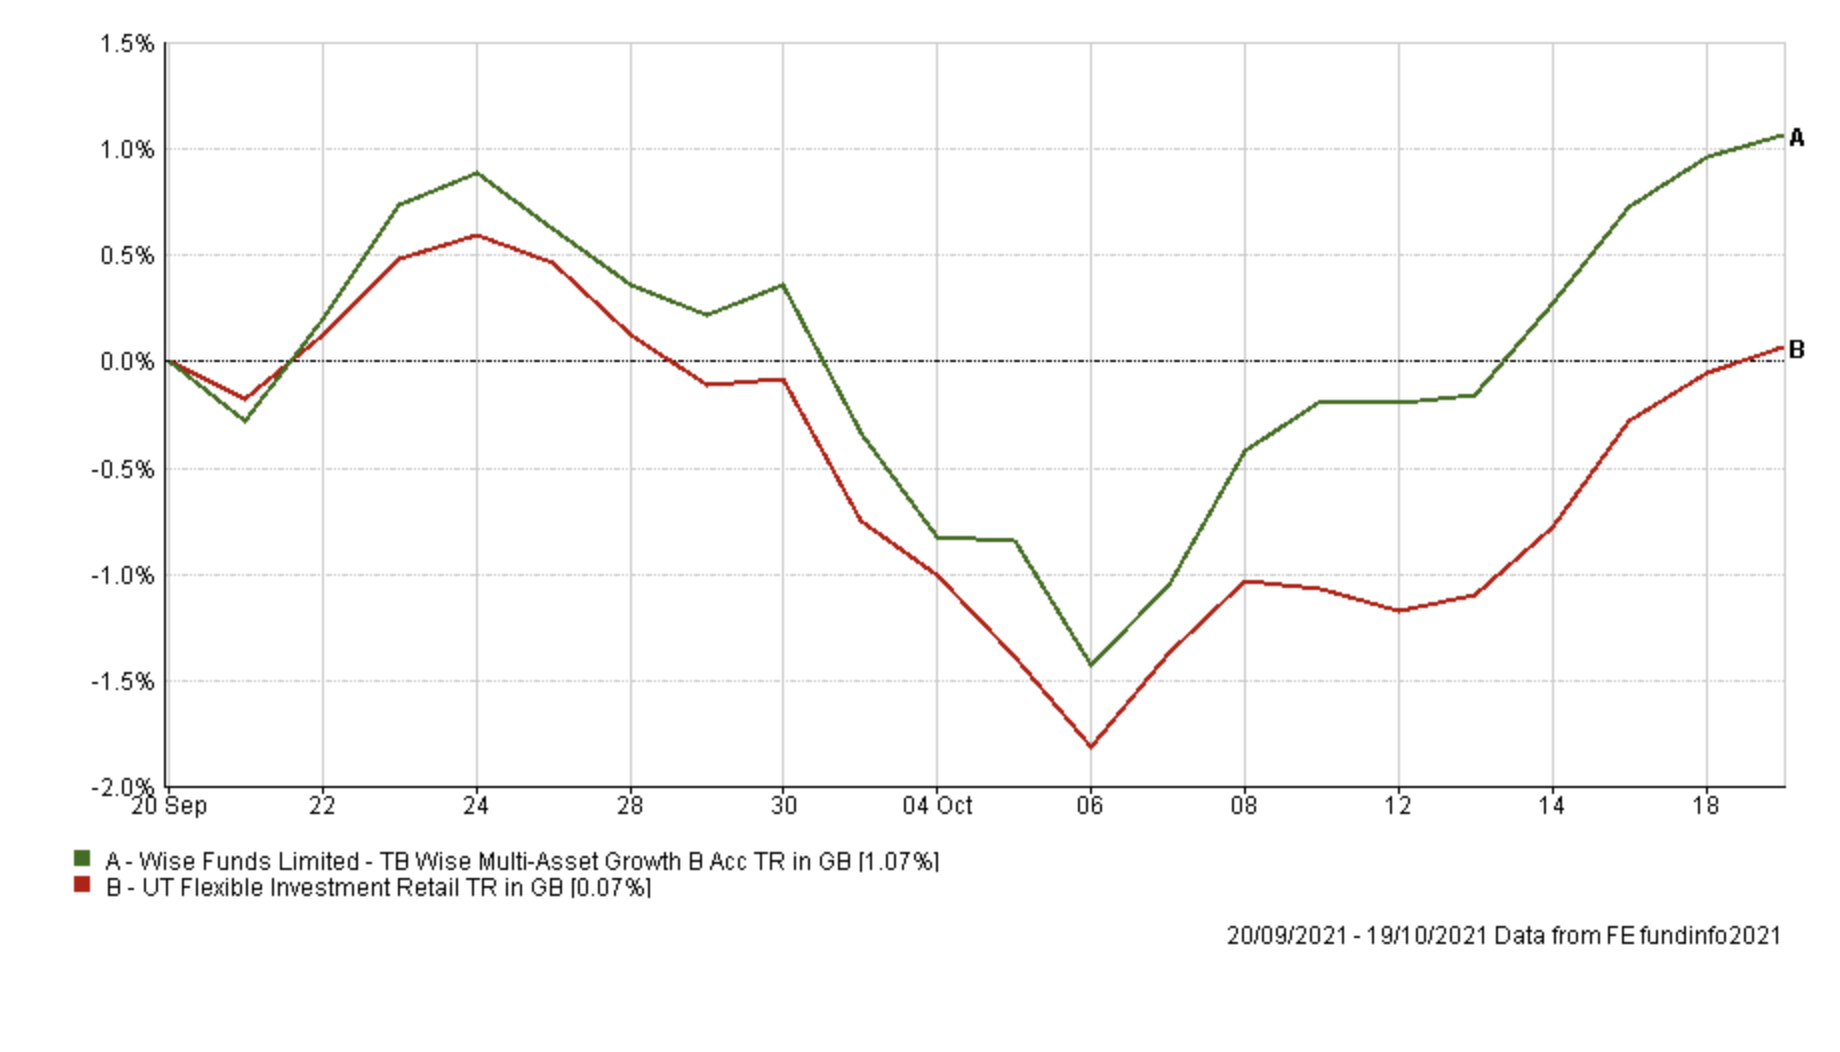
Slater Recovery has been a regular in the BOTB and BFBS in recent months. Therefore I don't plan to completely remove it from my portfolio just yet, however, I favour reducing my exposure to bring my portfolio's overall UK equity exposure more in line with that of the BOTB. Furthermore, this fund has tended to perform well when bond yields are rising so it remains a good diversifier to those other holdings in my portfolio that tend to perform better in a falling bond yield environment. The same can be said for Wise Multi-Asset Growth. When deciding on the funds to replace or invest in this month I have been mindful of my recent research on 'Lower risk funds for a bond market sell-off'. In the case of medium risk funds I have taken the same time frames used in that research piece and applied them when looking at medium and high-risk funds.
For example, you can see from the chart below how Wise Multi-Asset Growth outperformed its peers during the rate rise phase used in the aforementioned research.
Fund switches
The fund switches below bring my portfolio in line with the BOTB a bit more, especially in terms of UK equity exposure. The changes only affect around 18% of my portfolio (of which only 8% relates to equity-based funds), which is deliberate given the amount of market volatility we are experiencing. The aim remains to diversify my portfolio further (in terms of equity style) and increase exposure to funds that have fared better in this uncertain bond yield environment. In doing so I have favoured backing existing 'winners within my portfolio (namely BM Brooks Macdonald Defensive Capital & Marlborough European Multi-Cap) while introducing direct commodity exposure once again into the portfolio, via BlackRock Natural Resources Growth & Income which is in the BOTB. The fund switches I have made this time are:
- 100% out of ASI Strategic Bond and 100% into BM Brooks Macdonald Defensive Capital
- 25% out of Fundsmith Equity and 100% into BlackRock Natural Resources Growth & Income
- 50% out of Slater Recovery and 100% into BlackRock Natural Resources Growth & Income
- 33.33% out of Premier Diversified Growth and 100% into Marlborough European Multi-Cap
Overall it means that the equity exposure within my portfolio has risen slightly to 67%, up from 65%, while the number of holdings has remained the same.
My portfolio
My portfolio now looks like this:
| Name | Allocation % (rounded) | Risk | Sector | ISIN Code |
| BM Brooks Macdonald Defensive Capital | 14.5 | Low | Targeted Absolute Return | GB00B61MR835 |
| Fidelity Emerging Europe Middle East and Africa | 9 | High | Specialist | GB00B87Z7808 |
| Fidelity Global Property | 5 | Medium | Property Other | GB00B7K2NZ09 |
| Fidelity UK Smaller Companies | 10 | High | UK Smaller Companies | GB00B7VNMB18 |
| Fundsmith Equity | 5.5 | Medium | Global | GB00B4Q5X527 |
| iShares Physical Gold ETC | 4 | Medium | Commodity & Energy ETF | IE00B4ND3602 |
| Marlborough European Multi-Cap | 10 | High | Europe Excluding UK | GB0001719730 |
| Premier Miton Diversified Growth | 7 | Medium | Mixed Investment 40-85% Shares | GB00B8BJV423 |
| Slater Recovery | 3 | Medium | UK All Companies | GB0031554248 |
| Wise Multi-Asset Growth | 8.5 | Medium | Flexible Investment | GB0034272533 |
| Invesco High Yield (UK) | 7.5 | Low | Sterling High Yield | GB00B3RW7649 |
| SVS Sanlam North American Equity | 11 | Medium | North America | GB0007655698 |
| BlackRock Natural Resources Growth & Income | 5 | High | Commodity/Natural Resource | GB00B6865B79 |
My Portfolio asset mix
My portfolio asset mix is now as shown below which has around 67% exposure to equities, up slightly from 65% last month. Last month's figures are shown in brackets
-
- UK Equities 14% (20%)
- North American Equities 18% (19%)
- Asian/Emerging Market Equities 9% (9%)
- Japanese Equities 0% (0%)
- European Equities 9% (6%)
- Chinese equities 0% (0%)
- Other equity 7% (5%)
- Commodities and energy 11% (5%)
- UK Fixed Interest 0% (3%)
- Global Fixed Interest 13% (14%)
- Cash 3% (5%)
- Alternative Investment Strategies 11% (8%)
- Property 5% (6%)
Damien's higher risk and lower risk portfolios
Using the logic described in my post: Update to Damien’s alternative risk portfolios I created hypothetical higher and lower risk versions of my portfolio below:
Lower risk
| Fund | Allocation % |
| BM Brooks Macdonald Defensive Capital | 22 |
| Fidelity Global Property | 8 |
| Fundsmith Equity | 8 |
| Invesco High Yield (UK) | 11 |
| iShares Physical Gold ETC | 6 |
| Premier Miton Diversified Growth | 10 |
| Slater Recovery | 5 |
| SVS Sanlam North American Equity | 17 |
| Wise Multi-Asset Growth | 13 |
Higher risk
| Fund | Allocation % |
| Fidelity Emerging Europe Middle East and Africa | 12 |
| Fidelity Global Property | 6 |
| Fidelity UK Smaller Companies | 13 |
| Fundsmith Equity | 7 |
| iShares Physical Gold ETC | 5 |
| Marlborough European Multi-Cap | 13 |
| Premier Miton Diversified Growth | 9 |
| Slater Recovery | 4 |
| Wise Multi-Asset Growth | 11 |
| SVS Sanlam North American Equity | 14 |
| BlackRock Natural Resources Growth & Income | 6 |

£200 Pension Cashback Offer
Make a qualifying deposit or transfer a pension to our partner Interactive Investor.
- Deposit or transfer a pension of at least £20k and you could earn £200 cashback
- Terms and Fees apply, Capital at risk
- New & Existing customers opening a SIPP
- Offer ends 31st July 2026
Before starting your transfer, check you won't lose any valuable benefits (such as guaranteed annuity rates or a lower protected pension age) and find out what exit fees you might have to pay
