

The background to my portfolio
Back in March 2015 I decided to invest £50,000 of my own money using 80-20 Investor. The purpose was twofold, firstly to show how you can use 80-20 Investor to invest and outperform the market with only a few minutes effort every now and then. Secondly, no other investment commentator, journalist or research provider invests their own money for fear of failing. This is a sorry state of affairs and is precisely why I committed to openly running my own portfolio for 80-20 Investor members to see.
Since then I have periodically changed my portfolio using the fund suggestions provided by the 80-20 Investor algorithm and associated research. I always disclose the changes at the time they are made.
Performance update
As is usual in my portfolio reviews, the chart below shows how my portfolio has outperformed since I started the challenge in March 2015, which is over seven years ago. The green line is the performance of my portfolio while the red line is the benchmark showing the average return achieved by professional fund managers given the same asset mix. To accurately calculate this I have used the average return for each sector in which my portfolio invested. The blue line shows what the average multi-asset fund with comparable equity content achieved. In other words, the red line would show the extra performance added by just the asset mix of my portfolio (where I was invested i.e European equities etc) over picking a typical multi-asset fund (the blue line). While the green line (which is my actual performance) shows the impact of being in the right funds at the right time, as identified by the 80-20 Investor algorithm.
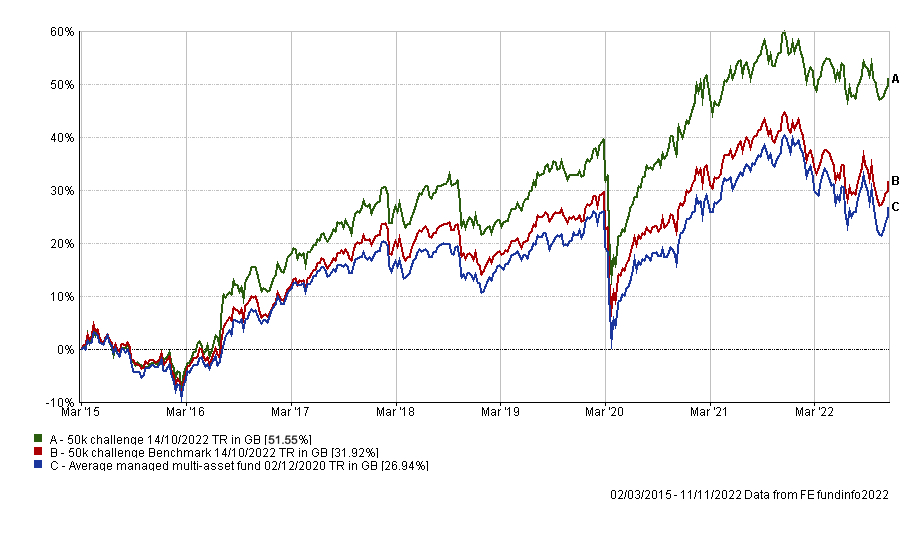
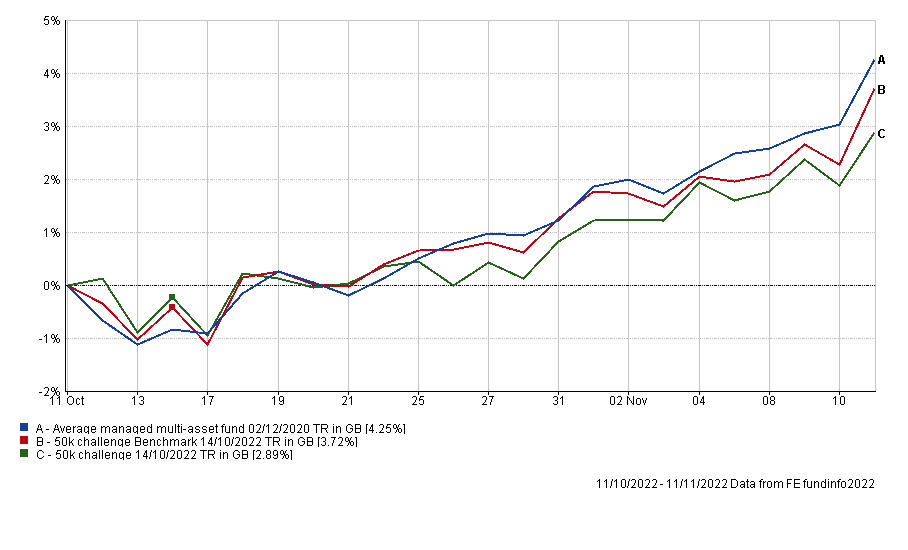
My portfolio continues to outperform its benchmarks over the long term and since my last update in October my £50k portfolio has lagged its benchmarks but has rallied 2.89% nonetheless. So I am pretty pleased with that result especially as it has managed to capture the rebound in markets, while still offering that downside protection that has been evident in 2022.
Taking a closer look at the funds within my portfolio, the table below shows the individual performance of each holding in my portfolio since my last review on 11th October.
|
Fund |
Performance since last review on 11th October |
| Invesco UK Opportunities (UK) | 10.8 |
| M&G Global Dividend | 10.51 |
| BlackRock Natural Resources Growth & Income | 6.87 |
| Jupiter Global Value Equity | 6.12 |
| Fidelity American Special Situations | 6.04 |
| Fidelity Index US | 5.46 |
| JOHCM Global Opportunities | 5.16 |
| McInroy & Wood Balanced | 3.06 |
| iShares Physical Gold ETC | 1.83 |
| Premier Miton Defensive Growth | 1.59 |
| Troy Asset Management Ltd Trojan Ethical | 1.24 |
| Cash | 0.12 |
| Thesis TM Tellworth UK Select | -1.08 |
| Janus Henderson Inst Overseas Bond | -2.01 |
As you can see, there have been some very strong performances from those funds exposed to commodities while more defensive sectors have lagged. The Janus Henderson Inst Overseas Bond has also been hurt by the rally in the strength of the pound during the last month. The pound rose over 5% against the US dollar over the last month.
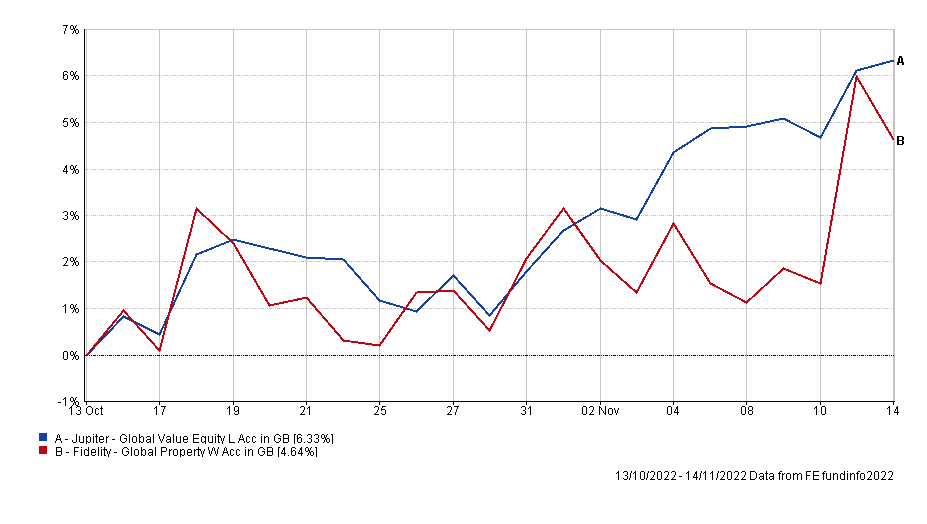
It is good to see the new fund Jupiter Value Equity performing strongly (the blue line in the chart below) especially when its predecessor lagged (the red line). However one month is too short a timeframe to judge whether I was right to make the switch or not, but early indications are promising and the only reason the Fidelity fund made up ground was because of the market pivot after the latest US inflation data, as described in last week's newsletter.
Now, as usual, the table below shows which funds within my portfolio are in the current BOTB or BFBS tables and which are not. Those funds in green are still in the BOTB while those in orange are not in the BOTB but remain in the BFBS list. Meanwhile, any funds in red have dropped out of both shortlists.
| Name | Allocation % (rounded) | Risk | Sector | ISIN Code |
| BlackRock Natural Resources Growth & Income | 4.50% | High | Commodity/Natural Resource | GB00B6865B79 |
| Cash | 6.75% | Low | ||
| Fidelity American Special Situations | 8.50% | Medium | North America | GB00B89ST706 |
| Fidelity Index US | 7.50% | High | North America | GB00BJS8SH10 |
| Invesco UK Opportunities (UK) | 4.75% | Medium | UK All Companies | GB00B1W7HM62 |
| iShares Physical Gold ETC | 5.00% | Medium | Commodity & Energy ETF | IE00B4ND3602 |
| Janus Henderson Inst Overseas Bond | 7.00% | Low | Global Bonds | GB0007673055 |
| JOHCM Global Opportunities | 10.25% | Medium | Global | GB00BJ5JMC04 |
| Jupiter Global Value Equity | 7.00% | Medium | Global | GB00BF5DRF26 |
| M&G Global Dividend | 6.50% | Medium | Global Equity Income | GB00B46J9127 |
| McInroy & Wood Balanced | 9.50% | Medium | Mixed Investment 40-85% Shares |
GB00B7RRJ163
|
| Premier Miton Defensive Growth | 9.25% | Low | Targeted Absolute Return | GB00B832BD89 |
| Thesis TM Tellworth UK Select | 5.50% | Low | Targeted Absolute Return | GB00BNY7YM73 |
| Troy Asset Management Ltd Trojan Ethical | 8.00% | Low | Flexible Investment | GB00BJP0XX17 |
You can see that five funds have fallen out of the 80-20 Investor tables - which are coloured red. Four of them remain the same as last month, namely Troy Trojan Ethical, Invesco UK Opportunities (UK), Fidelity Index US and M&G Global Dividend. This month they have been joined by JOHCM Global Opportunities.
Not making too many wholesale changes to my portfolio turned out to be a wise decision last month as equity markets started to rally strongly just one day after my portfolio review. Had I made a swathe of changes I would have missed the rally. The catalyst for the rally was October's US inflation data as explained in November's monthly newsletter. With a sense of Déjà vu, the release of November's US inflation numbers last week gave equity markets (especially in the US) another boost. It means that they are now trying to gain enough momentum to finally break the downtrend in stocks we've seen throughout 2022. It also means investment returns over the short term have undergone a dramatic shift. In the US the S&P 500 has risen 10% over the last month which is why Fidelity US Index fund, which tracks the S&P 500 has had a performance boost. But with the 5% rally in the value of the pound over the same period that's why the fund is up 5% rather than 10% but that is still impressive.
Of course as a long term investor I don't obsess over such short time intervals or market moves, but it does highlight the level of volatility we're experiencing in the market right now. I originally planned to make a couple of changes to my portfolio last week but the volatility we experienced (which was the highest we'd seen in more than a decade) meant that I learned from October's lessons and avoided drastically changing my portfolio. All the while markets remain prone to spells of high volatility I will continue to minimise the changes I make for fear of the market moving aggressively against me while any fund switches are processed. Preferring instead just to prune where necessary.
Looking at the funds that are coloured red in the above table, Fidelity US Index, Invesco UK Opportunities (UK) and M&G Global Dividend have performed very well over the last month benefiting from the change in market sentiment, as shown in the earlier performance table. They have all also outperformed their sector averages over the last three months so holding onto them until the next portfolio review at the start of December won't cause me any lost sleep. Just because funds fall out of the 80-20 Investor tables doesn't make them bad funds overnight. The same can be said for JOHCM Global Opportunities too which, although not performing as strongly versus its peer group, was in the BFBS as recently as last month. In fact the only funds within my portfolio that have not been in the BFBS or BOTB tables in the last six weeks have been Invesco UK Opportunities (UK) and Troy Asset Management Ltd Trojan Ethical.
In fact, Troy Asset Management Ltd Trojan Ethical has not been in the BOTB and BFBS tables for some time and its performance has flatlined and lagged its peers from the Flexible Investments sectors so I am finally going to remove it from my portfolio.
It means that I am only making one change this month, in light of the extreme volatility. In addition, in the next few weeks we should get some more clarity as to where asset prices are headed next. Hopefully that momentum starts to be positive into the new year.
So I have decided to take the opportunity to switch out of Troy Asset Management Ltd Trojan Ethical and spread the proceeds across a number of funds I already have. In this way I am consolidating the number of funds that I hold.
Fund switch
100% out of Troy Asset Management Ltd Trojan Ethical and 33% into McInroy & Wood Balanced, 33% into Janus Henderson Inst Overseas Bond and 34% Jupiter Global Value Equity
By making the switch I am splitting the proceeds across global equities and bonds in a similar proportion to my existing asset mix. I am simply consolidating the number of holdings that I have. Therefore, the switch largely keeps my asset mix the same, which means that it remains different to that of the BOTB. My portfolio still has more UK equity exposure and no emerging Asian equity exposure. As I said last time, until the market volatility settles I am happy to stick with the asset mix that I currently have.
My portfolio
My portfolio now looks like this:
| Name | Allocation % (rounded) | Risk | Sector | ISIN Code |
| BlackRock Natural Resources Growth & Income | 4.50% | High | Commodity/Natural Resource | GB00B6865B79 |
| Cash | 6.50% | Low | ||
| Fidelity American Special Situations | 9.00% | Medium | North America | GB00B89ST706 |
| Fidelity Index US | 7.50% | High | North America | GB00BJS8SH10 |
| Invesco UK Opportunities (UK) | 5.00% | Medium | UK All Companies | GB00B1W7HM62 |
| iShares Physical Gold ETC | 5.00% | Medium | Commodity & Energy ETF | IE00B4ND3602 |
| Janus Henderson Inst Overseas Bond | 9.00% | Low | Global Bonds | GB0007673055 |
| JOHCM Global Opportunities | 10.25% | Medium | Global | GB00BJ5JMC04 |
| Jupiter Global Value Equity | 9.75% | Medium | Global | GB00BF5DRF26 |
| M&G Global Dividend | 7.00% | Medium | Global Equity Income | GB00B46J9127 |
| McInroy & Wood Balanced | 12.00% | Medium | Mixed Investment 40-85% Shares |
GB00B7RRJ163
|
| Premier Miton Defensive Growth | 9.00% | Low | Targeted Absolute Return | GB00B832BD89 |
| Thesis TM Tellworth UK Select | 5.50% | Low | Targeted Absolute Return | GB00BNY7YM73 |
My Portfolio asset mix
My portfolio asset mix has around 59% exposure to equities. Last month's figures are shown in brackets.
-
- UK Equities 13% (13%)
- North American Equities 23% (23%)
- Asian/Emerging Market Equities 0% (0%)
- Japanese Equities 1% (1%)
- European Equities 7% (6%)
- Chinese equities 0% (0%)
- Other equity 11% (10%)
- Commodities and energy 9% (10%)
- UK Fixed Interest 0% (0%)
- Global Fixed Interest 10% (10%)
- Cash 7% (7%)
- Alternative Investment Strategies 19% (20%)
- Property 0% (0%)
Damien's higher risk and lower risk portfolios
Using the logic described in my post: Update to Damien’s alternative risk portfolios I created hypothetical higher and lower risk versions of my portfolio below:
Lower risk
| Fund | Allocation % |
| Cash | 7 |
| Fidelity American Special Situations | 10 |
| Invesco UK Opportunities (UK) | 6 |
| iShares Physical Gold ETC | 6 |
| Janus Henderson Inst Overseas Bond | 10 |
| JOHCM Global Opportunities | 12 |
| Jupiter Global Value Equity | 11 |
| M&G Global Dividend | 8 |
| McInroy & Wood Balanced | 14 |
| Premier Miton Defensive Growth | 10 |
| Thesis TM Tellworth UK Select | 6 |
Higher risk
| Fund | Allocation % |
| BlackRock Natural Resources Growth & Income | 6 |
| Fidelity American Special Situations | 13 |
| Fidelity Index US | 11 |
| Invesco UK Opportunities (UK) | 7 |
| iShares Physical Gold ETC | 7 |
| JOHCM Global Opportunities | 15 |
| Jupiter Global Value Equity | 14 |
| M&G Global Dividend | 10 |
| McInroy & Wood Balanced | 17 |

£200 Pension Cashback Offer
Make a qualifying deposit or transfer a pension to our partner Interactive Investor.
- Deposit or transfer a pension of at least £20k and you could earn £200 cashback
- Terms and Fees apply, Capital at risk
- New & Existing customers opening a SIPP
- Offer ends 31st July 2026
Before starting your transfer, check you won't lose any valuable benefits (such as guaranteed annuity rates or a lower protected pension age) and find out what exit fees you might have to pay
