

The background to my portfolio
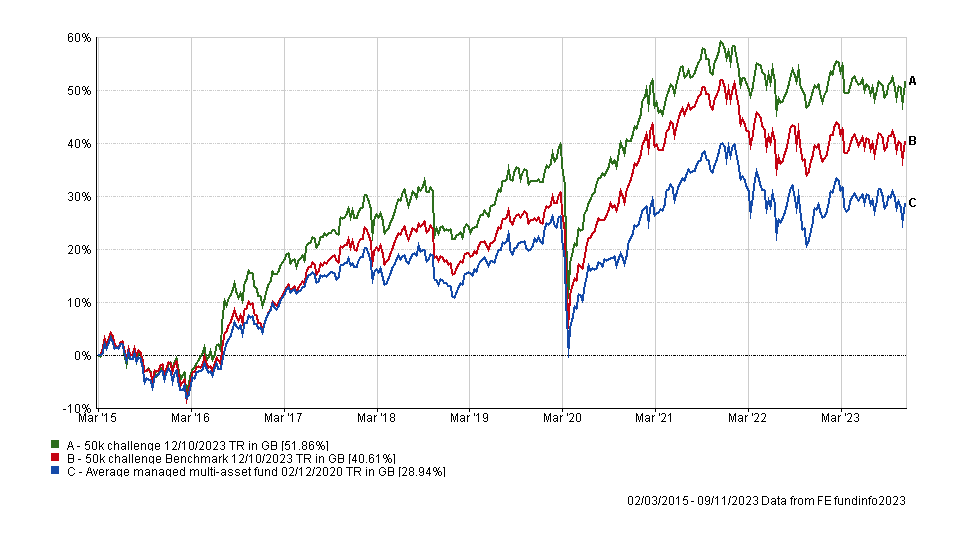
Back in March 2015 I decided to invest £50,000 of my own money using 80-20 Investor. The purpose was twofold, firstly to show how you can use 80-20 Investor to invest and outperform the market with only a few minutes effort every now and then. Secondly, no other investment commentator, journalist or research provider invests their own money for fear of failing. This is a sorry state of affairs and is precisely why I committed to openly running my own portfolio for 80-20 Investor members to see.
Since then I have periodically changed my portfolio using the fund suggestions provided by the 80-20 Investor algorithm and associated research. I always disclose the changes at the time they are made.
Performance update
As is usual in my portfolio reviews, the chart below shows how my portfolio has outperformed since I started the challenge in March 2015. The green line is the performance of my portfolio while the red line is the benchmark showing the average return achieved by professional fund managers given the same asset mix. To accurately calculate this I have used the average return for each sector in which my portfolio invested. The blue line shows what the average multi-asset fund with comparable equity content achieved. In other words, the red line would show the extra performance added by just the asset mix of my portfolio (where I was invested i.e European equities etc) over picking a typical multi-asset fund (the blue line). While the green line (which is my actual performance) shows the impact of being in the right funds at the right time, as identified by the 80-20 Investor algorithm.
The chart shows the performance of my portfolio since my last review a month ago:
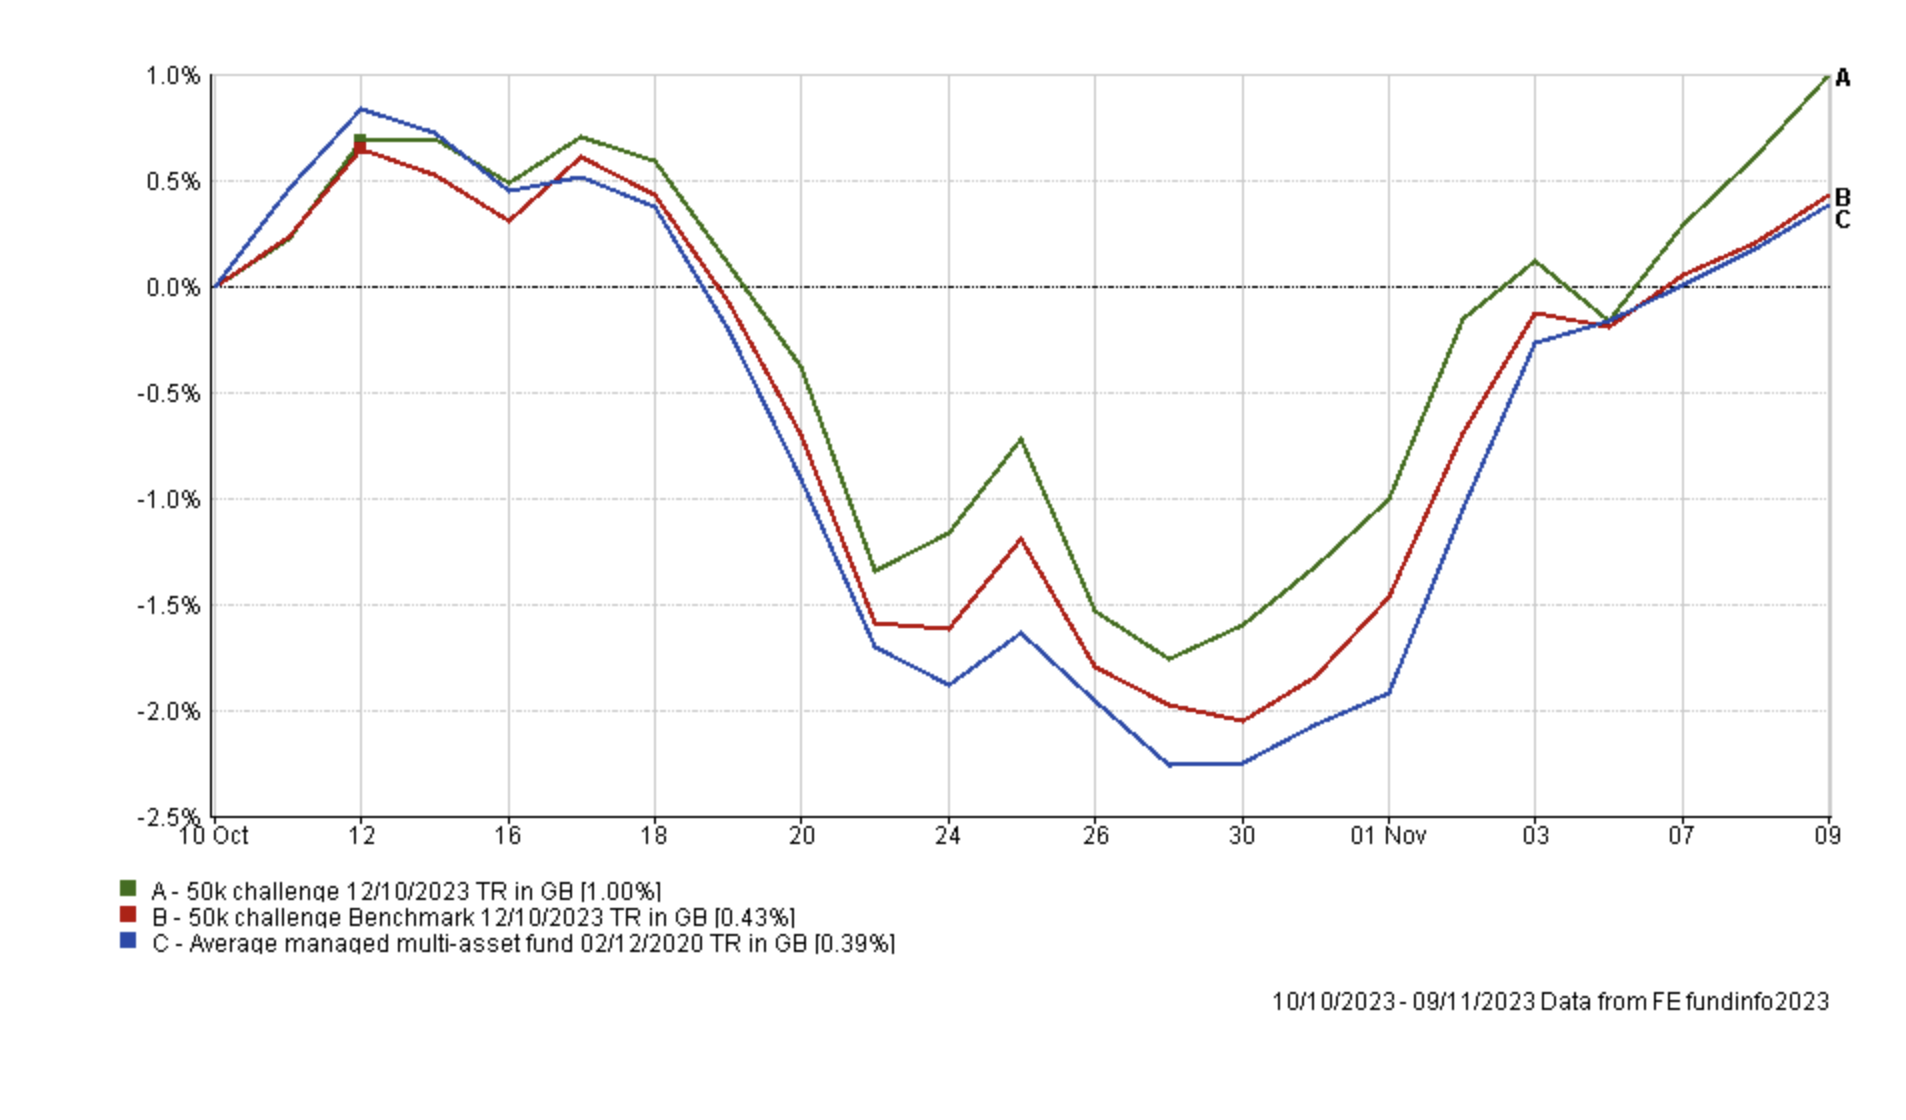
If you have read my November monthly newsletter you will know that the start of November saw a turnaround in bond markets which in turn sparked a rally in equity markets. Up until the start of November my portfolio had produced a strong performance over the previous weeks, but my portfolio gained even more momentum as November has progressed. However, it's worth noting that my portfolio's lower bond exposure (when compared to the average professionally managed multi-asset fund) was a huge boost on performance during October when bond markets were tumbling, but it's been less so in November when bond yields have been falling and bond prices rising. Should bond markets continue to rally then my cash holding could prove a drag on my portfolio's performance going forward. However, right now the rally in US equities is pushing my portfolio higher.
The table below shows the performance of the funds within my portfolio since my last review. I have also included the performance of the funds since the start of November. You can see that gold has been the standout performer since my last review, despite the slowdown in the first few days of November. But interestingly, there has been a significant turnaround in fortunes for a number of the laggards, since the start of November. For example, since the start of November Troy Trojan Global Equity is second only to T. Rowe Price US Large Cap Growth Equity after rallying an incredible 4.33%. But of course the performance of investment markets over just a few days does not significantly impact the BOTB and BFBS tables or how I choose funds within my portfolio, as 80-20 Investor looks at momentum over more extended timeframes.
| Name | % since the 10th of October 2023 | % return since start of November 2023 |
| iShares Physical Gold ETC | 5.15 | 0.71 |
| T. Rowe Price US Large Cap Growth Equity | 2.70 | 5.07 |
| Thesis TM Tellworth UK Select | 1.85 | 1.07 |
| L&G Global 100 Index Trust | 1.53 | 3.11 |
| abrdn High Yield Bond | 1.48 | 1.09 |
| Fidelity American | 0.95 | 3.28 |
| Liontrust India | 0.94 | 2.04 |
| Troy Asset Management Ltd Trojan Global Equity | 0.88 | 4.33 |
| BNY Mellon Global Dynamic Bond | 0.78 | 0.75 |
| BNY Mellon Multi-Asset Balanced | 0.35 | 2.77 |
| Cash | 0.33 | 0.00 |
| Fidelity Index Japan | -0.46 | 0.71 |
| WS Saracen Global Income and Growth | -1.48 | 2.36 |
As usual the table below shows which funds within my portfolio are in the current BOTB or BFBS tables and which are not. Those funds in blue are still in the BOTB while those in orange are not in the BOTB but remain in the BFBS list. Meanwhile, any funds in red have dropped out of both shortlists.
| Fund | Allocation | Risk | Sector | ISIN |
| abrdn High Yield Bond | 12 | Low | Sterling High Yield |
GB00B79RR984
|
| BNY Mellon Global Dynamic Bond | 6 | Low | Targeted Absolute Return | GB00B8K10865 |
| BNY Mellon Multi-Asset Balanced | 8.5 | Medium | Mixed Investment 40-85% Shares | GB00B8K9JZ06 |
| Cash | 7 | Low | ||
| Fidelity American | 10 | Medium | North America |
GB00B8GPC429
|
| Fidelity Index Japan | 6 | Medium | Japan |
GB00BHZK8872
|
| iShares Physical Gold ETC | 5 | Medium | Commodity & Energy ETF | IE00B4ND3602 |
| T. Rowe Price US Large Cap Growth Equity | 5.5 | High | North America |
GB00BD5FHW12
|
| L&G Global 100 Index Trust | 10 | Medium | Global |
GB00B0CNH056
|
| Liontrust India | 3.5 | High | India/Indian Subcontinent |
GB00B1L6DV51
|
| Thesis TM Tellworth UK Select | 5.5 | Low | Targeted Absolute Return |
GB00BNY7YM73
|
| Troy Asset Management Ltd Trojan Global Equity | 11 | Medium | Global | GB00B0ZJ5S47 |
| WS Saracen Global Income & Growth | 10 | Medium | Global Equity Income | GB00B5B35X02 |
This month only three funds have fallen outside out the BOTB and BFBS tables and are coloured in red. These are:
- Troy Asset Management Ltd Trojan Global Equity
- BNY Mellon Multi-Asset Balanced
- BNY Mellon Global Dynamic Bond
Interestingly, last time BNY Mellon Global Dynamic Bond had only just dropped out of the BFBS and BOTB table and so I reduced my exposure to the fund, placing the proceeds into its stablemate, BNY Mellon Multi-Asset Balanced which also happens to be one of the funds from my Consistent funds research . However, I did maintain some exposure to BNY Mellon Global Dynamic Bond until this month, hoping that we would have more clarity on the direction of bond markets. Since my last review, BNY Mellon Global Dynamic Bond has outperformed the BNY Mellon Multi-Asset Balanced, as shown in the earlier table. However, since the start of November the reverse is true with BNY Mellon Multi-Asset Balanced rallying 2.77% as bond and equity markets soared. So my wait and see approach paid off. But now the rally in bond markets has stalled slightly and we are still waiting to see whether the rally will continue or unravel.
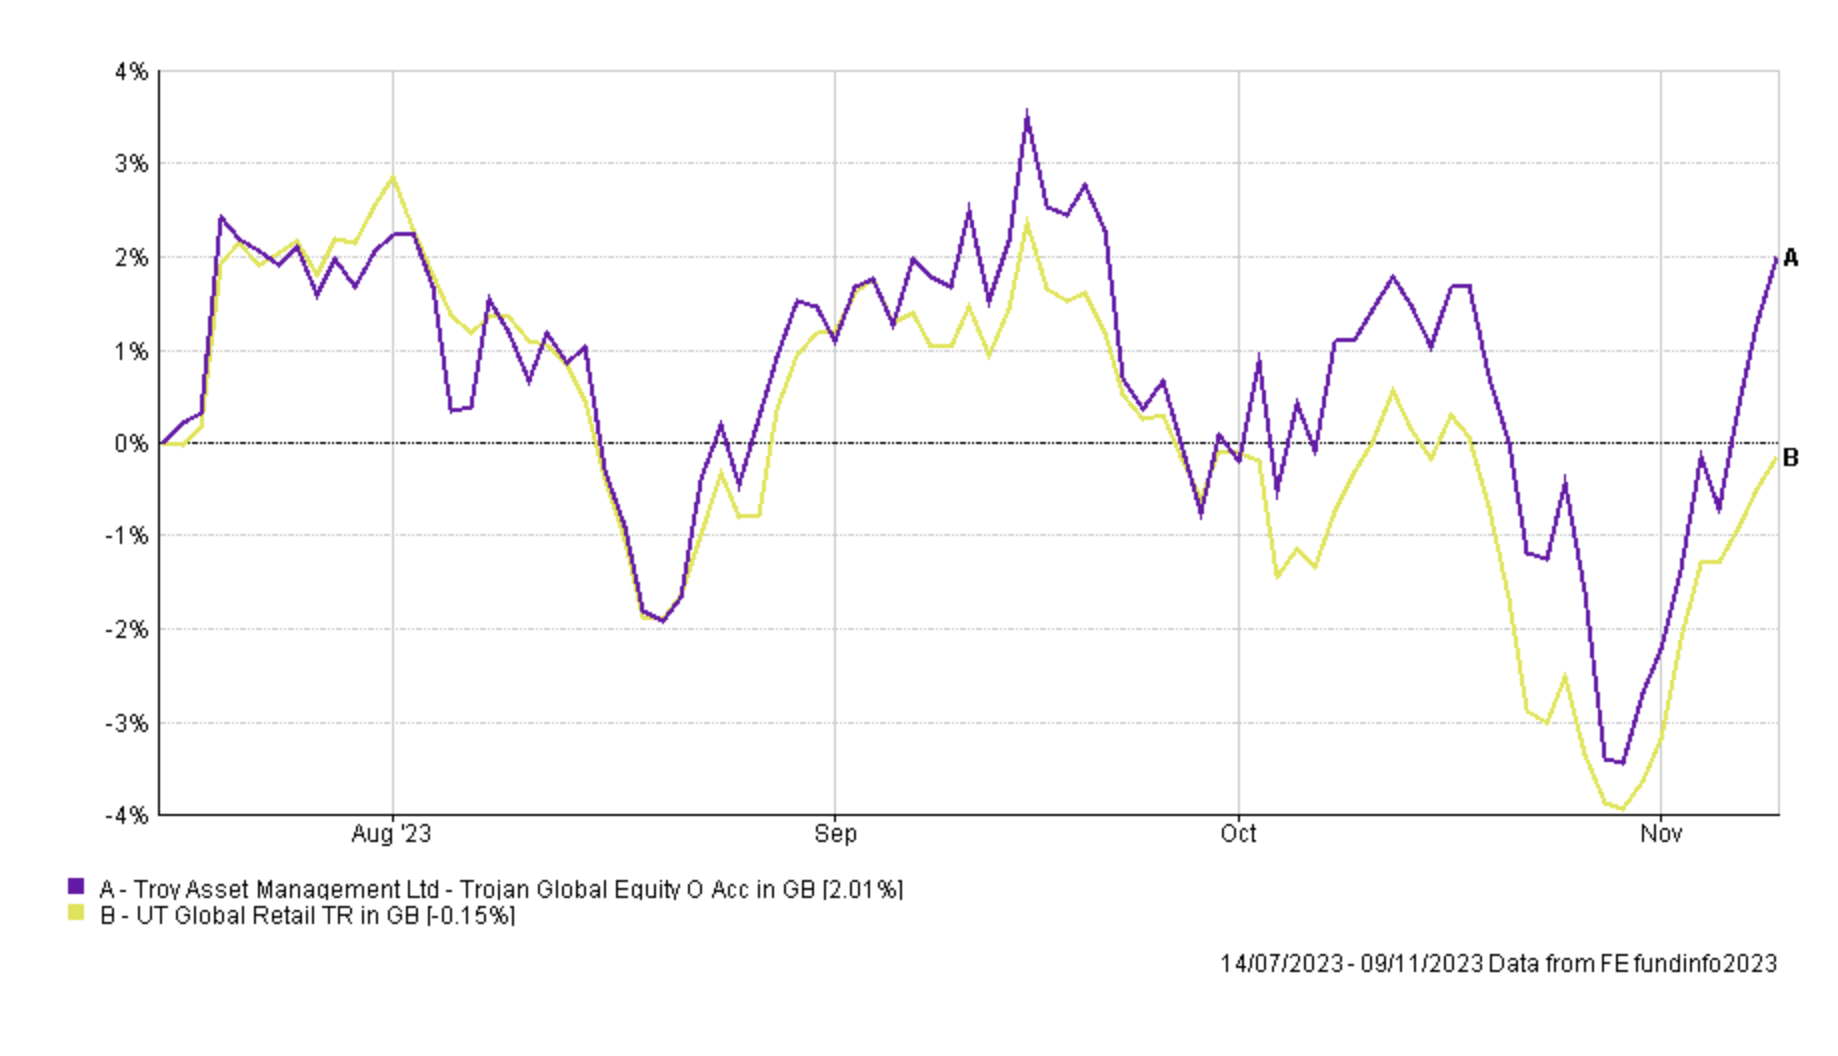
The other fund to drop out of the BOTB and BFBS tables this time is Troy Asset Management Ltd Trojan Global Equity. The chart below shows the performance of the fund since I've held it in my portfolio versus its sector average. As you can see the performance has been strong, largely thanks to the rebound since late October. In fact, the fund was in the BOTB table as recently as October.
In my November 2023 monthly newsletter I discussed how the start of November had seen a significant turnaround in the fortunes of bond funds as well as increased optimism among equity investors. However it's too early to tell whether the new trend will gather momentum and present me with an opportunity to take advantage of it. As I've written many times in my previous portfolio reviews, it's better to be right than first when deciding whether to jump on a market trend. That is why I am not intending to make any changes this month.
Ultimately the three funds coloured red have performed adequately. They also add diversity to my existing low and medium risk holdings within my portfolio, each doing something slightly different to other holdings. That is why my portfolio has managed to hold up even when the market narrative changed at the start of November. My portfolio has been performing strongly and as such I will hold-off making any changes for now. I had planned to perhaps increase my emerging market equity exposure as my asset mix has deviated away from that of the BOTB. However, despite these differences, my portfolio has produced the same return since the new BOTB was published albeit via a different route
Fund switches
I am not making any fund switches this month so my portfolio remains the same and my equity exposure is still approximately 61%.
My portfolio
My portfolio looks like this:
| Fund | Allocation | Risk | Sector | ISIN |
| abrdn High Yield Bond | 12 | Lower | Sterling High Yield | GB00B79RR984 |
| BNY Mellon Global Dynamic Bond | 6 | Lower | Targeted Absolute Return | GB00B8K10865 |
| BNY Mellon Multi-Asset Balanced | 8.5 | Medium | Mixed Investment 40-85% Shares | GB00B8K9JZ06 |
| Cash | 7 | Lower | ||
| Fidelity American | 10 | Medium | North America | GB00B8GPC429 |
| Fidelity Index Japan | 6 | Medium | Japan | GB00BHZK8872 |
| iShares Physical Gold ETC | 5 | Medium | Commodity & Energy ETF | IE00B4ND3602 |
| T. Rowe Price US Large Cap Growth Equity | 5.5 | Higher | North America | GB00BD5FHW12 |
| L&G Global 100 Index Trust | 10 | Medium | Global | GB00B0CNH056 |
| Liontrust India | 3.5 | Higher | India/Indian Subcontinent | GB00B1L6DV51 |
| Thesis TM Tellworth UK Select | 5.5 | Lower | Targeted Absolute Return | GB00BNY7YM73 |
| Troy Asset Management Ltd Trojan Global Equity | 11 | Medium | Global | GB00B0ZJ5S47 |
| WS Saracen Global Income & Growth* | 10 | Medium | Global Equity Income | GB00B5B35X02 |
* note that the TB Saracen Global Income & Growth fund has changed its name to WS Saracen Global Income & Growth.
My Portfolio asset mix
My portfolio asset mix has approximately 61% exposure to equities. Last month's figures are shown in brackets.
-
- UK Equities 5% (5%)
- North American Equities 28% (28%)
- Asian/Emerging Market Equities 4% (4%)
- Japanese Equities 6% (6%)
- European Equities 7% (7%)
- Chinese equities 0% (0%)
- Other equity 11% (11%)
- Commodities and energy 5% (5%)
- UK Fixed Interest 0% (0%)
- Global Fixed Interest 18% (18%)
- Cash 7% (7%)
- Alternative Investment Strategies 9% (9%)
- Property 0% (0%)
Damien's higher risk and lower risk portfolios
Using the logic described in my post: Update to Damien’s alternative risk portfolios I created hypothetical higher and lower risk versions of my portfolio below:
Lower risk
| Fund | Allocation % |
| abrdn High Yield Bond | 13 |
| BNY Mellon Global Dynamic Bond | 7 |
| BNY Mellon Multi-Asset Balanced | 9 |
| Cash | 8 |
| Fidelity American | 11 |
| Fidelity Index Japan | 7 |
| iShares Physical Gold ETC | 5 |
| L&G Global 100 Index Trust | 11 |
| Thesis TM Tellworth UK Select | 6 |
| Troy Asset Management Ltd Trojan Global Equity | 12 |
| WS Saracen Global Income & Growth | 11 |
Higher risk
| Fund | Allocation % |
| BNY Mellon Multi-Asset Balanced | 12 |
| Fidelity American | 14 |
| Fidelity Index Japan | 9 |
| iShares Physical Gold ETC | 7 |
| T. Rowe Price US Large Cap Growth Equity | 8 |
| L&G Global 100 Index Trust | 14 |
| Liontrust India | 5 |
| Troy Asset Management Ltd Trojan Global Equity | 16 |
| WS Saracen Global Income & Growth | 15 |

£200 Pension Cashback Offer
Make a qualifying deposit or transfer a pension to our partner Interactive Investor.
- Deposit or transfer a pension of at least £20k and you could earn £200 cashback
- Terms and Fees apply, Capital at risk
- New & Existing customers opening a SIPP
- Offer ends 31st July 2026
Before starting your transfer, check you won't lose any valuable benefits (such as guaranteed annuity rates or a lower protected pension age) and find out what exit fees you might have to pay
