

The background to my portfolio
Back in March 2015 I decided to invest £50,000 of my own money using 80-20 Investor. The purpose was twofold, firstly to show how you can use 80-20 Investor to invest and outperform the market with only a few minutes effort every now and then. Secondly, no other investment commentator, journalist or research provider invests their own money for fear of failing. This is a sorry state of affairs and is precisely why I committed to openly running my own portfolio for 80-20 Investor members to see.
Since then I have periodically changed my portfolio using the fund suggestions provided by the 80-20 Investor algorithm and associated research. I always disclose the changes at the time they are made.
Performance update
As is usual in my portfolio reviews, the chart below shows how my portfolio has outperformed since I started the challenge in March 2015, which is over six years ago. The green line is the performance of my portfolio while the red line is the benchmark showing the average return achieved by professional fund managers given the same asset mix. To accurately calculate this I have used the average return for each sector in which my portfolio invested. The blue line shows what the average multi-asset fund with comparable equity content achieved. In other words, the red line would show the extra performance added by just the asset mix of my portfolio (where I was invested i.e European equities etc) over picking a typical multi-asset fund (the blue line). While the green line (which is my actual performance) shows the impact of being in the right funds at the right time, as identified by the 80-20 Investor algorithm.
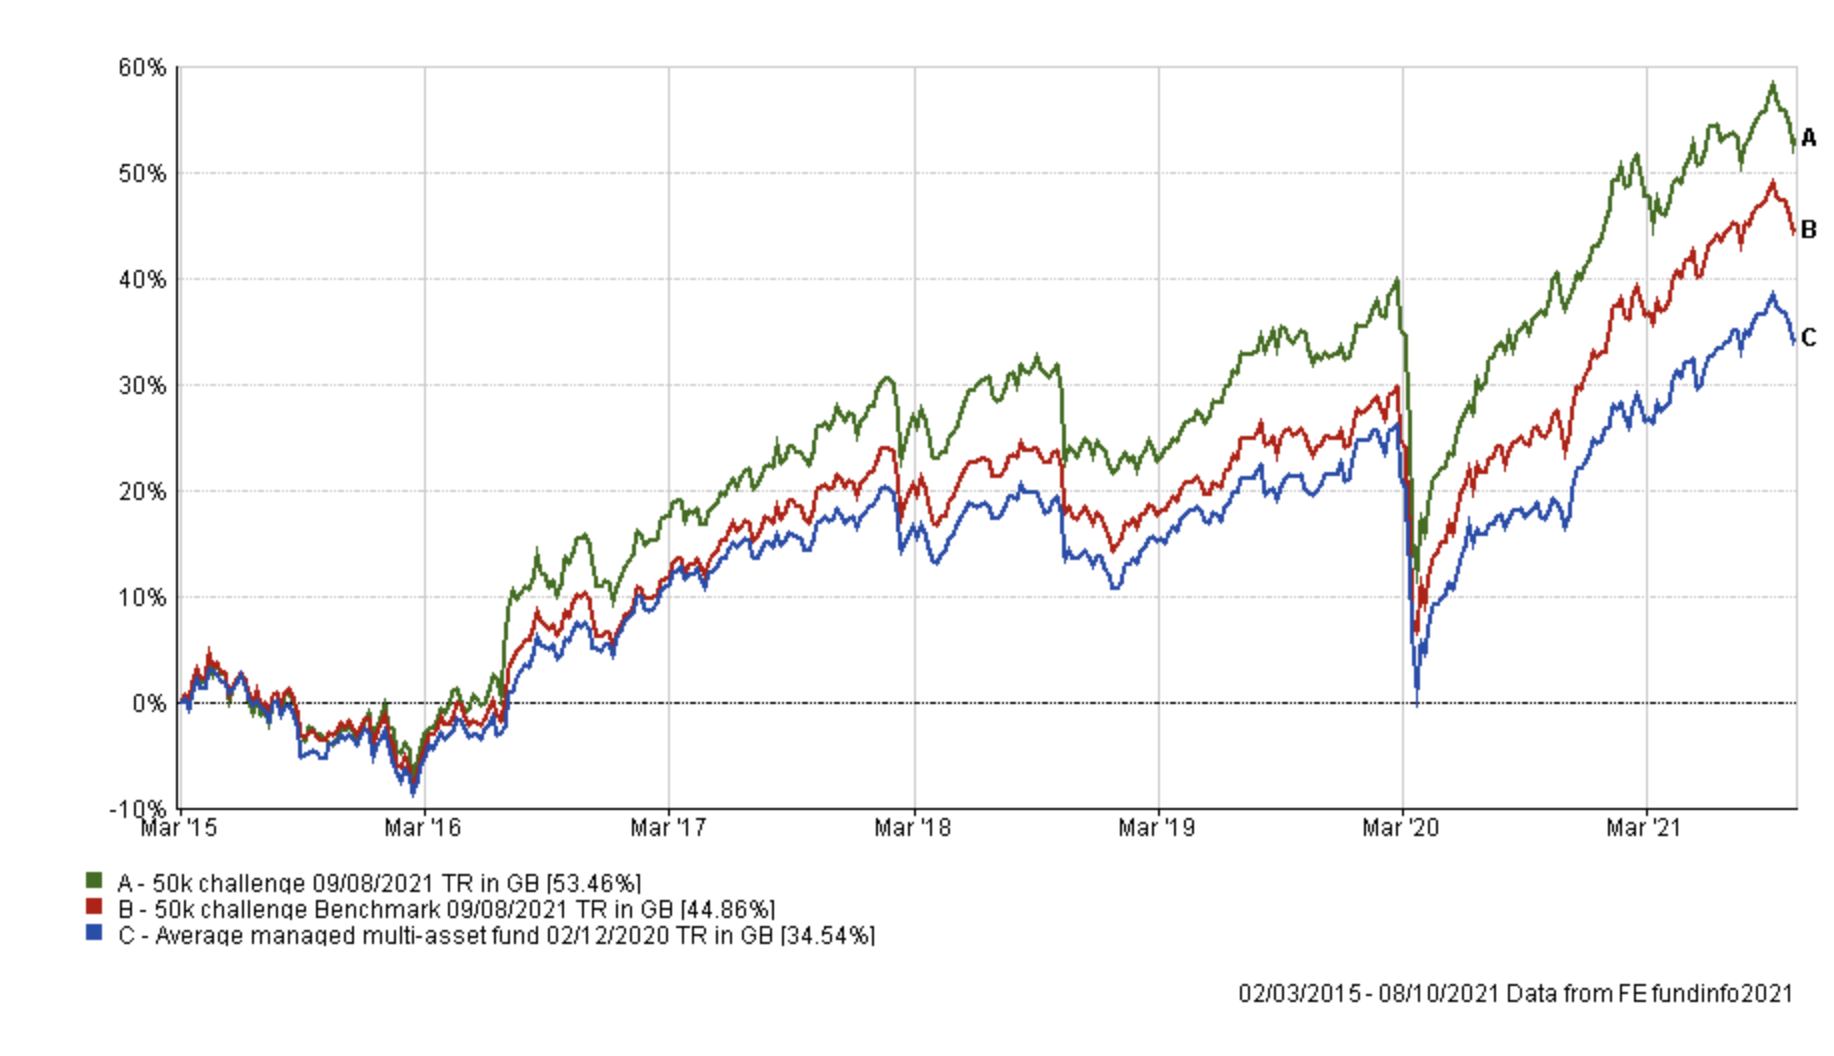
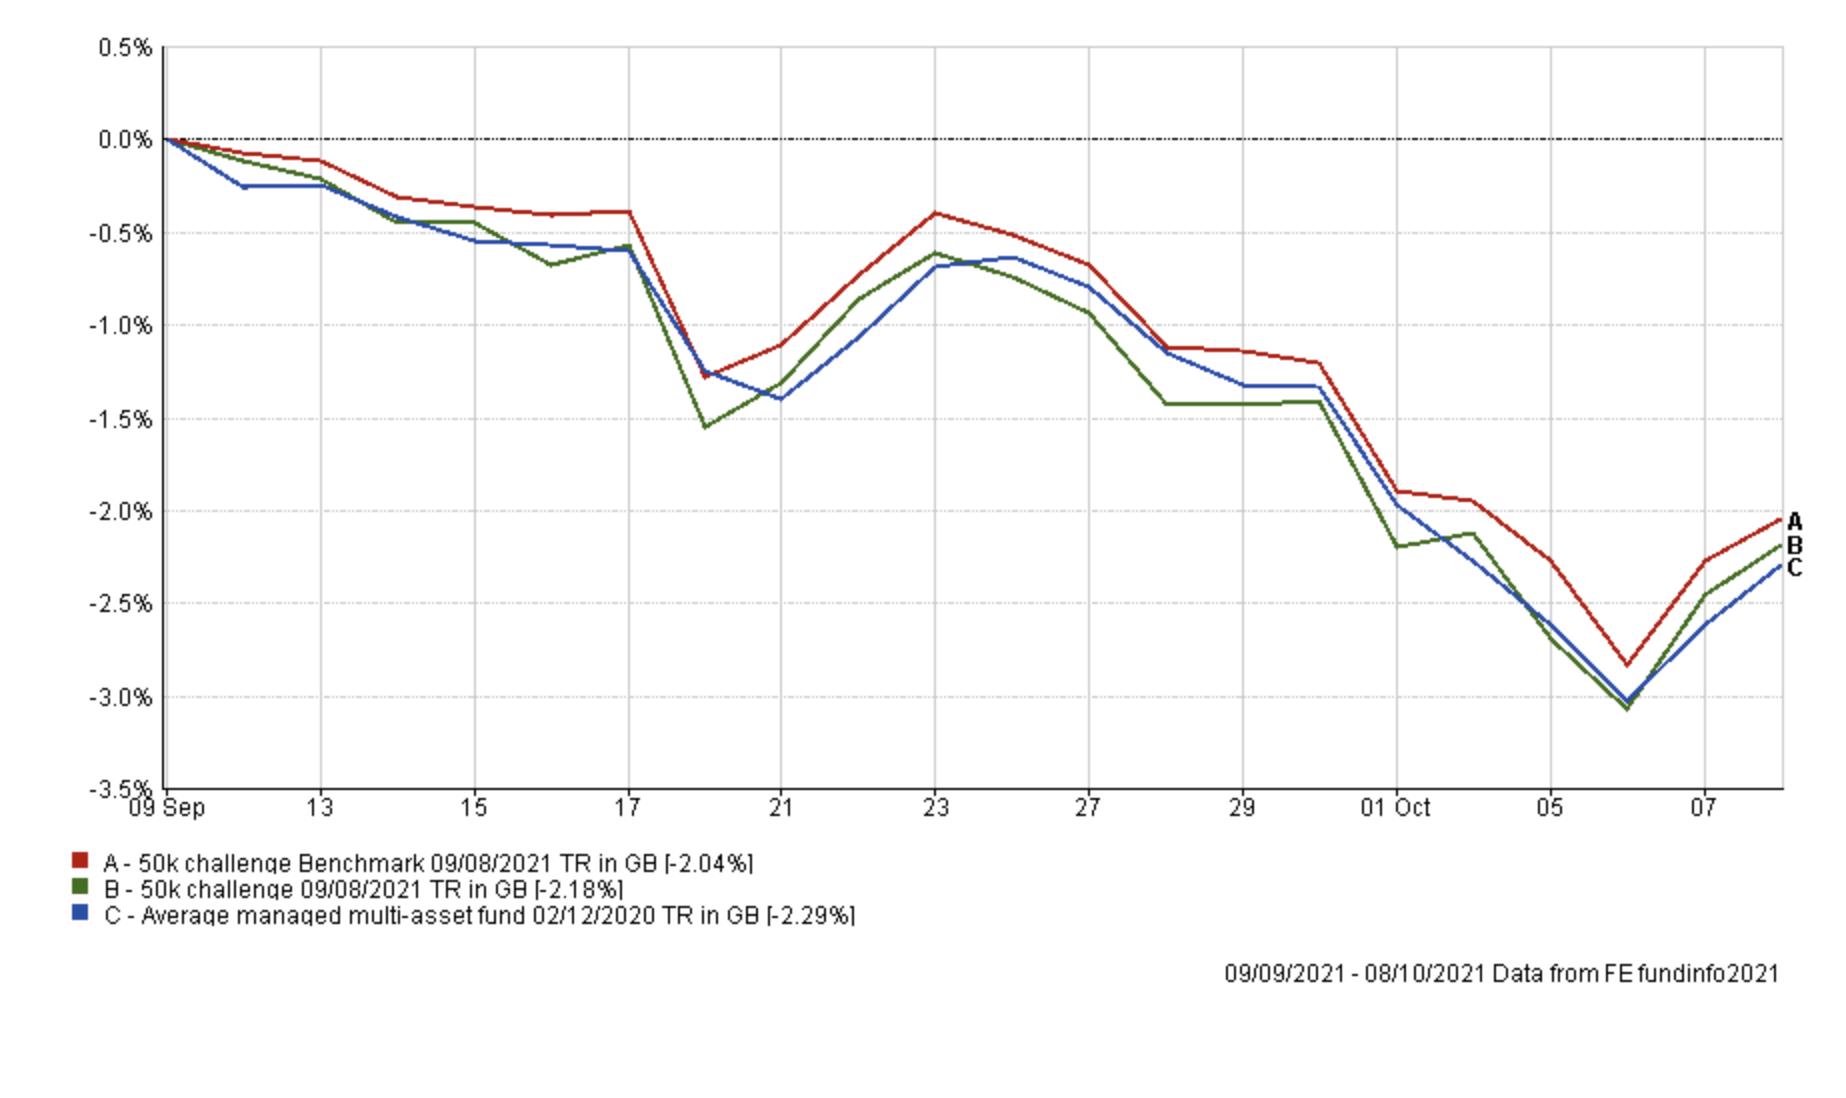
My £50k portfolio currently sits 3% below its all-time high, after the recent market pullback, but continues to beat its benchmarks. The chart below shows how my portfolio performed in line with its benchmarks during the last month (and since my last review) when equity and bond markets struggled to navigate the surge in bond yields.
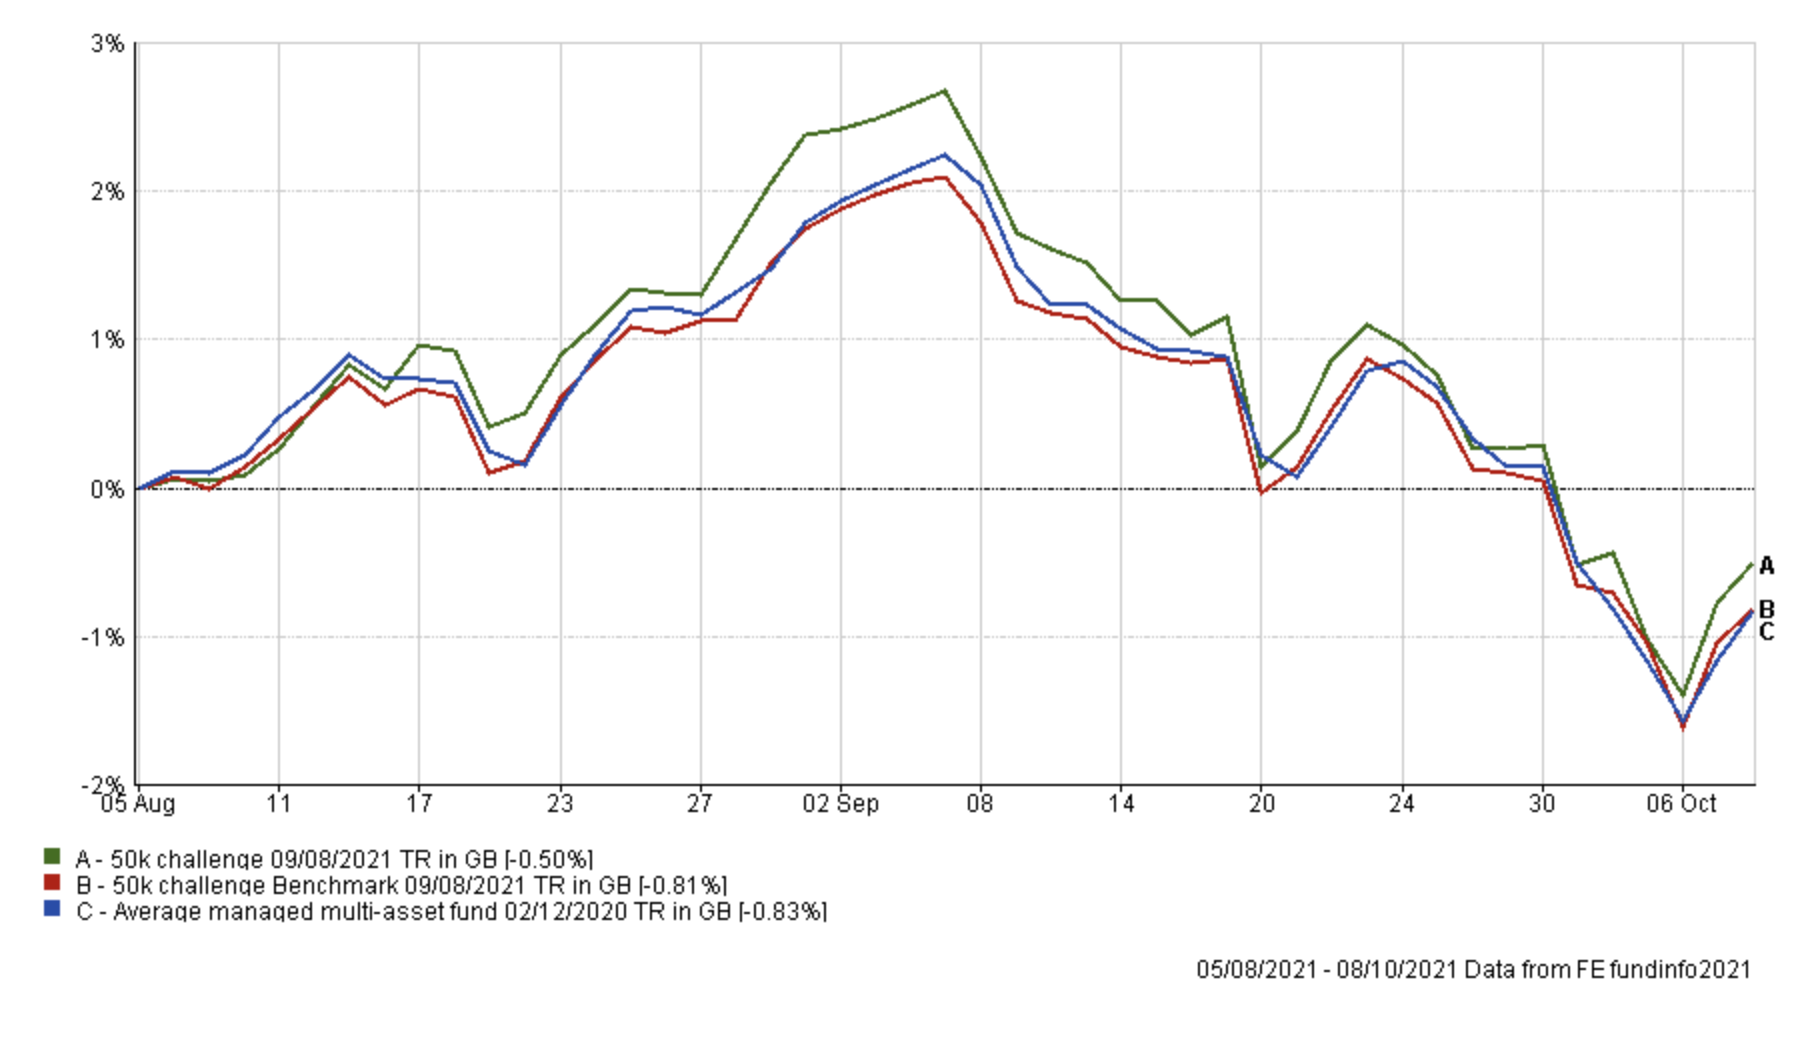
The chart below shows how my portfolio has performed since the last time I made any changes, which was back at the start of August. Again it has performed in line with its benchmarks in what has been a difficult investment environment as bond and equity markets have fallen in tandem.
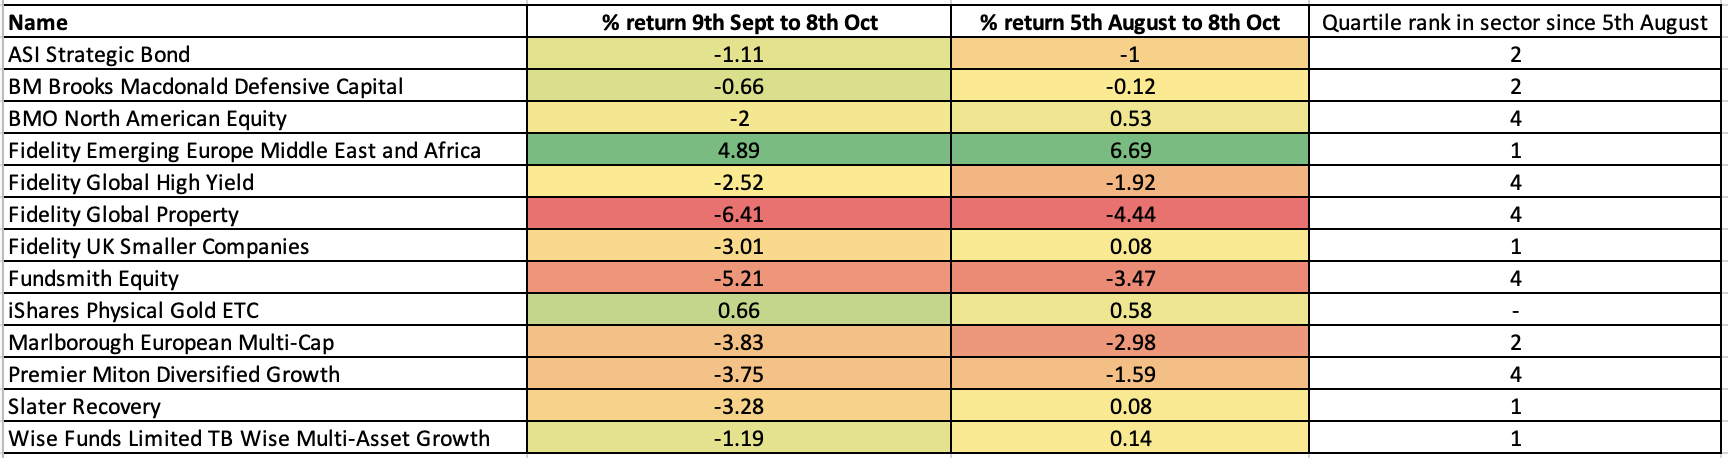
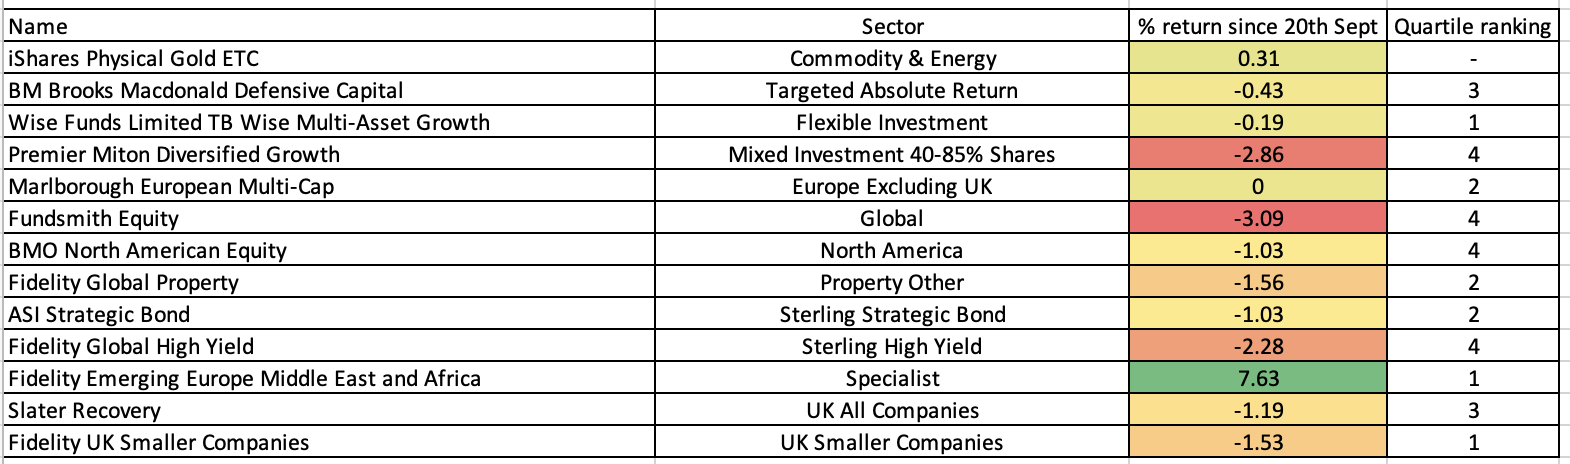
The table below shows the overall performance of each fund within my portfolio since my review last month (in the first column) and since the last time I tweaked my portfolio back in August. The columns are colour coded to show the best performers for each time period in green and the worst in red. The final column shows the quartile rank each fund achieved over the 2 month period compared to their peers within their respective sectors. You can see Fidelity Emerging Europe Middle East and Africa was by far the best performer, benefiting from its Russian equity exposure and rising energy prices, while Fidelity Global Property was the worst performer due to the rapid rise in bond yields. If real yields rise it tends to be bad for property funds.
The table below shows which funds within my current portfolio are in the current BOTB or BFBS tables and which are not. Those funds in green are still in the BOTB while those in orange are not in the BOTB but remain in the BFBS list. Meanwhile, any funds in red have dropped out of both shortlists.
|
Name |
Allocation % (rounded) | Risk | Sector | ISIN Code |
| ASI Strategic Bond | 10 | Low | Sterling Strategic Bond |
GB00BWK27X12
|
| BM Brooks Macdonald Defensive Capital | 5 | Low | Targeted Absolute Return |
GB00B61MR835
|
| BMO North American Equity | 5.5 | Medium | North America | GB0030281405 |
| Fidelity Emerging Europe Middle East and Africa | 6.5 | High | Specialist | GB00B87Z7808 |
| Fidelity Global High Yield | 8 | Low | Sterling High Yield |
GB00B7K7SQ18
|
| Fidelity Global Property | 7 | Medium | Property Other |
GB00B7K2NZ09
|
| Fidelity UK Smaller Companies | 9.5 | High | UK Smaller Companies |
GB00B7VNMB18
|
| Fundsmith Equity | 7.5 | Medium | Global |
GB00B4Q5X527
|
| iShares Physical Gold ETC | 4 | Medium | Commodity & Energy ETF | IE00B4ND3602 |
| Marlborough European Multi-Cap | 6.5 | High | Europe Excluding UK | GB0001719730 |
| Premier Diversified Growth | 16 | Medium | Mixed Investment 40-85% Shares | GB00B8BJV423 |
| Slater Recovery | 6 | Medium | UK All Companies | GB0031554248 |
| Wise Multi-Asset Growth | 8.5 | Medium | Flexible Investment | GB0034272533 |
One final table that is worth looking at is the performance of each fund since 20th September, which was the date from which bond yields began exploding higher. If we really are seeing a regime change towards higher bond yields then it's interesting to see how each fund within my portfolio performed compared to their peers over the time period (click to enlarge).
Taking all of the above analysis in the round there are a number of funds that have begun to struggle in relation to their peers, namely:
- Premier Diversified Growth
- BMO North American Equity
- Fidelity Global High Yield
- Fidelity Global Property
- Fundsmith Equity
Most of the other funds within my portfolio are either still in the BOTB or BFBS tables or in the case of Wise Multi-Asset Growth holding up well in the current environment when compared to their peers, despite dropping out of the BOTB and BFBS tables. So for now that fund, in particular, will have a stay of execution. With markets as volatile as they are now, what with investors rotating back and forth based largely on what is happening with bond yields. it is prudent to minimise the number of fund switches I make at present as markets could easily move against me during any transaction. And as shown earlier, my portfolio is performing in line with the wider market so there is little need for drastic action just yet.
It is for a similar reason that I will leave the Fundsmith Equity fund in my portfolio for now, as despite its recent underperformance it has managed to creep back into the BFBS table.
However, I will be altering my exposure to Fidelity Global Property, Fidelity Global High Yield, BMO North American Equity and Premier Diversified Growth.
It is to be expected that commercial property funds will struggle in an environment where bond yields are rising quickly, so it is no surprise that Fidelity Global Property has struggled. However it has outperformed its peer group average since the spike in bond yields that started on 20th September, so all is not lost. The fund remains in the BFBS table, for now at least, but has struggled since I added the fund to my portfolio in August. So I will reduce my exposure to that particular asset class by 25% to bring it in line with that of the BOTB, which has also reduced its property exposure this month.
Fidelity Global High Yield had been a rock-solid performer since it was first introduced into my portfolio nearly a year ago, as shown in the chart below.
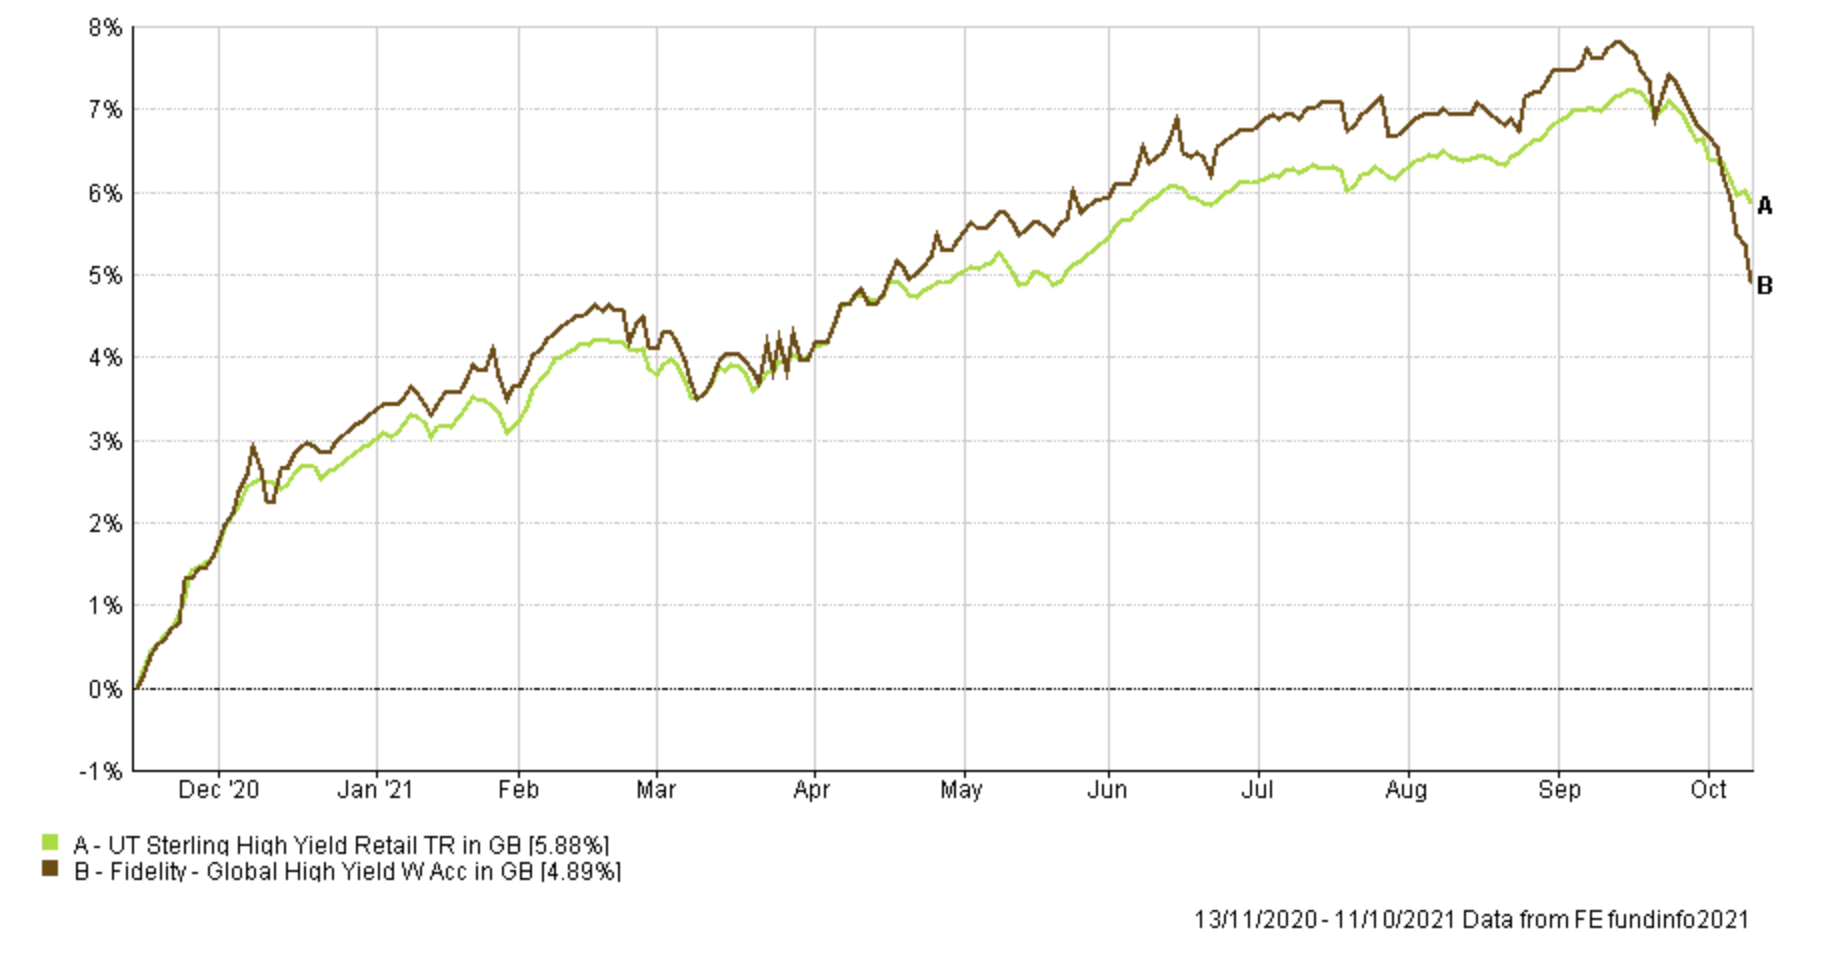
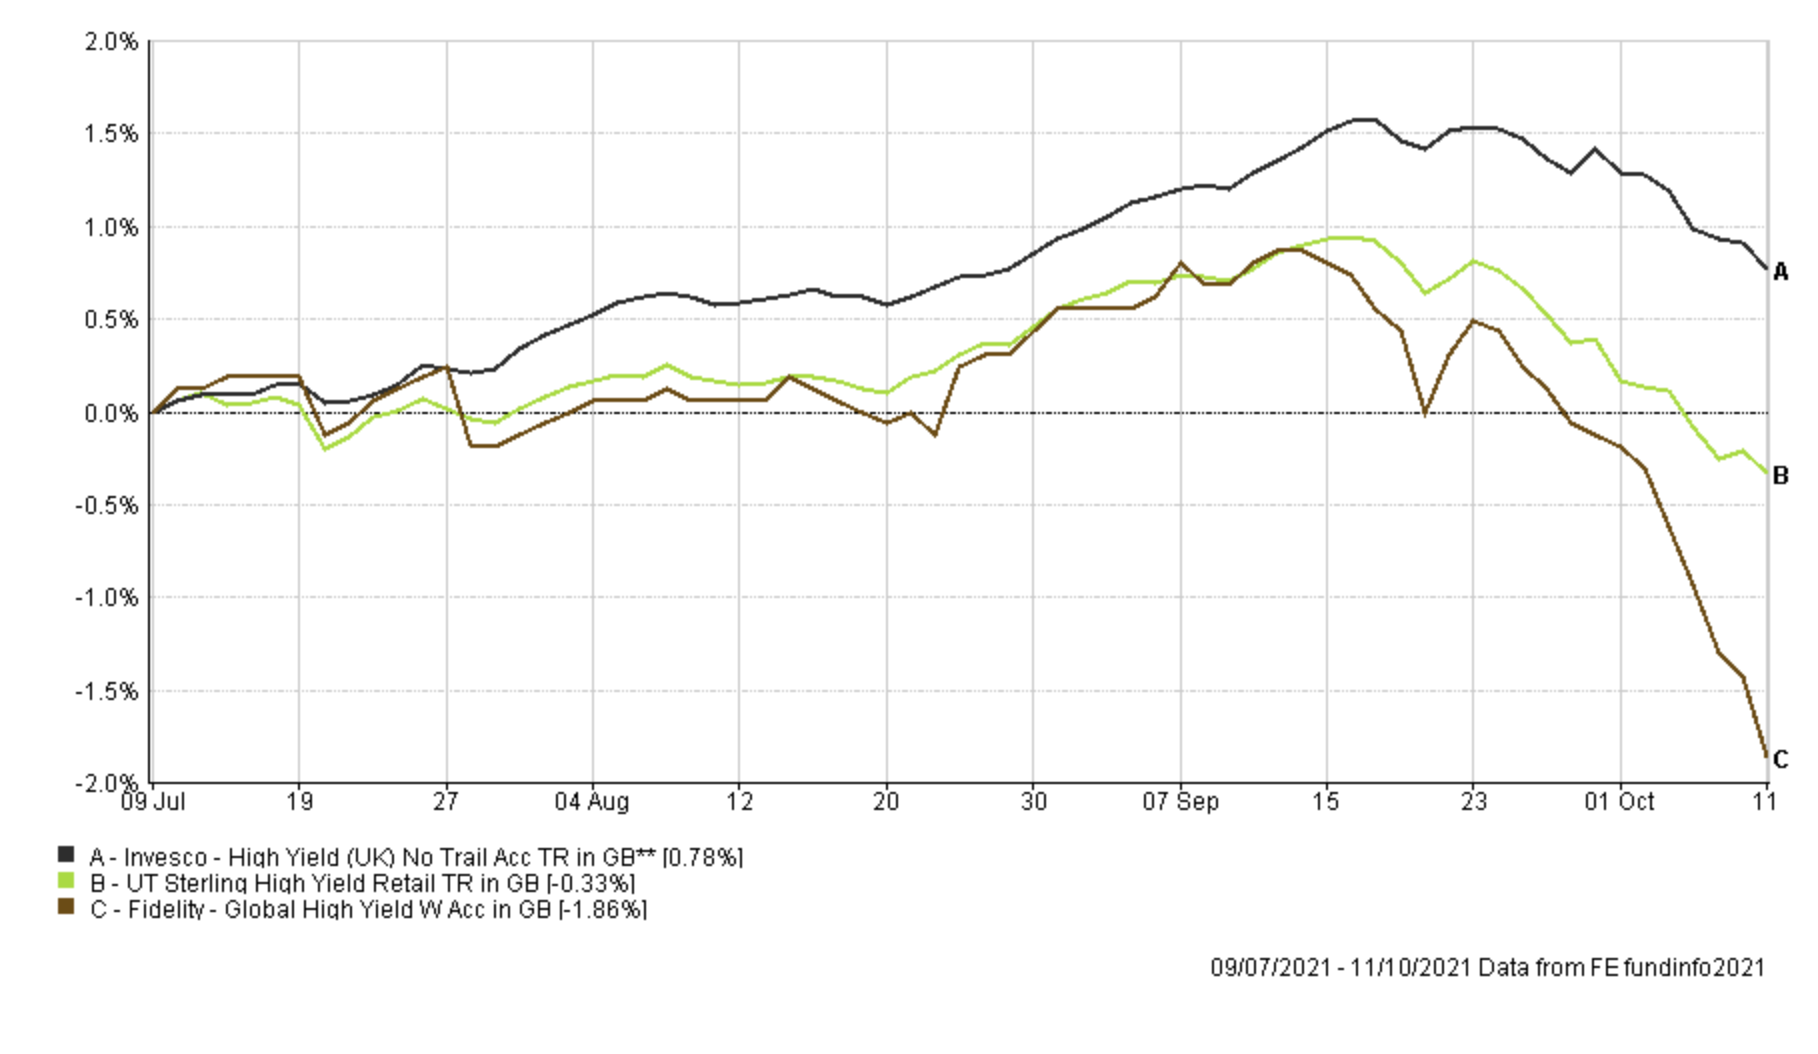
However, you can also see how the fund has slumped since bond yields began rising rapidly. Compare its performance over recent months with that of its peer, and BOTB regular, Invesco High Yield (UK) and you can see that the latter perhaps represents a better option in the current environment
As you can see in the earlier tables the BMO North American Equity has disappointed somewhat in recent months (after falling out of the BOTB. and BFBS tables), so I am looking to switch up my North American exposure while also trying to counter the tech growth focus of the Fundsmith Equity fund. Looking at the BOTB the clear choice would be SVS Sanlam North American Equity in a like-for-like sector swap, in order to achieve my objective.
Finally, Premier Diversified Growth is a fund that has been in my portfolio since January 2020. It has been an outstanding performer as shown in the chart below versus its peer group average.
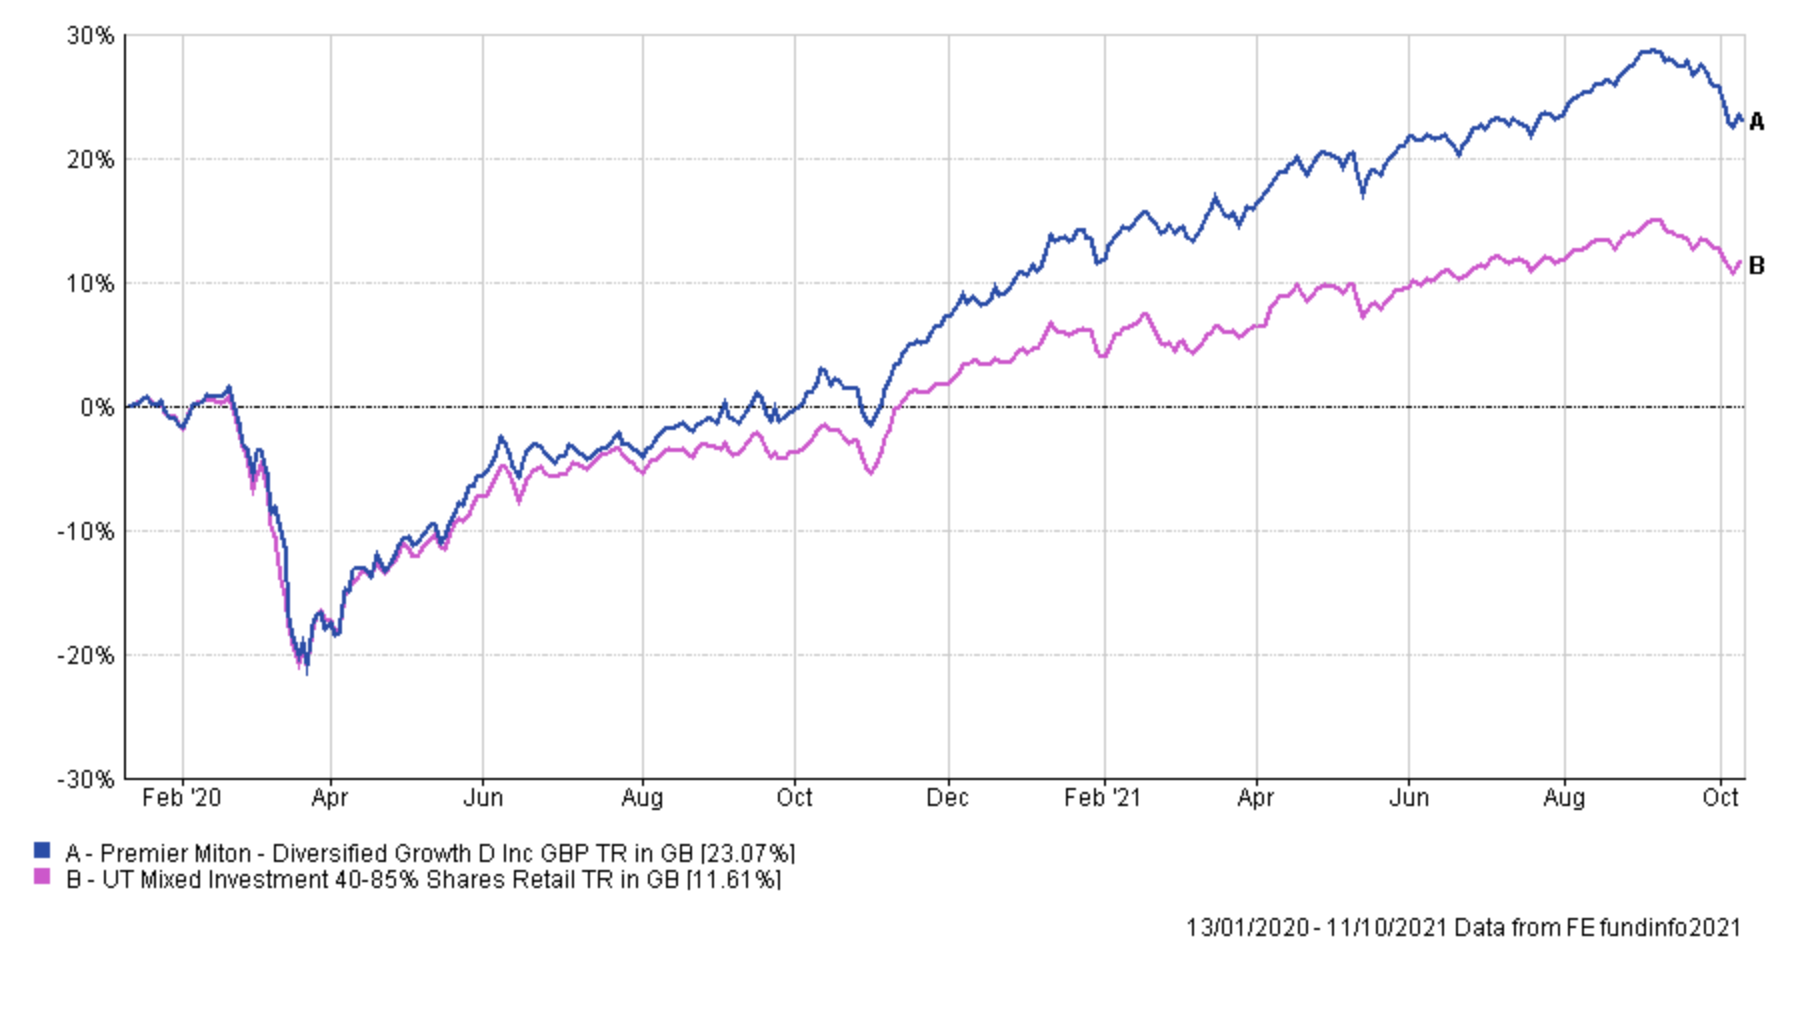
Yet you can see how since the start of September the fund has underperformed, partly due to its exposure to growth stocks in the US. It means that the fund has now fallen out of the BFBS and BOTB tables. It is certainly not suddenly a bad fund but in recent months I had been increasing my exposure to the fund due to its strong performance. Now that its performance has weakened I will reduce my exposure to the fund by a third, essentially dripping out of it and maintaining a watching brief as we move into November.
Fund switches
The fund switches below bring my portfolio in line with the BOTB a bit more. They only affect around 23% of my portfolio, given the amount of market volatility we are experiencing, with the aim of diversifying my portfolio further (in terms of equity style) and increasing exposure to funds that have fared better in this uncertain bond yield environment. I have increased my exposure to Fidelity Emerging Europe Middle East and Africa which is a fund within my portfolio that has performed particularly strongly in recent months.
- 100% out of BMO North American Equity and 100% into SVS Sanlam North American Equity
- 100% out of Fidelity Global High Yield and 100% into Invesco High Yield (UK)
- 25% out of Fidelity Global Property and 100% into Fidelity Emerging Europe Middle East and Africa
- 33.33% out of Premier Diversified Growth and 100% into SVS Sanlam North American Equity
Overall it means that the equity exposure within my portfolio has risen slightly to 65%, up from 63%, while the number of holdings has remained the same.
My portfolio
My portfolio now looks like this:
| Name | Allocation % (rounded) | Risk | Sector | ISIN Code |
| ASI Strategic Bond | 10 | Low | Sterling Strategic Bond |
GB00BWK27X12
|
| BM Brooks Macdonald Defensive Capital | 5 | Low | Targeted Absolute Return |
GB00B61MR835
|
| Fidelity Emerging Europe Middle East and Africa | 9 | High | Specialist | GB00B87Z7808 |
| Fidelity Global Property | 5 | Medium | Property Other | GB00B7K2NZ09 |
| Fidelity UK Smaller Companies | 10 | High | UK Smaller Companies |
GB00B7VNMB18
|
| Fundsmith Equity | 7.5 | Medium | Global |
GB00B4Q5X527
|
| Invesco High Yield (UK) | 8 | Low | Sterling High Yield | GB00B3RW7649 |
| iShares Physical Gold ETC | 4 | Medium | Commodity & Energy ETF | IE00B4ND3602 |
| Marlborough European Multi-Cap | 6 | High | Europe Excluding UK | GB0001719730 |
| Premier Diversified Growth | 10.5 | Medium | Mixed Investment 40-85% Shares | GB00B8BJV423 |
| Slater Recovery | 6 | Medium | UK All Companies | GB0031554248 |
| SVS Sanlam North American Equity | 10.5 | Medium | North America | GB0007655698 |
| Wise Multi-Asset Growth | 8.5 | Medium | Flexible Investment | GB0034272533 |
My Portfolio asset mix
My portfolio asset mix is now as shown below which has around a 65% exposure to equities. Last month's figures are shown in brackets
-
- UK Equities 20% (20%)
- North American Equities 19% (15%)
- Asian/Emerging Market Equities 9% (6%)
- Japanese Equities 0% (0%)
- European Equities 6% (7%)
- Chinese equities 0% (0%)
- Other equity 5% (7%)
- Commodities and energy 5% (5%)
- UK Fixed Interest 3% (4%)
- Global Fixed Interest 14% (14%)
- Cash 5% (5%)
- Alternative Investment Strategies 8% (9%)
- Property 6% (8%)
Damien's higher risk and lower risk portfolios
Using the logic described in my post: Update to Damien’s alternative risk portfolios I created hypothetical higher and lower risk versions of my portfolio below:
Lower risk
| Fund | Allocation % |
| ASI Strategic Bond | 13 |
| BM Brooks Macdonald Defensive Capital | 7 |
| Fidelity Global Property | 7 |
| Fundsmith Equity | 10 |
| Invesco High Yield (UK) | 11 |
| iShares Physical Gold ETC | 5 |
| Premier Diversified Growth | 14 |
| Slater Recovery | 8 |
| SVS Sanlam North American Equity | 14 |
| Wise Multi-Asset Growth | 11 |
Higher risk
| Fund | Allocation % |
| Fidelity Emerging Europe Middle East and Africa | 12 |
| Fidelity Global Property | 6 |
| Fidelity UK Smaller Companies | 13 |
| Fundsmith Equity | 10 |
| iShares Physical Gold ETC | 5 |
| Marlborough European Multi-Cap | 8 |
| Premier Diversified Growth | 14 |
| Slater Recovery | 8 |
| SVS Sanlam North American Equity | 13 |
| Wise Multi-Asset Growth | 11 |

£200 Pension Cashback Offer
Make a qualifying deposit or transfer a pension to our partner Interactive Investor.
- Deposit or transfer a pension of at least £20k and you could earn £200 cashback
- Terms and Fees apply, Capital at risk
- New & Existing customers opening a SIPP
- Offer ends 31st July 2026
Before starting your transfer, check you won't lose any valuable benefits (such as guaranteed annuity rates or a lower protected pension age) and find out what exit fees you might have to pay
