

The background to my portfolio
Back in March 2015 I decided to invest £50,000 of my own money using 80-20 Investor. The purpose was twofold, firstly to show how you can use 80-20 Investor to invest and outperform the market with only a few minutes effort every now and then. Secondly, no other investment commentator, journalist or research provider invests their own money for fear of failing. This is a sorry state of affairs and is precisely why I committed to openly running my own portfolio for 80-20 Investor members to see.
Since then I have periodically changed my portfolio using the fund suggestions provided by the 80-20 Investor algorithm and associated research. I always disclose the changes at the time they are made.
Performance update
As is usual in my portfolio reviews, the chart below shows how my portfolio has outperformed since I started the challenge in March 2015, which is over seven years ago. The green line is the performance of my portfolio while the red line is the benchmark showing the average return achieved by professional fund managers given the same asset mix. To accurately calculate this I have used the average return for each sector in which my portfolio invested. The blue line shows what the average multi-asset fund with comparable equity content achieved. In other words, the red line would show the extra performance added by just the asset mix of my portfolio (where I was invested i.e European equities etc) over picking a typical multi-asset fund (the blue line). While the green line (which is my actual performance) shows the impact of being in the right funds at the right time, as identified by the 80-20 Investor algorithm.
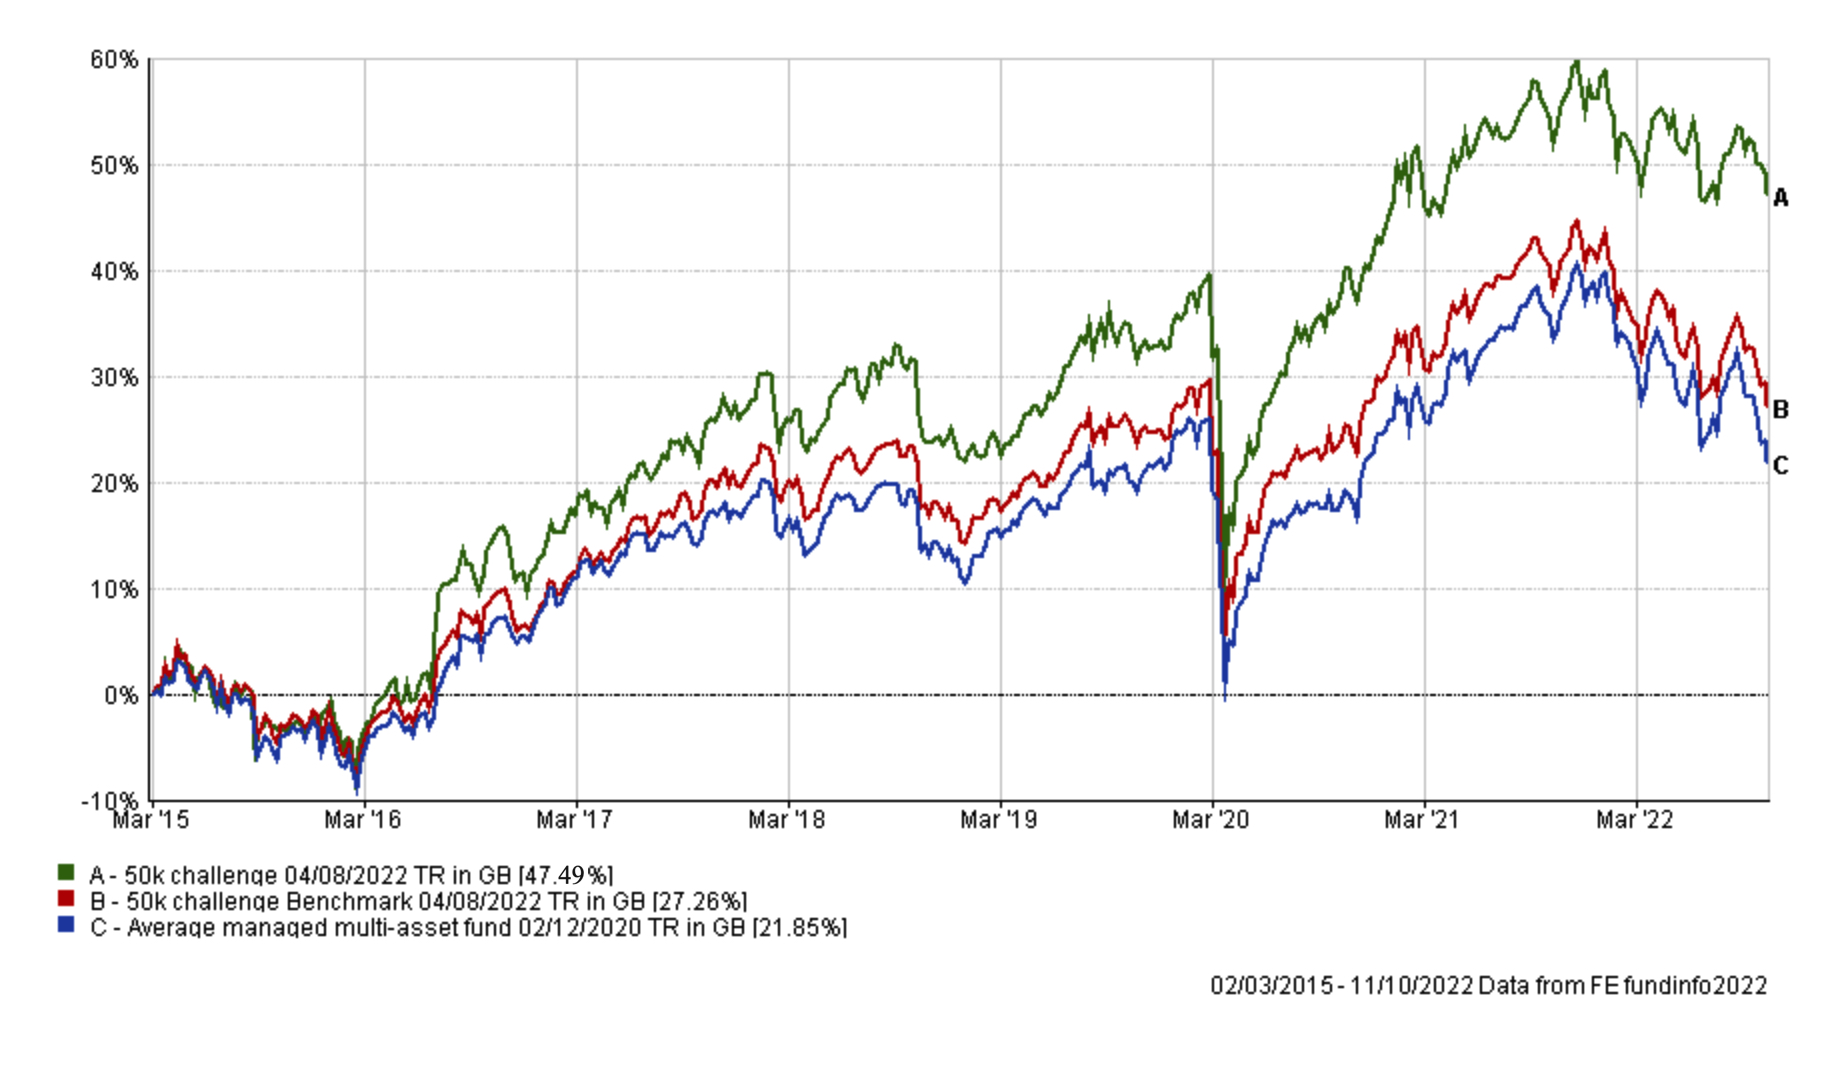
My portfolio continues to outperform its benchmarks over the long term and has in fact extended that outperformance. Since my last update at the start of September my £50k portfolio has outperformed its benchmarks as shown in the chart below. Of course, it has fallen in value as bonds and equity markets have crashed but on a relative basis the performance of the portfolio has been good.

The table below shows the individual performance of each holding in my portfolio since my last review on 5th September.
| Holding | % return since last review on 5th September |
| Thesis TM Tellworth UK Select | 1.13 |
| iShares Physical Gold ETC | 0.98 |
| BlackRock Natural Resources Growth & Income | 0.78 |
| Cash | 0.11 |
| Janus Henderson Inst Overseas Bond | -0.62 |
| McInroy & Wood Balanced | -0.99 |
| Premier Miton Defensive Growth | -2.25 |
| Troy Asset Management Ltd Trojan Ethical | -2.91 |
| Fidelity American Special Situations | -3.82 |
| JOHCM Global Opportunities | -4.15 |
| Fidelity Index US | -4.83 |
| M&G Global Dividend | -5.49 |
| Invesco UK Opportunities (UK) | -6.73 |
| Fidelity Global Property | -11.4 |
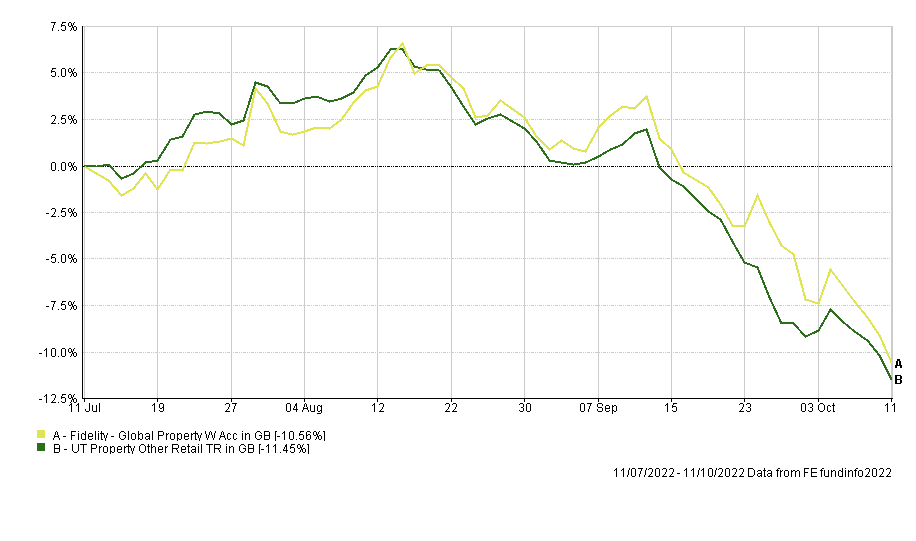
As you can see, the pattern is similar to August's with cash, gold and commodities outperforming. While the Thesis fund, which has some exposure to shorting equity markets (so benefits when equities fall), tops the table. At the bottom of the table you can see the pretty dismal performance of the Fidelity Global Property fund, which is reflective of the falls in property company shares more widely, which I will come onto later in this article.
Before I move on to look at each holding within my portfolio, within the context of the 80-20 Investor BOTB and BFBS tables, I want to take a moment to reflect on the performance of the portfolio as a whole. As long term 80-20 Investors know my portfolio's equity percentage has varied typically between 40% and 60% over time. The equity content within the portfolio has been around 60% since the post-pandemic rebound kicked into gear.
Because of the variability of my portfolio's equity/risk appetite I chart its performance in relation to the benchmarks shown above, which themselves mirror the changes in the equity content of my portfolio. So that way I ensure I'm comparing apples with apples. But I thought it an interesting exercise to put my portfolio's performance in the context of the wider professionally managed universe. Let's take the Mixed Investment 40-85% Shares sector as an example. It has more than 254 funds in it run by professional fund houses and managers that invest more than £104 billion for UK investors. The funds within this sector can have between 40-85% invested in equities, and of course most are skewed to the top end of that range, with anything above 60% equity exposure being the norm.
If I placed my own portfolio's year to date performance within the context of that sector it would rank 17th out of 254 funds, putting it in the top 7% of funds within that sector. The chart below shows the performance of my portfolio versus the Mixed Investment 40-85% Shares sector average so far in 2022.
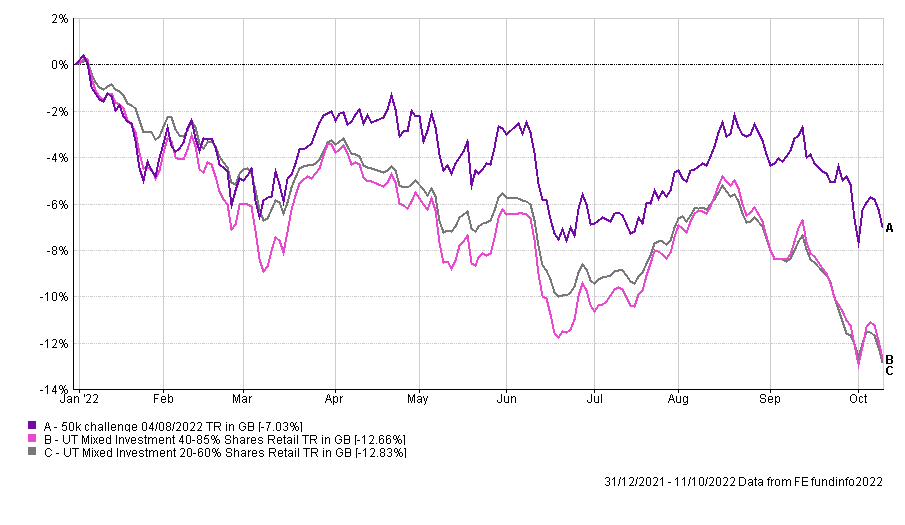
If we extend the comparison to include funds within the Mixed Investment 20-60% Shares sector, bringing the total number of funds to 443, then my portfolio would sit in the top 6% of professionally managed multi-asset funds. Obviously funds within the Mixed Investment 20-60% Shares sector have between 20% and 60% exposure to equities, with the rest of the assets typically invested in bonds but not exclusively so. Normally, during a market downturn funds from this sector would outperform those from the more adventurous Mixed Investment 40-85% Shares sector. But this year has been different because of the fall in bond markets.
Given the variability of the equity component of my portfolio, it would naturally reside somewhere between these two sectors. So given that fact, clearly the performance of my portfolio in 2022 has been a fantastic result. Of course it would be great if I hadn't lost money at all, but that would have required me to be sat in cash after using a crystal ball at the start of the year. So to attain that level of outperformance is good to see. A large part of the capital preservation can be put down to the lack of bond exposure as well as diversification into other asset classes such as cash and gold.
If we now look at the where my portfolio would be placed based on its performance since inception (7 and a half years ago) only 24 funds from a total of 252 (only 252 funds from the Mixed Investment 20-60% Shares sector and Mixed Investment 20-60% Shares sector were in existence in 2015) are outperforming me. That would put me in the top 10% of managers if I worked for a fund house.
The reason I am telling you this is because sometimes it's good to have a sense of context of how well or badly your portfolio is doing. Of those funds that are outperforming me they almost all have an equity exposure nearer the 85% level - so they should outperform a portfolio with a lower equity content over time. But of course there are funds with equity contents over 80% that I am outperforming.
Two stats that I have referred to in the past which are as important as % return in my view are Alpha and the Sharpe ratio. Just as a reminder, Alpha is a figure which measures a manager’s apparent skill at picking winning investments versus their benchmark. Alpha is the excess return versus the return of a fund’s benchmark (i.e the market). So a fund with a positive alpha indicates that the fund manager has outperformed through skill. While a negative alpha figure would indicate underperformance.
The Sharpe ratio is not a widely known statistic yet it indicates how much extra return a fund manager has achieved for the increased risk they have taken. There is nothing wrong with fund managers taking calculated investment risks if they result in additional returns for investors. So the higher a fund’s Sharpe ratio the better. Right now if my portfolio was to reside in the Mixed Investment 40-85% Shares sector of professionally managed funds it would be ranked 16th and 20th respectively for Alpha and Sharpe ratios (out of 139 funds) for the period since its inception 7 and a half years ago. That means that the 80-20 Investor process has managed risk better than most funds (including many with higher equity content) in order to produce the return it has achieved over the long term. Performing so well for these metrics is great and further confirms that continuing to manage risk and managing the portfolio in the current style is prudent - especially during one of the worst years for bond/equity investing on record.
By highlighting the above I am drawing a line in the sand, to highlight that while there will be periods of underperformance (which my portfolio has endured) they are part and parcel of momentum investing and over the long term you can still outperform, even when markets are in a downturn as they are now. Nothing is guaranteed and there will be periods in the future where perhaps my portfolio may lag (especially if bond markets explode higher or commodities crash) but it is about managing risks and I will make changes as new trends arise.
Now, as usual, the table below shows which funds within my portfolio are in the current BOTB or BFBS tables and which are not. Those funds in green are still in the BOTB while those in orange are not in the BOTB but remain in the BFBS list. Meanwhile, any funds in red have dropped out of both shortlists.
| Name | Allocation % (rounded) | Risk | Sector | ISIN Code |
| BlackRock Natural Resources Growth & Income | 4.00% | High | Commodity/Natural Resource | GB00B6865B79 |
| Cash | 6.50% | Low | ||
| Fidelity American Special Situations | 8.50% | Medium | North America | GB00B89ST706 |
| Fidelity Global Property | 8.00% | High | Property Other | GB00B7K2NZ09 |
| Fidelity Index US | 7.50% | High | North America | GB00BJS8SH10 |
| Invesco UK Opportunities (UK) | 5.00% | Medium | UK All Companies | GB00B1W7HM62 |
| iShares Physical Gold ETC | 5.00% | Medium | Commodity & Energy ETF | IE00B4ND3602 |
| Janus Henderson Inst Overseas Bond | 6.50% | Low | Global Bonds | GB0007673055 |
| JOHCM Global Opportunities | 10.25% | Medium | Global | GB00BJ5JMC04 |
| M&G Global Dividend | 6.50% | Medium | Global Equity Income | GB00B46J9127 |
| McInroy & Wood Balanced | 10.00% | Medium | Mixed Investment 40-85% Shares |
GB00B7RRJ163
|
| Premier Miton Defensive Growth | 9.00% | Low | Targeted Absolute Return | GB00B832BD89 |
| Thesis TM Tellworth UK Select | 5.25% | Low | Targeted Absolute Return | GB00BNY7YM73 |
| Troy Asset Management Ltd Trojan Ethical | 8.00% | Low | Flexible Investment | GB00BJP0XX17 |
So as you can see, there are five funds that have tumbled out of the 80-20 Investor tables - which are coloured red. Only Troy Trojan Ethical and Invesco UK Opportunities (UK) were in this situation last month. Ordinarily they would be my main focus of concern. However the charts below show how the five funds in red have performed against their respective sector averages over the last 3 months.
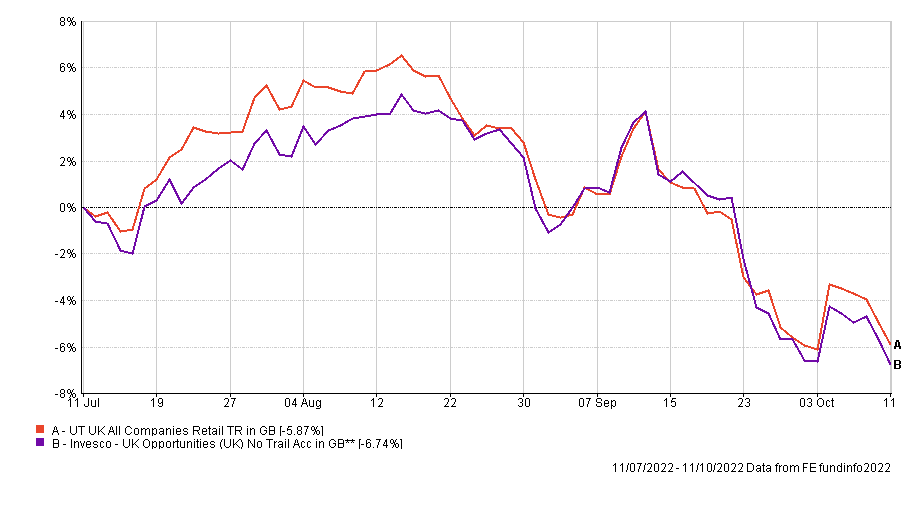
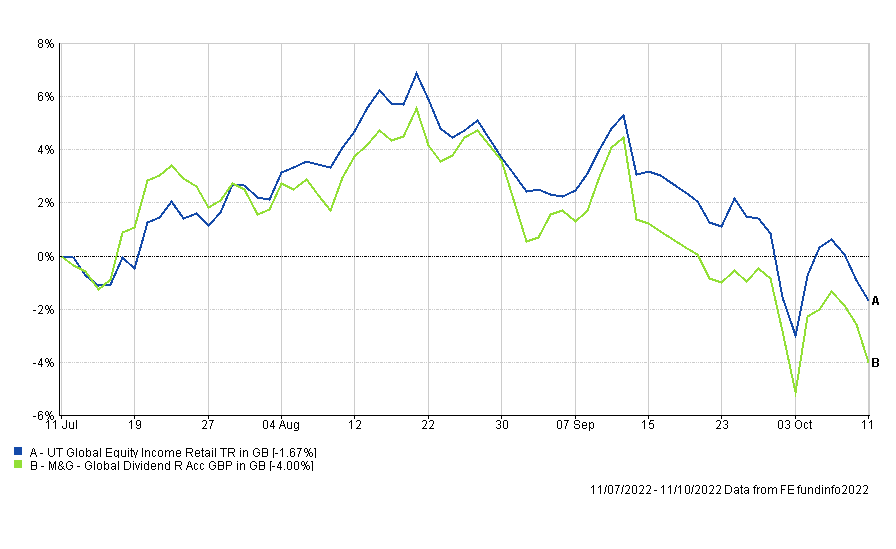
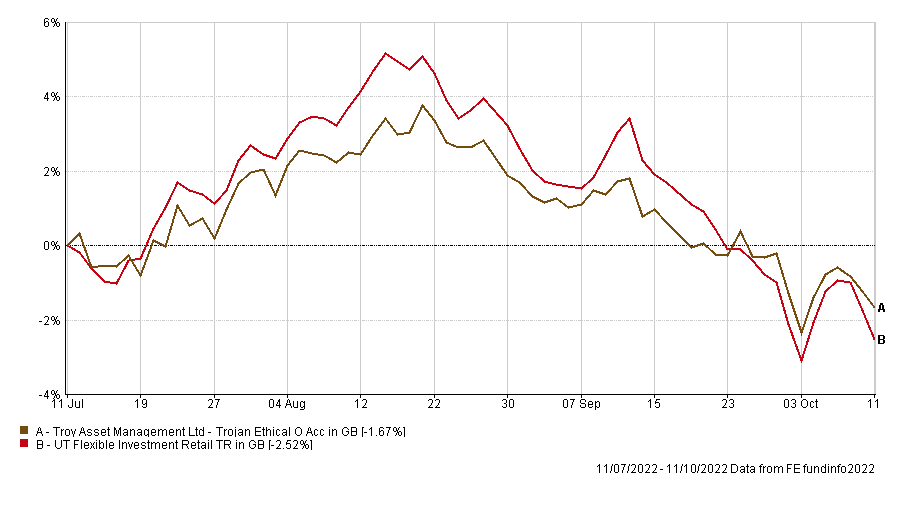
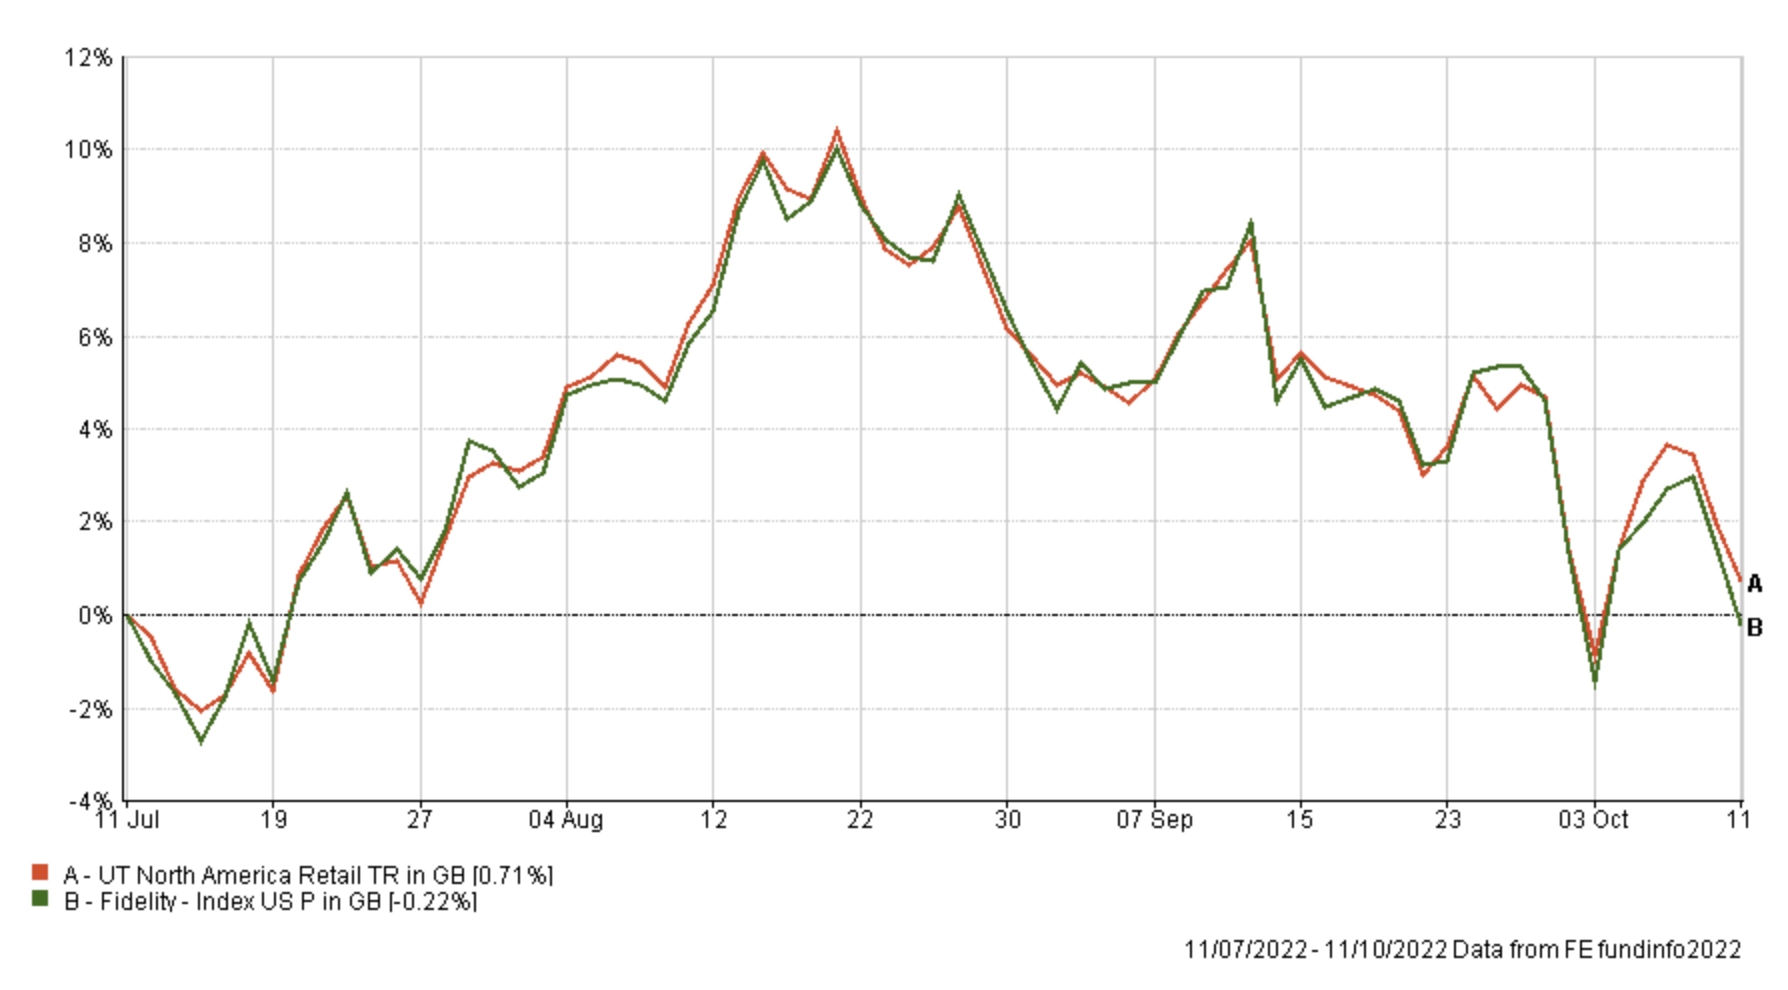
Four out of the five have performed in line with their peer group average to a large extent, with the exception being M&G Global Dividend. However, given the extreme volatility we are experiencing in markets, with almost daily interventions from the Bank of England, I am loathed to make changes to my portfolio, especially after the earlier demonstration of the portfolio's strong short term and long term performance. Of course this may change, but if you look at the BFBS lists you will notice that they are becoming thinner, due to stalling momentum across asset classes. So choice is becoming more limited.
So I think for now it is prudent to not make wholesale changes to my portfolio and review the situation again at the start of November. The exception to this is Fidelity Global Property. As shown earlier the entire property sector has tumbled as rising bond yields have pushed loan rates higher which in turn has hurt the property market (both residential and commercial). But on top of the poor performance (and also dropping out of the 80-20 Investor tables) the fund is earmarked to be merged with a stablemate from fidelity in December to form a new global equity fund which isn't property focused. As such, the fund will soon change remit anyway so this provides an additional reason to remove the fund from my portfolio.
Below is the only fund switch which I will be implementing this month
Fund switch
100% out of Fidelity Global Property and 100% into Jupiter Global Value Equity
By making the switch I am removing any property exposure from my portfolio and deviating slightly from the asset mix of the BOTB, but there is no viable alternative property fund within the BFBS tables. On top of that the BOTB has also already reduced its property exposure given the poor return. So I have instead chosen to move into a global equity fund from this month's BOTB, as an alternative. Think of the switch as moving from one global equity fund, which had a focus on property companies, to another global equity fund with a much broader remit.
The switch does introduce the tiniest exposure to Japanese equities, which is nice, but my asset mix has deviated from that of the BOTB, with my portfolio having more UK equity exposure and no emerging Asian equity exposure. But until the dust settles on markets I am happy to stick with the asset mix that I currently have.
My portfolio
My portfolio now looks like this:
| Name | Allocation % (rounded) | Risk | Sector | ISIN Code |
| BlackRock Natural Resources Growth & Income | 4.50% | High | Commodity/Natural Resource | GB00B6865B79 |
| Cash | 6.75% | Low | ||
| Fidelity American Special Situations | 8.50% | Medium | North America | GB00B89ST706 |
| Fidelity Index US | 7.50% | High | North America | GB00BJS8SH10 |
| Invesco UK Opportunities (UK) | 4.75% | Medium | UK All Companies | GB00B1W7HM62 |
| iShares Physical Gold ETC | 5.00% | Medium | Commodity & Energy ETF | IE00B4ND3602 |
| Janus Henderson Inst Overseas Bond | 7.00% | Low | Global Bonds | GB0007673055 |
| JOHCM Global Opportunities | 10.25% | Medium | Global | GB00BJ5JMC04 |
| Jupiter Global Value Equity | 7.00% | Medium | Global | GB00BF5DRF26 |
| M&G Global Dividend | 6.50% | Medium | Global Equity Income | GB00B46J9127 |
| McInroy & Wood Balanced | 9.50% | Medium | Mixed Investment 40-85% Shares |
GB00B7RRJ163
|
| Premier Miton Defensive Growth | 9.25% | Low | Targeted Absolute Return | GB00B832BD89 |
| Thesis TM Tellworth UK Select | 5.50% | Low | Targeted Absolute Return | GB00BNY7YM73 |
| Troy Asset Management Ltd Trojan Ethical | 8.00% | Low | Flexible Investment | GB00BJP0XX17 |
My Portfolio asset mix
My portfolio asset mix has around 59% exposure to equities. Last month's figures are shown in brackets.
-
- UK Equities 13% (12%)
- North American Equities 23% (22%)
- Asian/Emerging Market Equities 0% (0%)
- Japanese Equities 1% (0%)
- European Equities 6% (4%)
- Chinese equities 0% (0%)
- Other equity 10% (8%)
- Commodities and energy 10% (9%)
- UK Fixed Interest 0% (0%)
- Global Fixed Interest 10% (11%)
- Cash 7% (6%)
- Alternative Investment Strategies 20% (20%)
- Property 0% (8%)
Damien's higher risk and lower risk portfolios
Using the logic described in my post: Update to Damien’s alternative risk portfolios I created hypothetical higher and lower risk versions of my portfolio below:
Lower risk
| Fund | Allocation % |
| Cash | 8 |
| Fidelity American Special Situations | 10 |
| Invesco UK Opportunities (UK) | 5 |
| iShares Physical Gold ETC | 6 |
| Janus Henderson Inst Overseas Bond | 8 |
| JOHCM Global Opportunities | 11 |
| Jupiter Global Value Equity | 8 |
| M&G Global Dividend | 7 |
| McInroy & Wood Balanced | 11 |
| Premier Miton Defensive Growth | 11 |
| Thesis TM Tellworth UK Select | 6 |
| Troy Asset Management Ltd Trojan Ethical | 9 |
Higher risk
| Fund | Allocation % |
| BlackRock Natural Resources Growth & Income | 7 |
| Fidelity American Special Situations | 13 |
| Fidelity Index US | 12 |
| Invesco UK Opportunities (UK) | 7 |
| iShares Physical Gold ETC | 8 |
| JOHCM Global Opportunities | 16 |
| Jupiter Global Value Equity | 11 |
| M&G Global Dividend | 10 |
| McInroy & Wood Balanced | 16 |

£200 Pension Cashback Offer
Make a qualifying deposit or transfer a pension to our partner Interactive Investor.
- Deposit or transfer a pension of at least £20k and you could earn £200 cashback
- Terms and Fees apply, Capital at risk
- New & Existing customers opening a SIPP
- Offer ends 31st July 2026
Before starting your transfer, check you won't lose any valuable benefits (such as guaranteed annuity rates or a lower protected pension age) and find out what exit fees you might have to pay
