

The background to my portfolio
Back in March 2015 I decided to invest £50,000 of my own money using 80-20 Investor. The purpose was twofold, firstly to show how you can use 80-20 Investor to invest and outperform the market with only a few minutes effort every now and then. Secondly, no other investment commentator, journalist or research provider invests their own money for fear of failing. This is a sorry state of affairs and is precisely why I committed to openly running my own portfolio for 80-20 Investor members to see.
Since then I have periodically changed my portfolio using the fund suggestions provided by the 80-20 Investor algorithm and associated research. I always disclose the changes at the time they are made.
Performance update
As is usual in my portfolio reviews, the chart below shows how my portfolio has outperformed since I started the challenge in March 2015. The green line is the performance of my portfolio while the red line is the benchmark showing the average return achieved by professional fund managers given the same asset mix. To accurately calculate this I have used the average return for each sector in which my portfolio invested. The blue line shows what the average multi-asset fund with comparable equity content achieved. In other words, the red line would show the extra performance added by just the asset mix of my portfolio (where I was invested i.e European equities etc) over picking a typical multi-asset fund (the blue line). While the green line (which is my actual performance) shows the impact of being in the right funds at the right time, as identified by the 80-20 Investor algorithm.
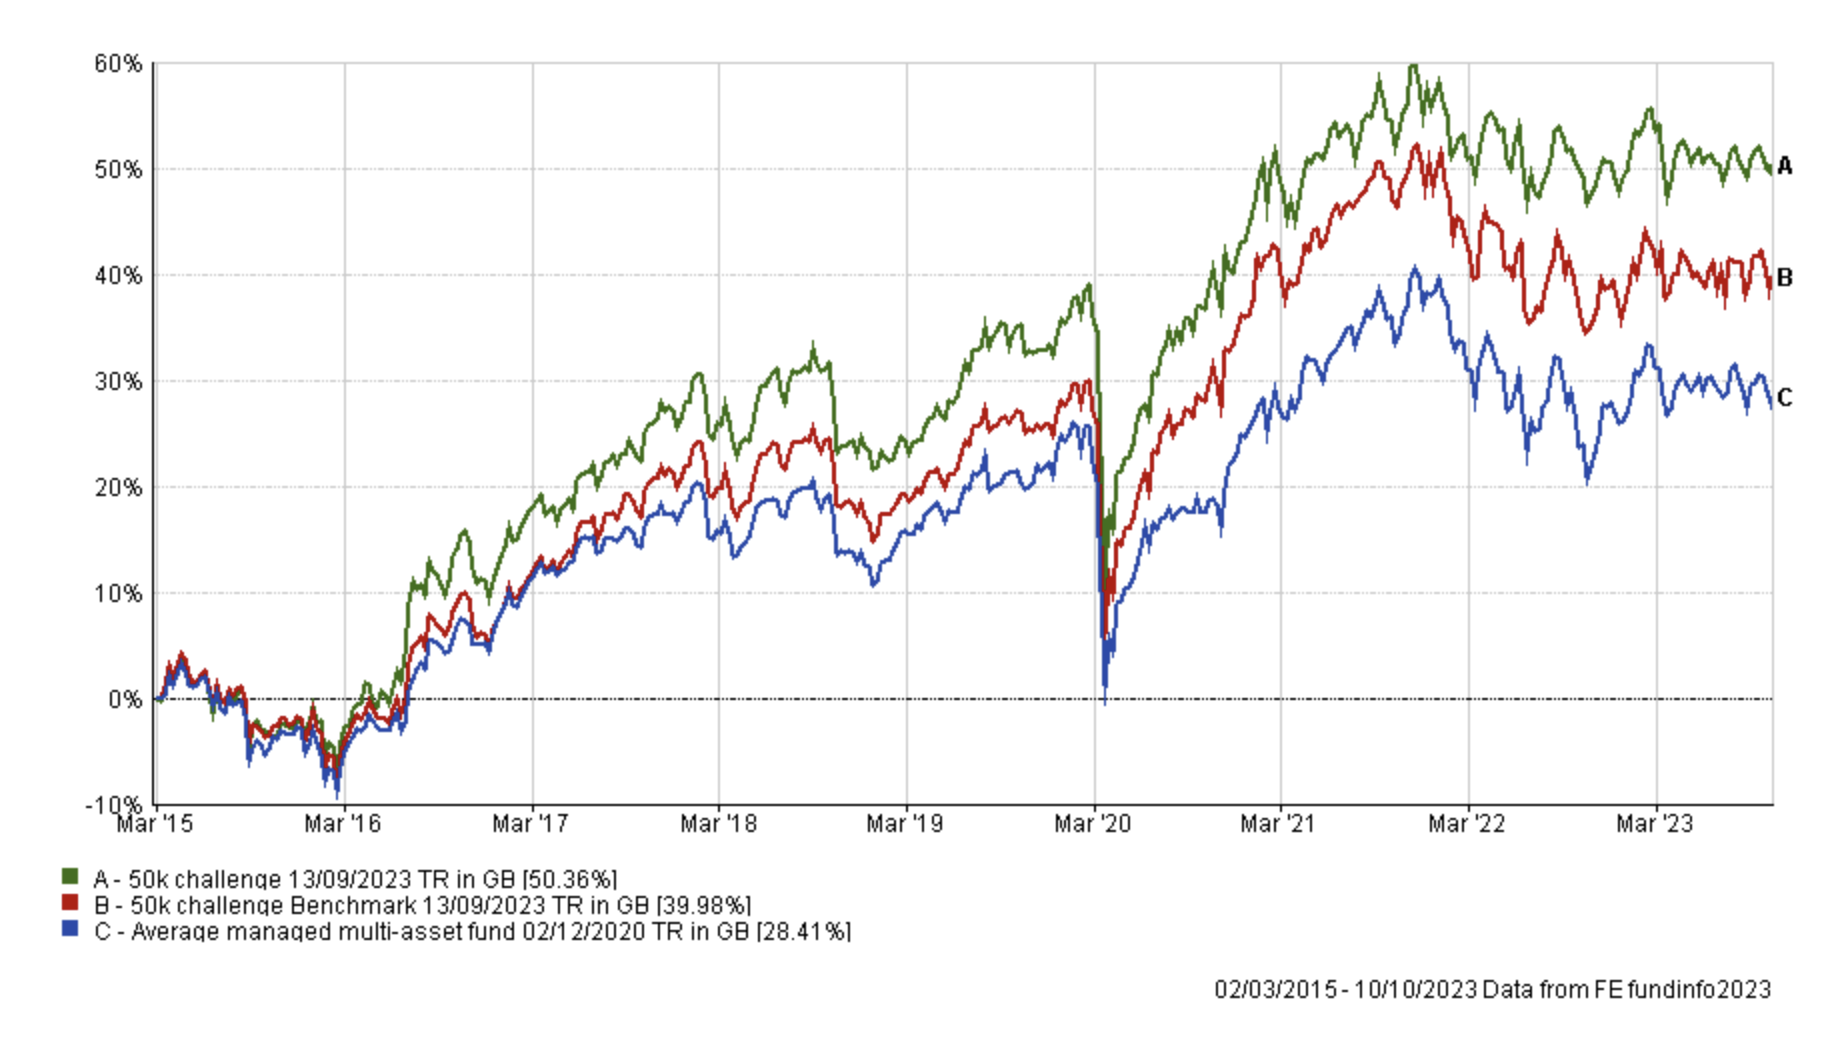
As the chart above shows, my portfolio continues to outperform its benchmarks over the last 8 years. Since my last review, my portfolio has marginally outperformed its benchmarks, benefiting most from its limited bond exposure.
Over the last month pretty much anything you held would've lost money with the exception of cash as shown in the table below. This is because bond and equity markets fell in tandem, reminiscent of 2022. The Thesis fund performed the best as it can go 'short' of the market which is why it benefited during the recent bout of stock market and bond market weakness. Interestingly, over the last few months the fund has either topped or bottomed the performance chart for my portfolio. Meanwhile, those funds with US exposure benefited from the fall in the pound which helped contain any losses. Among the biggest performance drags were Fundsmith Equity and CT European Select once again.
| Name | % since the 7th of September 2023 |
| Thesis TM Tellworth UK Select | 2.6 |
| Cash | 0.31 |
| T. Rowe Price US Large Cap Growth Equity | -0.1 |
| BNY Mellon Multi-Asset Balanced | -0.2 |
| abrdn High Yield Bond | -0.62 |
| BNY Mellon Global Dynamic Bond | -0.71 |
| Troy Asset Management Ltd Trojan Global Equity | -0.85 |
| WS Saracen Global Income and Growth | -1.19 |
| Fidelity Index Japan | -1.27 |
| iShares Physical Gold ETC | -1.48 |
| Fidelity American | -1.59 |
| Fundsmith Equity | -2.24 |
| CT European Select | -2.6 |
As usual the table below shows which funds within my portfolio are in the current BOTB or BFBS tables and which are not. Those funds in blue are still in the BOTB while those in orange are not in the BOTB but remain in the BFBS list. Meanwhile, any funds in red have dropped out of both shortlists.
| Fund | Allocation | Risk | Sector | ISIN |
| abrdn High Yield Bond | 12 | Lower | Sterling High Yield | GB00B79RR984 |
| BNY Mellon Global Dynamic Bond | 8.5 | Lower | Targeted Absolute Return | GB00B8K10865 |
| BNY Mellon Multi-Asset Balanced | 6 | Medium | Mixed Investment 40-85% Shares | GB00B8K9JZ06 |
| Cash | 7 | Lower | ||
| CT European Select | 6 | Higher | Europe Excluding UK | GB0001529345 |
| Fidelity American | 10 | Medium | North America | GB00B8GPC429 |
| Fidelity Index Japan | 5 | Medium | Japan | GB00BHZK8872 |
| Fundsmith Equity | 10 | Medium | Global | GB00B4Q5X527 |
| iShares Physical Gold ETC | 5 | Medium | Commodity & Energy ETF | IE00B4ND3602 |
| T. Rowe Price US Large Cap Growth Equity | 5 | Higher | North America | GB00BD5FHW12 |
| TB Saracen Global Income & Growth | 9.5 | Medium | Global Equity Income | GB00B5B35X02 |
| Thesis TM Tellworth UK Select | 5.5 | Lower | Targeted Absolute Return | GB00BNY7YM73 |
| Troy Asset Management Ltd Trojan Global Equity | 10.5 | Medium | Global | GB00B0ZJ5S47 |
Just three funds are now outside out the BOTB and BFBS tables and are coloured in red. These are:
- Fundsmith Equity
- CT European Select
- BNY Mellon Global Dynamic Bond
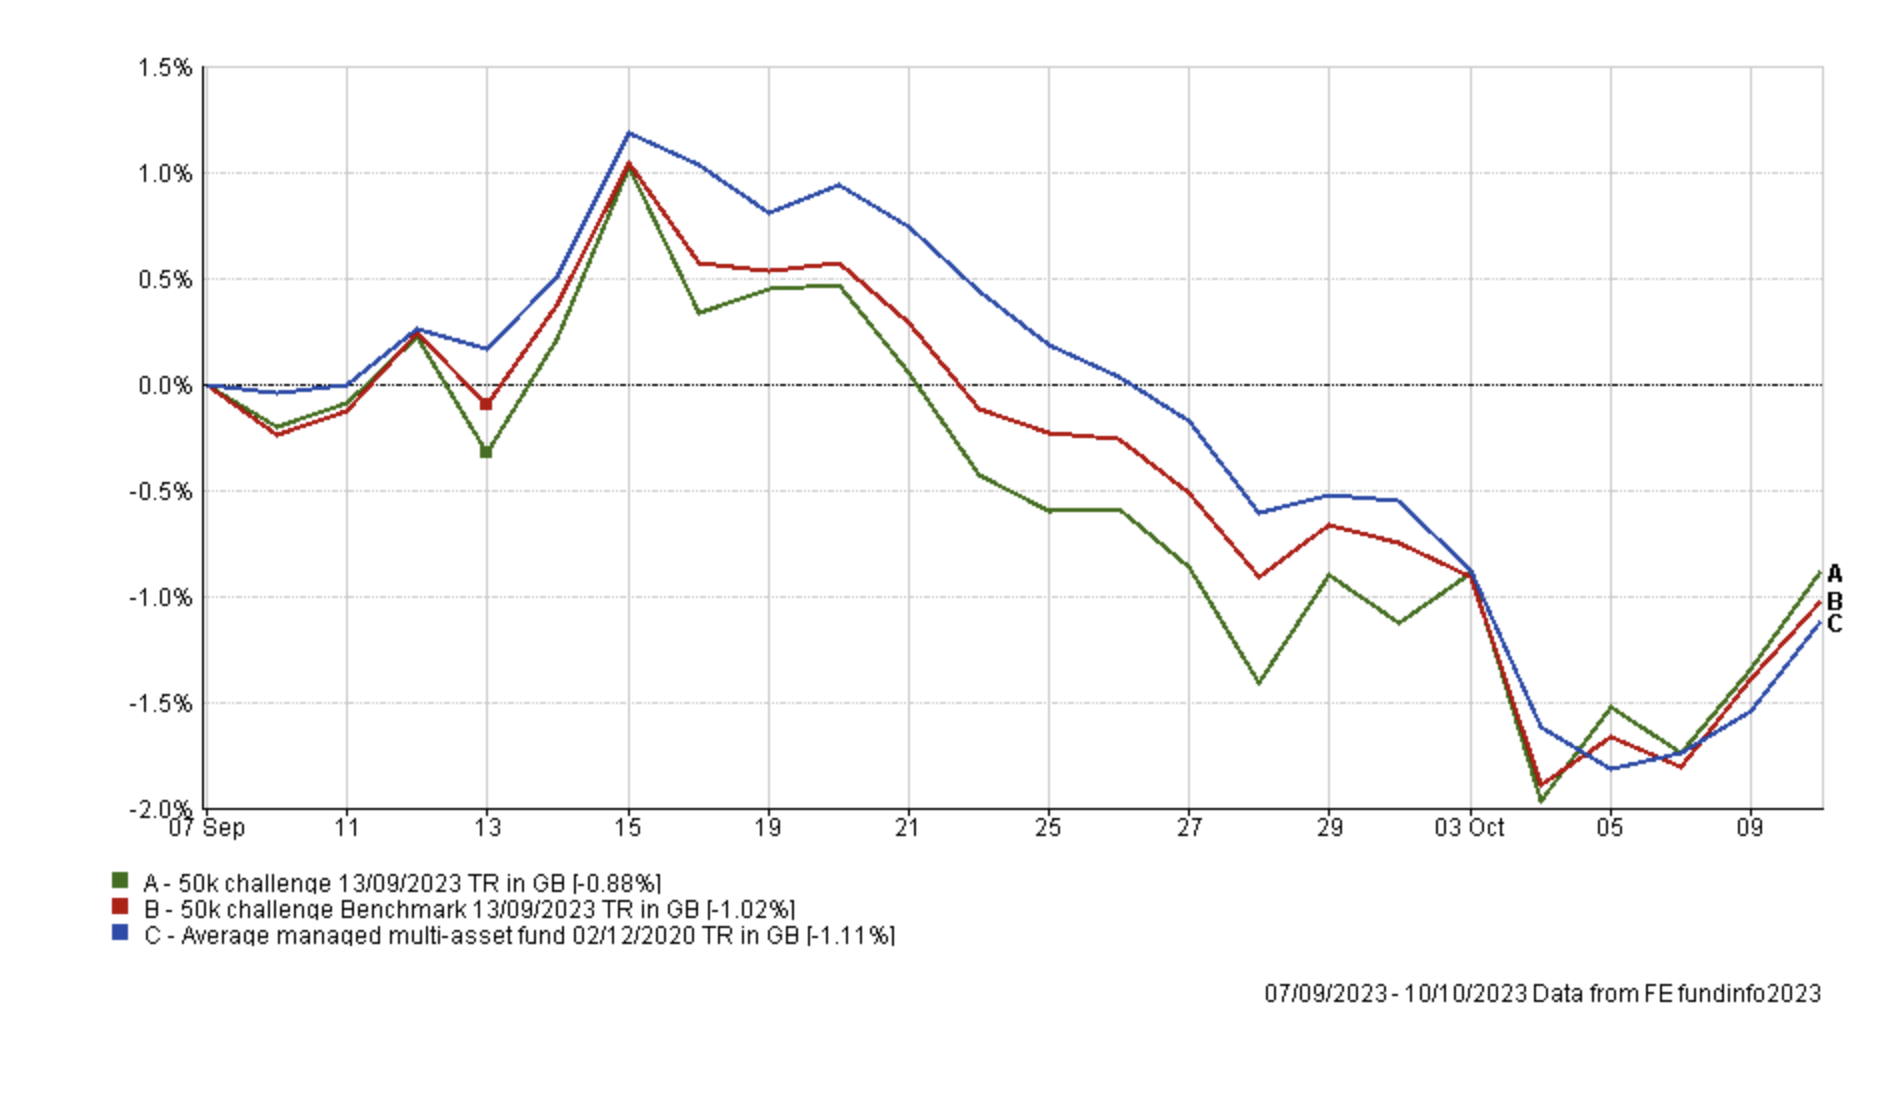
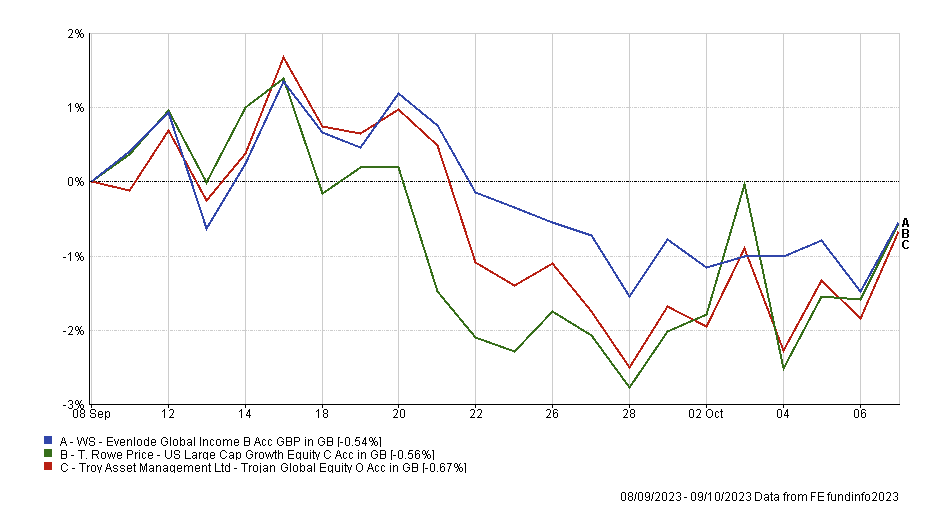
If you recall last time I took a wait-and-see approach due to the continued market volatility and sector rotations we'd been experiencing. I did make one fund switch, whereby I moved 100% out of TB Evenlode Global Income and 25% into Troy Asset Management Ltd Trojan Global Equity and 75% into T. Rowe Price US Large Cap Growth Equity. As you can see from the chart below for most of the month it was to the detriment of the portfolio's performance but in the last few days all three funds have performed in line so it's too early to say whether it was a profitable decision or not.
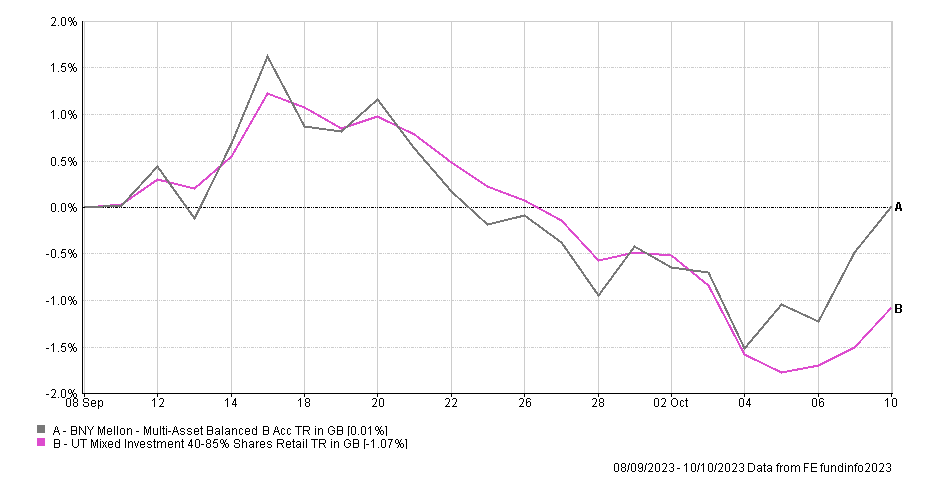
Before I move on to the funds that sit outside of the BOTB and BFBS tables I just want to mention BNY Mellon Multi-Asset Balanced which was given a stay of execution last month and the decision was justified as shown by the chart below which shows the performance over the last month. The fund is a member of the Consistent funds list and is a top quartile performer within its sector (Mixed investment 40 to 85% shares) of over 250 funds over 1 month, 3 months, 6 months, 1 year, 3 year, 5 year and 10 year timeframes. It has also just regained a spot in the BFBS table.
So looking at the three funds outside of the BOTB and BFBS tables one of them is the same as last month, that is Fundsmith Equity. The Fundsmith Equity fund has been outside of the BOTB and BFBS tables for some months now and so it's time to replace it within my portfolio. I plan to replace it with L&G Global 100 Index Trust, another global fund, which is in the latest BOTB table and tracks the performance of the S&P Global 100 Index. While the new fund is another global fund its make-up is very different (as its a tracker fund) and as such will significantly increase my exposure to some of the largest tech companies in the US. This is something I have been mindful of when making other changes this month, so as to not overexpose my portfolio to this area of the market.
Also, in recent months I have reduced my exposure to CT European Select and, as shown in the earlier table, it continues to be a drag on my portfolio so I've made the decision to finally remove it altogether. This will not only hopefully remove a drag on my portfolio but also bring my asset mix more in line with that of the BOTB. Of course I accept the risk in doing this, for example if China decides to embark on a huge stimulus programme this would be good news for European equities, but my portfolio will benefit to a much lesser extent. However, the 80-20 Investor process is not built on hope. So instead I plan to move some of the proceeds into an area that has shown strong momentum in recent months, namely Indian equities. I have chosen the Liontrust India fund which is in the current BOTB. I also plan to spread the rest of the proceeds across my existing global equity funds to bolster my portfolio's equity content without significantly increasing my exposure to large US tech stocks further. The move will also slightly increase my Japanese equity exposure, again reflecting the recent changes in the BOTB.
That then leaves BNY Mellon Global Dynamic Bond, which resides in the lower risk portion of my portfolio. Given that it's only just dropped out of the BFBS table in the last few weeks and the extreme volatility we've been experiencing in bond markets I think it is prudent to maintain some exposure to this holding until next time when hopefully we have more clarity on the direction of bond markets. If you look at the range of performances between the lower risk funds within the 80-20 Investor tables there is not a huge difference between many of them in the current volatile market, including BNY Mellon Global Dynamic Bond. However, I will reduce my exposure to this fund in favour of its better performing stablemate in my portfolio, BNY Mellon Multi-Asset Balanced.
Last month I put the recent performance of my portfolio into context to show how well it had performed during a turbulent August. If I carry out the same exercise today, but instead use performance since my August review (therefore including September and the start of October) then once again my portfolio has performed well during a difficult time for UK investors. Taking the two unit trust sectors of professionally managed multi-asset funds, namely the Mixed Investment 20-60% Shares sector and the Mixed Investment 40-85% Shares sector, the average fund performance in each sector during the period has been -1.55% for the former and -1.48% for the latter. This compares to -0.38% from my portfolio.
So my portfolio is still working in the current volatile environment which is why I am not changing any other holdings within my portfolio this time around. You may recall that last month I said I was still sitting on some cash awaiting opportunities to re-invest. However, given the strong performance of cash over the last month I will maintain my cash exposure at its current level for now.
Fund switches
- 100% out of Fundsmith Equity and 100% into L&G Global 100 Index Trust
- 25% out of BNY Mellon Global Dynamic Bond and 100% into BNY Mellon Multi-Asset Balanced
- 100% out of CT European Select and...
- 60% into Liontrust India
- 10% into Fidelity Index Japan
- 10% into T. Rowe Price US Large Cap Growth Equity Japan,
- 10% into TB Saracen Global Income & Growth
- 10% into Troy Asset Management Ltd Trojan Global Equity
The fund changes mean that the number of holdings within my portfolio will remain the same. The switches only impact approximately 18% of my portfolio while my portfolio's equity exposure will be approximately 61%.
My portfolio
My portfolio now looks like this:
| Fund | Allocation | Risk | Sector | ISIN |
| abrdn High Yield Bond | 12 | Lower | Sterling High Yield | GB00B79RR984 |
| BNY Mellon Global Dynamic Bond | 6 | Lower | Targeted Absolute Return | GB00B8K10865 |
| BNY Mellon Multi-Asset Balanced | 8.5 | Medium | Mixed Investment 40-85% Shares | GB00B8K9JZ06 |
| Cash | 7 | Lower | ||
| Fidelity American | 10 | Medium | North America | GB00B8GPC429 |
| Fidelity Index Japan | 6 | Medium | Japan | GB00BHZK8872 |
| iShares Physical Gold ETC | 5 | Medium | Commodity & Energy ETF | IE00B4ND3602 |
| T. Rowe Price US Large Cap Growth Equity | 5.5 | Higher | North America | GB00BD5FHW12 |
| L&G Global 100 Index Trust | 10 | Medium | Global | GB00B0CNH056 |
| Liontrust India | 3.5 | Higher | India/Indian Subcontinent | GB00B1L6DV51 |
| Thesis TM Tellworth UK Select | 5.5 | Lower | Targeted Absolute Return | GB00BNY7YM73 |
| Troy Asset Management Ltd Trojan Global Equity | 11 | Medium | Global | GB00B0ZJ5S47 |
| WS Saracen Global Income & Growth* | 10 | Medium | Global Equity Income | GB00B5B35X02 |
* note that the TB Saracen Global Income & Growth fund has changed its name to WS Saracen Global Income & Growth.
My Portfolio asset mix
My portfolio asset mix has around 63% exposure to equities. Last month's figures are shown in brackets.
-
- UK Equities 5% (9%)
- North American Equities 28% (29%)
- Asian/Emerging Market Equities 4% (0%)
- Japanese Equities 6% (5%)
- European Equities 7% (13%)
- Chinese equities 0% (0%)
- Other equity 11% (7%)
- Commodities and energy 5% (5%)
- UK Fixed Interest 0% (0%)
- Global Fixed Interest 18% (20%)
- Cash 7% (8%)
- Alternative Investment Strategies 9% (4%)
- Property 0% (0%)
Damien's higher risk and lower risk portfolios
Using the logic described in my post: Update to Damien’s alternative risk portfolios I created hypothetical higher and lower risk versions of my portfolio below:
Lower risk
| Fund | Allocation % |
| abrdn High Yield Bond | 13 |
| BNY Mellon Global Dynamic Bond | 7 |
| BNY Mellon Multi-Asset Balanced | 9 |
| Cash | 8 |
| Fidelity American | 11 |
| Fidelity Index Japan | 7 |
| iShares Physical Gold ETC | 5 |
| L&G Global 100 Index Trust | 11 |
| Thesis TM Tellworth UK Select | 6 |
| Troy Asset Management Ltd Trojan Global Equity | 12 |
| WS Saracen Global Income & Growth | 11 |
Higher risk
| Fund | Allocation % |
| BNY Mellon Multi-Asset Balanced | 12 |
| Fidelity American | 14 |
| Fidelity Index Japan | 9 |
| iShares Physical Gold ETC | 7 |
| T. Rowe Price US Large Cap Growth Equity | 8 |
| L&G Global 100 Index Trust | 14 |
| Liontrust India | 5 |
| Troy Asset Management Ltd Trojan Global Equity | 16 |
| WS Saracen Global Income & Growth | 15 |

£200 Pension Cashback Offer
Make a qualifying deposit or transfer a pension to our partner Interactive Investor.
- Deposit or transfer a pension of at least £20k and you could earn £200 cashback
- Terms and Fees apply, Capital at risk
- New & Existing customers opening a SIPP
- Offer ends 31st July 2026
Before starting your transfer, check you won't lose any valuable benefits (such as guaranteed annuity rates or a lower protected pension age) and find out what exit fees you might have to pay
