

The background to my portfolio
Back in March 2015 I decided to invest £50,000 of my own money using 80-20 Investor. The purpose was twofold, firstly to show how you can use 80-20 Investor to invest and outperform the market with only a few minutes effort every now and then. Secondly, no other investment commentator, journalist or research provider invests their own money for fear of failing. This is a sorry state of affairs and is precisely why I committed to openly running my own portfolio for 80-20 Investor members to see.
Since then I have periodically changed my portfolio using the fund suggestions provided by the 80-20 Investor algorithm and associated research. I always disclose the changes at the time they are made.
Performance update
As is usual in my portfolio reviews, the chart below shows how my portfolio has outperformed since I started the challenge in March 2015. The green line is the performance of my portfolio while the red line is the benchmark showing the average return achieved by professional fund managers given the same asset mix. To accurately calculate this I have used the average return for each sector in which my portfolio invested. The blue line shows what the average multi-asset fund with comparable equity content achieved. In other words, the red line would show the extra performance added by just the asset mix of my portfolio (where I was invested i.e European equities etc) over picking a typical multi-asset fund (the blue line). While the green line (which is my actual performance) shows the impact of being in the right funds at the right time, as identified by the 80-20 Investor algorithm.
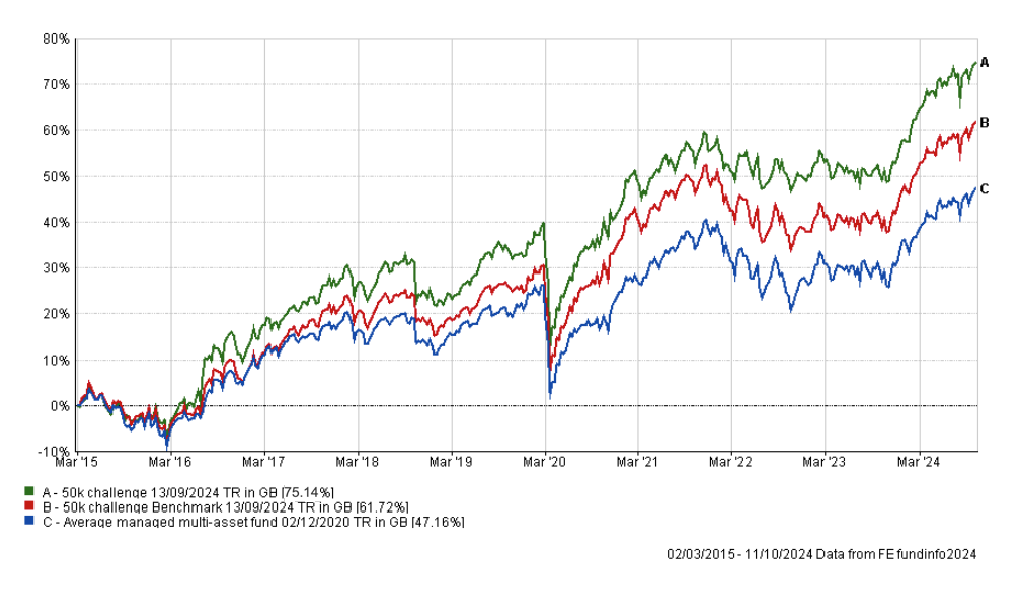

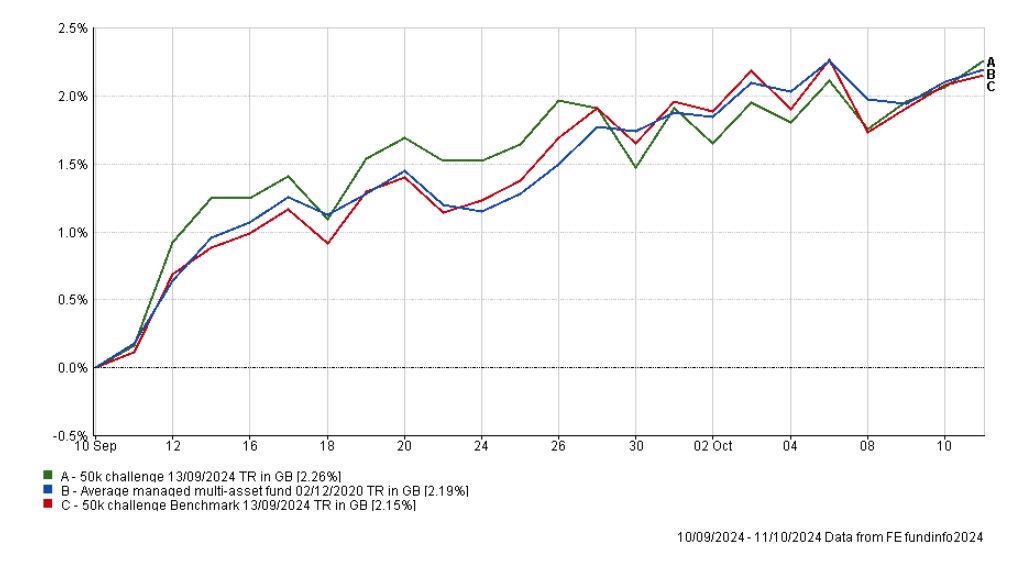
You can see how my portfolio continues to significantly outperform its benchmarks despite the volatile environment we find ourselves in currently. The chart below shows the performance of my portfolio versus its benchmarks since my last review a month ago..

The table below shows how individual funds performed within my portfolio during the period. US large caps, Asian equities and Gold all enjoyed strong months thanks to monetary stimulus measures announced by central banks in the US and China. At the opposite end of the scale, UK smaller companies have struggled due to increasing concerns about the upcoming autumn Budget and the outlook for the UK economy.
| Name | % return over the last month (since September review) |
| T. Rowe Price US Large Cap Growth Equity | 6.91 |
| Artemis Global Income | 5.73 |
| iShares Physical Gold ETC | 5.52 |
| Jupiter Asian Income | 3.8 |
| Aviva Inv Global Equity Income | 2.69 |
| Schroder European Recovery | 2.66 |
| Fidelity Index Japan | 2.62 |
| BNY Mellon Multi-Asset Balanced | 1.77 |
| Ninety One UK Special Situations | 1.25 |
| abrdn High Yield Bond | 0.8 |
| Liontrust India | 0.66 |
| Schroder Strategic Credit | 0.61 |
| Thesis TM Tellworth UK Select | -0.63 |
| Schroder UK Smaller Companies | -4.15 |
As usual, the table below shows which funds within my portfolio are in the current BOTB or BFBS tables and which are not. Those funds in blue are still in the BOTB while those in orange are not in the BOTB but remain in the BFBS list. Meanwhile, any funds in red have dropped out of both shortlists.
| Fund | Allocation | Risk | Sector | ISIN |
| abrdn High Yield Bond | 14 | Lower | Sterling High Yield | GB00B79RR984 |
| Artemis Global Income | 11 | Medium | Global Equity Income | GB00B5N99561 |
| Aviva Inv Global Equity Income | 10 | Medium | Global Equity Income | GB0030441918 |
| BNY Mellon Multi-Asset Balanced | 8 | Medium | Mixed Investment 40-85% Shares | GB00B8K9JZ06 |
| Fidelity Index Japan | 3 | Medium | Japan | GB00BHZK8872 |
| iShares Physical Gold ETC | 5.5 | Medium | Commodity & Energy ETF | IE00B4ND3602 |
| Jupiter Asian Income | 5 | Higher | Asia Pacific Excluding Japan | GB00BZ2YML94 |
| Liontrust India | 6 | Higher | India/Indian Subcontinent | GB00B1L6DV51 |
| Ninety One UK Special Situations | 7.5 | Higher | UK All Companies | GB00B1XFJS91 |
| Schroder European Recovery | 4.5 | Higher | Europe Excluding UK | GB0007221889 |
| Schroder Strategic Credit | 8 | Lower | Sterling Strategic Bond | GB00BJZ2ZC09 |
| Schroder UK Smaller Companies | 6 | Higher | UK Smaller Companies | GB00B76V7Z98 |
| T. Rowe Price US Large Cap Growth Equity | 6 | Higher | North America | GB00BD5FHW12 |
| Thesis TM Tellworth UK Select | 5.5 | Lower | Targeted Absolute Return | GB00BNY7YM73 |
This month four funds are coloured red but, as the earlier charts prove, the diversification within my portfolio has helped its performance once again,
Below is a list of the 'red' funds that have fallen out of both the BOTB and BFBS tables (the funds in bold were also in last month's red list):
- Ninety One UK Special Situations
- BNY Mellon Multi-Asset Balanced
- Jupiter Asian Income
- Schroder European Recovery
This list is smaller than last month when there were six funds that had dropped out of the BOTB and BFBS tables. Before I continue with this month's portfolio review I just want to use last month's fund switches to demonstrate how you can "win some and lose some".
If you recall last month I made the following switches.
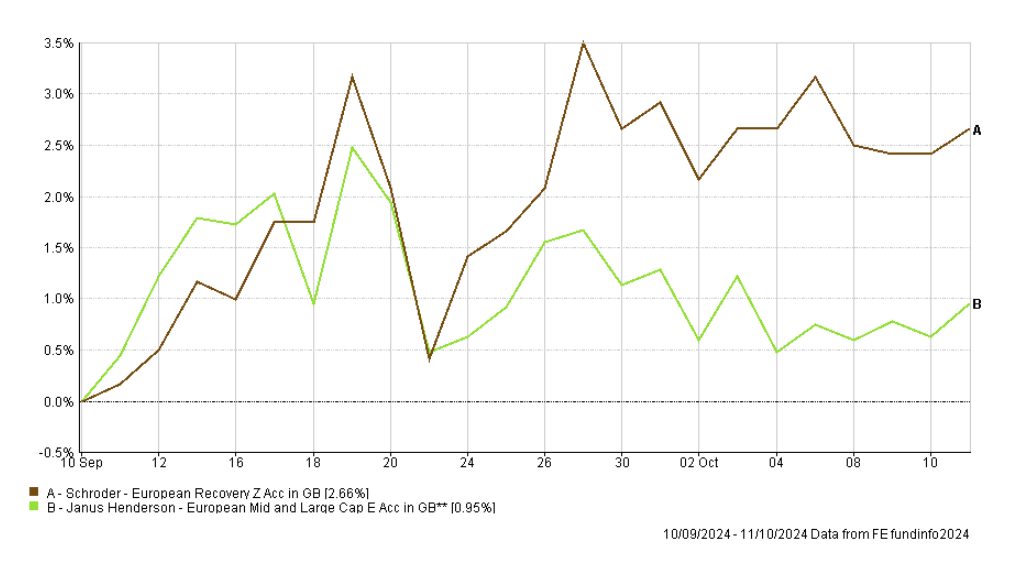
- 100% out of Janus Henderson European Mid and Large Cap and 100% into the Schroder European Recovery
- 100% out of Artemis US Select and 100% into the Jupiter Asian Income
The first chart compares the performance of Schroder European Recovery versus Janus Henderson European Mid and Large Cap which it replaced and as you can see the new fund outperformed the Janus fund.

However, despite Jupiter Asian Income being one of the top performing funds within my portfolio over the last month, Artemis US Select, which it replaced, performed even better thanks to a rebound in US tech stocks.
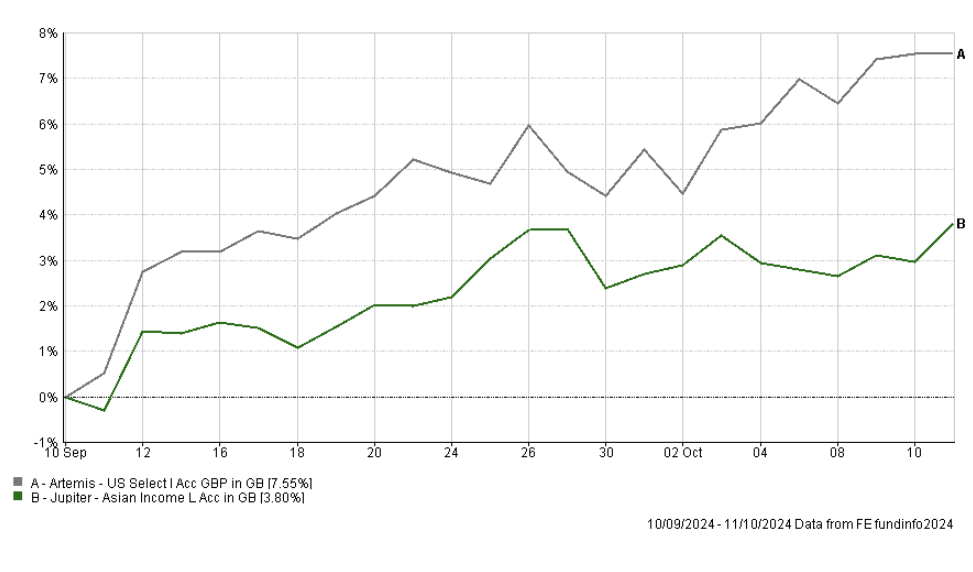

Obviously despite "losing" in the latter trade I can hardly be upset with a 3.8% return in a single month.
Moving on, one interesting development over the last month has been the impact the proposed Chinese stimulus measures have had on investment markets. This has even been reflected in October's BOTB which now includes a Chinese equity fund as well as increased emerging market equity exposure. Given the uncertainty and volatility we've seen surrounding Chinese equities I don't propose to invest directly into a Chinese equity fund this month but instead increase my emerging market and Chinese equity exposure via more diversified funds.
Speaking of diversified funds, BNY Mellon Multi-Asset Balanced is once again in the red list and while its performance has been steady and consistent I think it is time to try an alternative multi-asset fund. One option would have been to go for Premier Miton Diversified Growth which is in the same sector as the BNY Mellon fund but also in the current BOTB. However, its performance over the last month has been weaker than the BNY Mellon fund and, while I don't base investment decisions on 1 month timeframes, the replacement of the BNY Mellon fund presents an opportunity to gain greater emerging market exposure within a diversified fund.
Barclays Wealth Wealth Global Markets 5 is an interesting fund which is currently in the BFBS table under the Flexible Investment sector. That means it is a multi-asset fund with less constraints on what it holds than funds in the Mixed Investment 40-85% Shares sector. As such the Barclays fund is a globally diversified fund but also has 28% of its assets invested in emerging market equities, which has propelled its performance in recent months.
So I intend to switch out of BNY Mellon Multi-Asset Balanced and into Barclays Wealth Wealth Global Markets 5 to bolster my emerging market equity exposure.
Similarly, I plan to switch out of Jupiter Asian Income and into FSSA Asia Focus, the latter of which is from the same sector (Asia Pacific Excluding Japan) but also in this month's BOTB. As mentioned earlier, Jupiter Asian Income hasn't performed terribly but has significantly underperformed its peers due to its lack of Chinese equity exposure. FSSA Asia Focus, on the other hand, has 22% exposure to Chinese equities which is a little under its benchmark average of 23%. The Chinese equity exposure is the main reason why the fund rallied 9.81% over the last month compared to Jupiter Asian Income's more modest 3.8% increase.
This switch gives my portfolio some exposure to Chinese equities, within a diversified fund. I could have picked one of the other Asia Pacific Excluding Japan funds listed in this month's BOTB but they have 30-40% exposure to Chinese equities, which makes them more volatile and more susceptible to a pullback in Chinese equities. With the FSSA fund I am opting for a more measured introduction of Chinese equities into my portfolio.
That leaves me with the Schroder European Recovery and Ninety One UK Special Situations as the only other funds that have fallen out of the BOTB and BFBS tables. However I plan to keep these funds for now and place them on my watchlist. While both have fallen out of the 80-20 Investor tables they have both been among the top performers within their respective sectors over the last month. Schroder European Recovery is the 8th best performing European equity fund out of 79 within the European sector over the last month. Meanwhile, Ninety One UK Special Situations is placed 19th out of 173 funds for its performance since my last review.
Given how volatile markets are right now and how well the portfolio is doing on the whole, I see no need to make excessive changes. Therefore in the short-term I plan to keep both funds and review their positions next month.
One final word must be given to Schroder UK Smaller Companies which although in the BOTB has had a difficult month. While that is reflective of the wider UK smaller companies sector underperformance, partly due to the uncertainty surrounding the upcoming autumn Budget on the 30th October, it is still disappointing. Fortunately it only accounts for 6% of my portfolio. Should the underperformance persist then I'd envisage UK smaller companies funds, including Schroder UK Smaller Companies to drop out of the 80-20 Investor lists and therefore potentially my portfolio.
The other holdings within my portfolio remain in the BOTB and the BFBS tables so I plan to maintain them as they are for now. I have listed the two fund switches I am making this month below. These will increase my emerging market equity exposure. Even after these changes the asset mix of my portfolio still differs from that of the BOTB, mainly because I will still have a higher European equity exposure and a lower emerging market equity exposure. However, it is an improvement on where the portfolio was, but I am happy to shift my portfolio's asset mix over time. One benefit of transitioning gradually is that we will see more evidence of whether emerging markets and Chinese equities can sustain their recent turnaround.
Fund switches
- 100% out of Jupiter Asian Income and 100% into the FSSA Asia Focus
- 100% out of BNY Mellon Multi-Asset Balanced and 100% into the Barclays Wealth Wealth Global Markets 5
My portfolio
My portfolio looks now like this:
| Fund | Allocation | Risk | Sector | ISIN Code |
| abrdn High Yield Bond | 14 | Lower | Sterling High Yield | GB00B79RR984 |
| Artemis Global Income | 11 | Medium | Global Equity Income | GB00B5N99561 |
| Aviva Inv Global Equity Income | 10 | Medium | Global Equity Income | GB0030441918 |
| Barclays Wealth Wealth Global Markets 5 | 8 | Medium | Flexible Investment | GB00B4YPY060 |
| Fidelity Index Japan | 3 | Medium | Japan | GB00BHZK8872 |
| FSSA Asia Focus | 5 | Higher | Asia Pacific Excluding Japan | GB00BWNGXJ86 |
| iShares Physical Gold ETC | 5.5 | Medium | Commodity & Energy ETF | IE00B4ND3602 |
| Liontrust India | 6 | Higher | India/Indian Subcontinent | GB00B1L6DV51 |
| Ninety One UK Special Situations | 7.5 | Higher | UK All Companies | GB00B1XFJS91 |
| Schroder European Recovery | 4.5 | Higher | Europe Excluding UK | GB0007221889 |
| Schroder Strategic Credit | 8 | Lower | Sterling Strategic Bond | GB00BJZ2ZC09 |
| Schroder UK Smaller Companies | 6 | Higher | UK Smaller Companies | GB00B76V7Z98 |
| T. Rowe Price US Large Cap Growth Equity | 6 | Higher | North America | GB00BD5FHW12 |
| Thesis TM Tellworth UK Select | 5.5 | Lower | Targeted Absolute Return | GB00BNY7YM73 |
My Portfolio asset mix
My portfolio asset mix has approximately 66% exposure to equities. Last month's figures are shown in brackets.
-
- UK Equities 21% (23%)
- North American Equities 14% (15%)
- Asian Equities 5% (7%)
- Chinese Equities 1% (0%)
- Emerging Market Equities 8% (6%)
- Japanese Equities 4% (4%)
- European Equities 11% (12%)
- Other International equity 2% (0%)
- Commodities and energy 5% (5%)
- UK Fixed Interest 4% (5%)
- Global Fixed Interest 18% (19%)
- Cash 2% (0%)
- Alternative Investment Strategies 5% (4%)
Damien's higher risk and lower risk portfolios
Using the logic described in my post: Update to Damien’s alternative risk portfolios I created hypothetical higher and lower risk versions of my portfolio below:
Lower risk
| Fund | Allocation % |
| abrdn High Yield Bond | 22 |
| Artemis Global Income | 17 |
| Aviva Inv Global Equity Income | 15 |
| Barclays Wealth Wealth Global Markets 5 | 12 |
| Fidelity Index Japan | 5 |
| iShares Physical Gold ETC | 8 |
| Schroder Strategic Credit | 13 |
| Thesis TM Tellworth UK Select | 8 |
Higher risk
| Fund | Allocation % |
| Artemis Global Income | 15 |
| Aviva Inv Global Equity Income | 14 |
| Barclays Wealth Wealth Global Markets 5 | 12 |
| Fidelity Index Japan | 4 |
| iShares Physical Gold ETC | 8 |
| FSSA Asia Focus | 7 |
| Liontrust India | 8 |
| Ninety One UK Special Situations | 10 |
| Schroder European Recovery | 6 |
| Schroder UK Smaller Companies | 8 |
| T. Rowe Price US Large Cap Growth Equity | 8 |

£200 Pension Cashback Offer
Make a qualifying deposit or transfer a pension to our partner Interactive Investor.
- Deposit or transfer a pension of at least £20k and you could earn £200 cashback
- Terms and Fees apply, Capital at risk
- New & Existing customers opening a SIPP
- Offer ends 31st July 2026
Before starting your transfer, check you won't lose any valuable benefits (such as guaranteed annuity rates or a lower protected pension age) and find out what exit fees you might have to pay
