

I last updated my portfolio in mid-August which coincidentally was days before the stock market crashed over 10%. You may recall that at the time I was beating 87% of fund managers.
At that time my original £50,000 was worth £50,410. The table below shows how much worse off I would have been if I'd invested in the equivalent managed fund at that time. I also give the performance of a FTSE 100 tracker for reference. Don't forget my portfolio includes all fees deducted while the other two don't include platform fees so their portfolio value is in fact lower than the value stated below:
| Portfolio | Return | How far behind my portfolio |
| Damien's 50K portfolio | £50,410 | n/a |
| Average managed fund 40-85% | £49,927 | -£483 |
| FTSE 100 | £49,393 | -£1,017 |
How I outperformed during the market sell-off
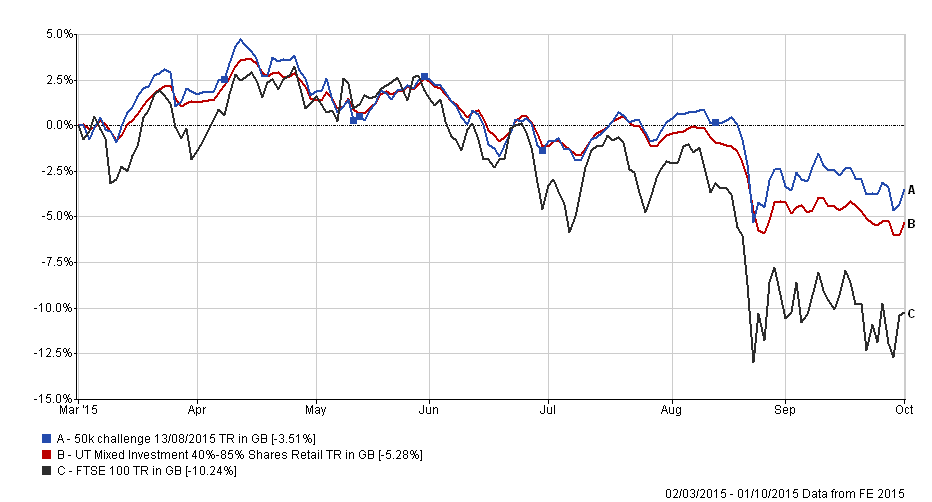
Of course if the market suffers a major correction as it did (of more than 10%) then my portfolio wouldn't be immune because around 70-80% of its assets are invested in equities. The chart below shows what happened to my portfolio versus the average fund manager (red line) and the market (black line). The blue dots on the blue line (my portfolio) signify when I made fund switches. Click on the image to enlarge it.
So what that translates to in actual pounds and pence is shown in the table below:
| Portfolio | Current portfolio value | How far behind my portfolio |
| Damien's 50K portfolio | £48,244 | n/a |
| Average managed fund 40-85% | £47,359 | -£885 |
| FTSE 100 | £44,880 | -£3,364 |
So you can see the level of outperformance against the average fund manager with 40-85% exposure to equities has doubled! Plus the out performance versus the FTSE 100 has trebled. In fact I am now beating 90% of fund managers running equivalent portfolios.
Or in other words my portfolio outperformed even during the worst market sell-off since 2011, when the eurozone almost imploded.
What now?
You may be thinking that I'd be pretty happy with that outcome, which of course I am. But let me show you the chart below of the 80-20 Investor Best of the Best Selection (green line) versus my portfolio (blue line).
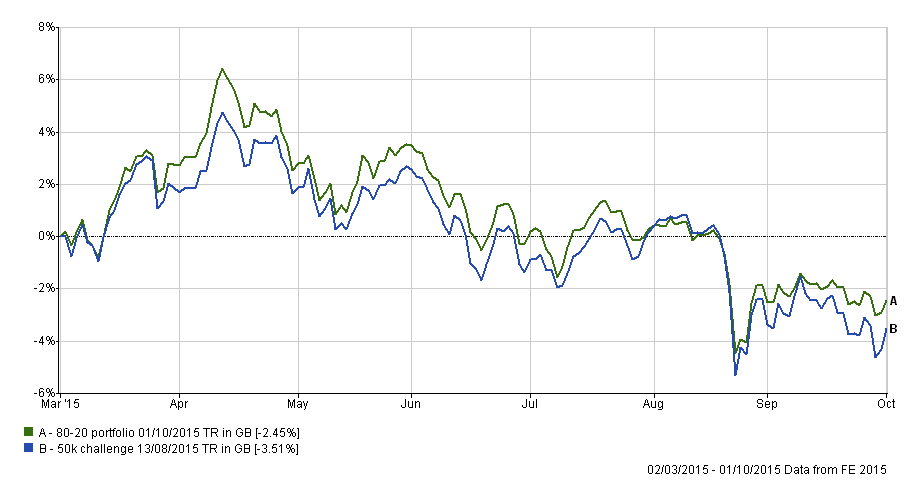
The first thing you will notice is that my portfolio has largely tracked the 80-20 Best of the Best Selection's performance, which was my intention. However you will recall that at the start of September there was a substantial reduction in the level of risk being taken by the Best of the Best Selection. At the time I said of the changes:
The noticeable feature is that a number of absolute return funds which use alternative strategies have entered the selection. It is the first time that so many absolute return funds have made the grade. There is certainly a reduction in risk when you look at the Best of the Best Selection this month, emphasised by the fact that there are only 6 high risk funds (usually there are up to 10).
In September's monthly newsletter I even warned 80-20 Investor members:
If you look at the analysis of this month's Heatmap and the Best of the Best Selection both are suggesting that now is a good time to reduce your level of risk in your portfolio and head for relatively safer waters.
Yet having only updated my portfolio just 2 weeks prior to the 1st September I chose to wait until this month before making any more changes. Of course looking at the chart above I now wish I had updated my portfolio to reflect September's Best of the Best Selection.
The reason I am pointing this out is to show you that you won't get every decision right but if you follow a process it won't matter in the long run. My portfolio has now been running 7 months and I am pleased with the relative performance versus fund managers with their army of analysts. However I am still looking at the long term so I'm not going to pat myself on the back too much or scold myself at this stage.
As I've just published October's Best of the Best Selection I have decided to overhaul every fund in my portfolio and replace them with funds from this month's shortlist. The exact switches are listed below.
The key things to note is that like the 80-20 Investor Best of the Best Selection:
- I have exited Japanese equities completely
- I have reduced my US equity exposure
- I now have a significant exposure to (steady) property
- I now have some exposure to cash and 'alternative' strategies
To sum up the portfolio is now taking less risk and will have an overall reduced beta value (see my article on How to make your portfolio immune to market volatility. Hopefully if the current market volatility continues then my portfolio should be in better shape in order to fare better.
Fund switches
| Fund switched from | Fund switched to |
| Axa Framlington American Growth | Aberdeen Property Trust |
| Aberdeen European High Yield Bond | Legal & General Dynamic Bond |
| FP Argonaut European Enhanced Income | Jupiter European |
| JPM Cautious Managed | Premier Multi-Asset Conservative Growth |
| M&G Japan | Fundsmith Equity |
| Old Mutual UK Mid Cap | JPM UK Smaller Companies |
| Unicorn UK Income | CF Miton UK Value Opportunities |
My portfolio now looks like this:
| Fund | % of portfolio |
| Aberdeen Property Trust | 10 |
| Legal & General Dynamic Bond | 18 |
| Jupiter European | 17 |
| Premier Multi-Asset Conservative Growth | 18 |
| Fundsmith Equity | 10 |
| JPM UK Smaller Companies | 16 |
| CF Miton UK Value Opportunities | 11 |
Which means my portfolio now has an asset allocation breakdown as shown below. The numbers in brackets represent the figures before the above switches were actioned:
- UK Equities 30% (28%)
- European Equities 18% (18%)
- Property 8% (0%)
- Alternative strategies 6% (0%)
- UK Fixed interest 18% (11%)
- Cash 6% (0%)
- US Equities 5% (13%)
- Other international equities 9% (0%)
- Japan Equities 0% (11%)
- Global Fixed interest 0% (19%)
All performance figures are net of fund charges. The material in any email, the MonetotheMasses.com website, associated pages / channels / accounts and any other correspondence are for general information only and do not constitute investment, tax, legal or other form of advice. You should not rely on this information to make (or refrain from making) any decisions. Always obtain independent, professional advice for your own particular situation. See full Terms & Conditions and Privacy Policy
Neither MoneytotheMasses.com/80-20 Investor nor its content providers are responsible for any damages or losses arising from any use of this information. Past performance is no guarantee of future results.
Funds invest in shares, bonds, and other financial instruments and are by their nature speculative and can be volatile. You should never invest more than you can safely afford to lose. The value of your investment can go down as well as up so you may get back less than you originally invested.
Information provided by MoneytotheMasses.com/80-20 Investor is for general information only and not intended to be relied upon by readers in making (or not making) specific investment decisions.
Appropriate independent advice should be obtained before making any such decisions. Leadenhall Learning (owner of MoneytotheMasses.com/80-20 Investor) and its staff do not accept liability for any loss suffered by readers as a result of any such decisions.
The tables and graphs are derived from data supplied by Trustnet. All rights Reserved.

£200 Pension Cashback Offer
Make a qualifying deposit or transfer a pension to our partner Interactive Investor.
- Deposit or transfer a pension of at least £20k and you could earn £200 cashback
- Terms and Fees apply, Capital at risk
- New & Existing customers opening a SIPP
- Offer ends 31st July 2026
Before starting your transfer, check you won't lose any valuable benefits (such as guaranteed annuity rates or a lower protected pension age) and find out what exit fees you might have to pay
