
 My £50,000 portfolio has now been running for 5 months. In that time I've navigated a Chinese bear market, the Greek debt crisis, a General Election in the UK as well as a number of market sell-offs.
Is it any wonder then that the average managed fund manager is sitting on a loss since I started the exercise in March? So how have I fared?
Outperforming 87% of fund managersThe chart below gives you a warts and all summary of how my portfolio (the blue line) has outperformed the market (the black line) and the average fund manager (red & green lines). Click the image to enlarge it. The comparable managed funds reside in the two Mixed Investments sectors shown. My portfolio's asset mix would usually lie somewhere between the two of these sectors.
As you can see, not only have I outperformed the market and the typical fund manager but I'm sitting on a profit despite all those aforementioned market events!

Full article available exclusively to 80-20 Investor members.
To read the complete article, sign up for a free trial or log in below.
Start a free trial Already have an account? Log in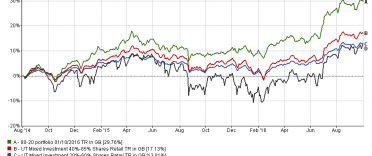


 MTTM AI (beta)