

The background to my portfolio
Back in March 2015 I decided to invest £50,000 of my own money using 80-20 Investor. The purpose was twofold, firstly to show how you can use 80-20 Investor to invest and outperform the market with only a few minutes effort every now and then. Secondly, no other investment commentator, journalist or research provider invests their own money for fear of failing. This is a sorry state of affairs and is precisely why I committed to openly running my own portfolio for 80-20 Investor members to see.
Since then I have periodically changed my portfolio using the fund suggestions provided by the 80-20 Investor algorithm and associated research. I always disclose the changes at the time they are made.
Performance update
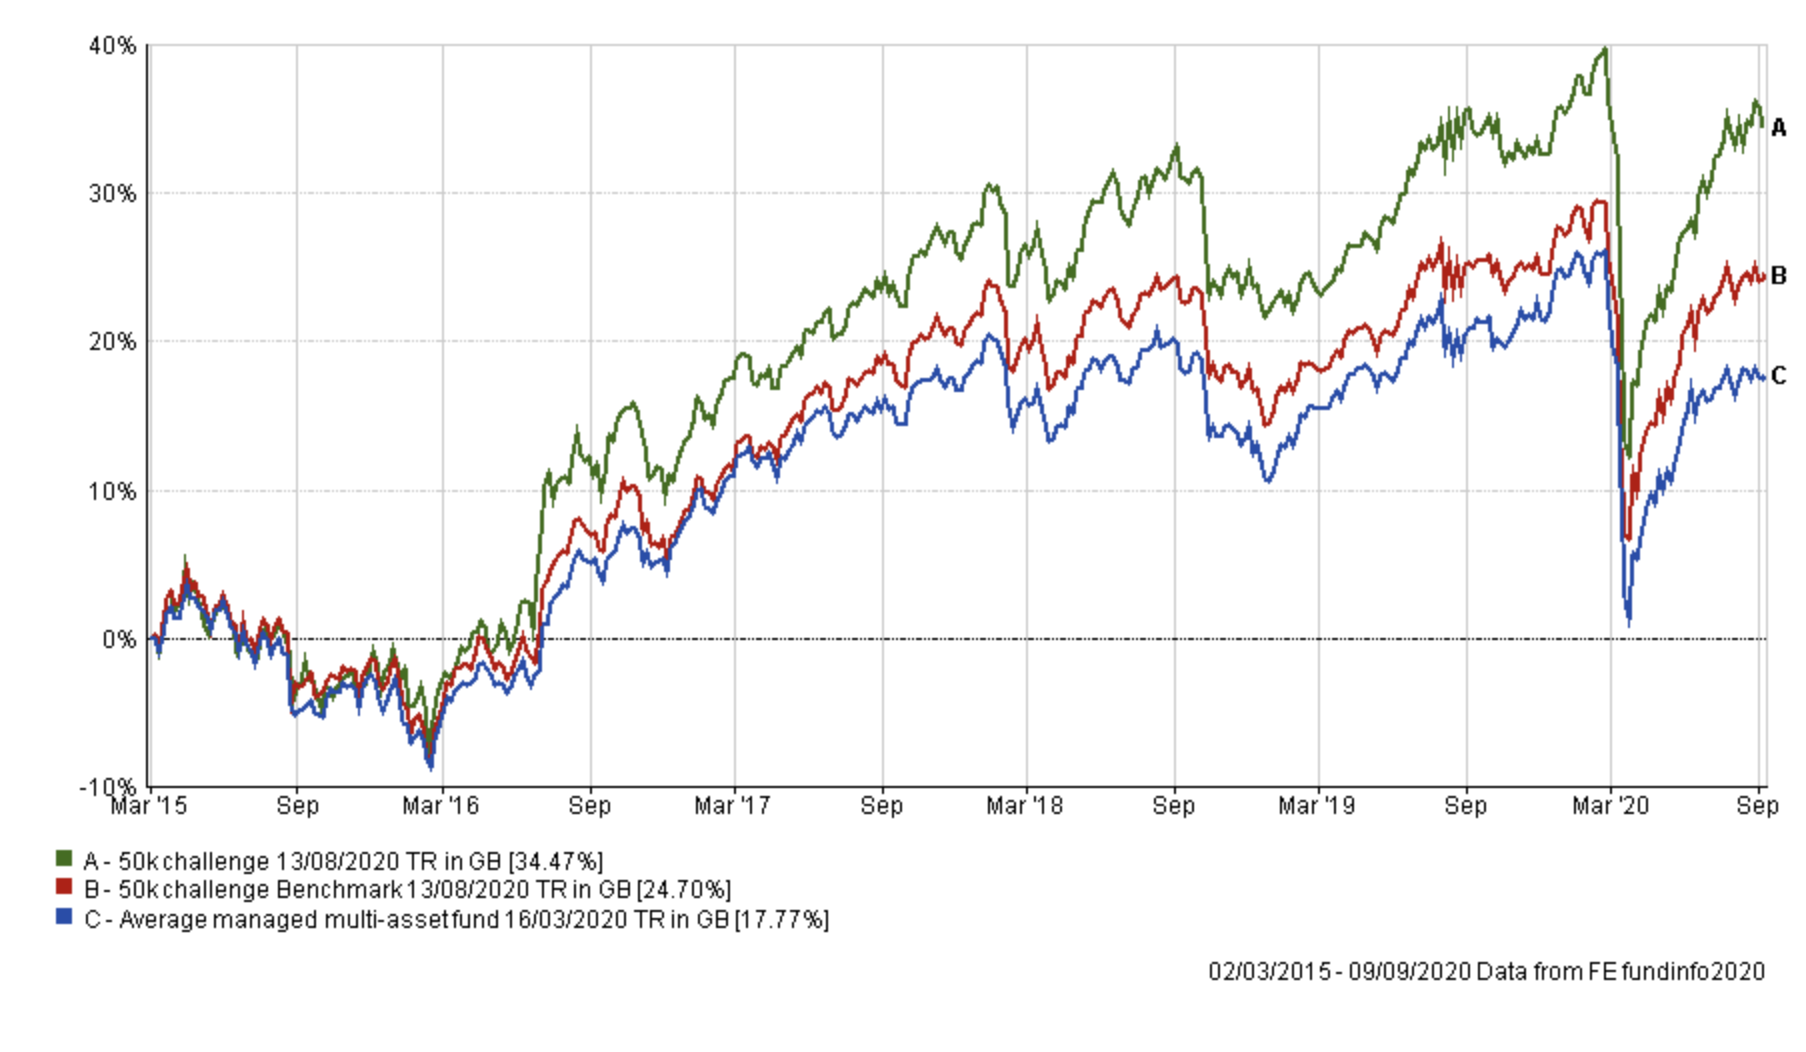
As is usual in my portfolio reviews, the chart below shows how my portfolio has outperformed since I started the challenge in March 2015, which is over five years ago. The green line is the performance of my portfolio while the red line is the benchmark showing the average return achieved by professional fund managers given the same asset mix. To accurately calculate this I have used the average return for each sector in which my portfolio invested. The blue line shows what the average multi-asset fund with comparable equity content achieved. In other words, the red line would show the extra performance added by just the asset mix of my portfolio (where I was invested i.e European equities etc) over picking a typical multi-asset fund (the blue line). While the green line (which is my actual performance) shows the impact of being in the right funds at the right time, as identified by the 80-20 Investor algorithm.
You can see how my portfolio gave up a small amount of its lead over its benchmarks during the last month. The chart below shows the portfolio's performance during that month, since my last review.
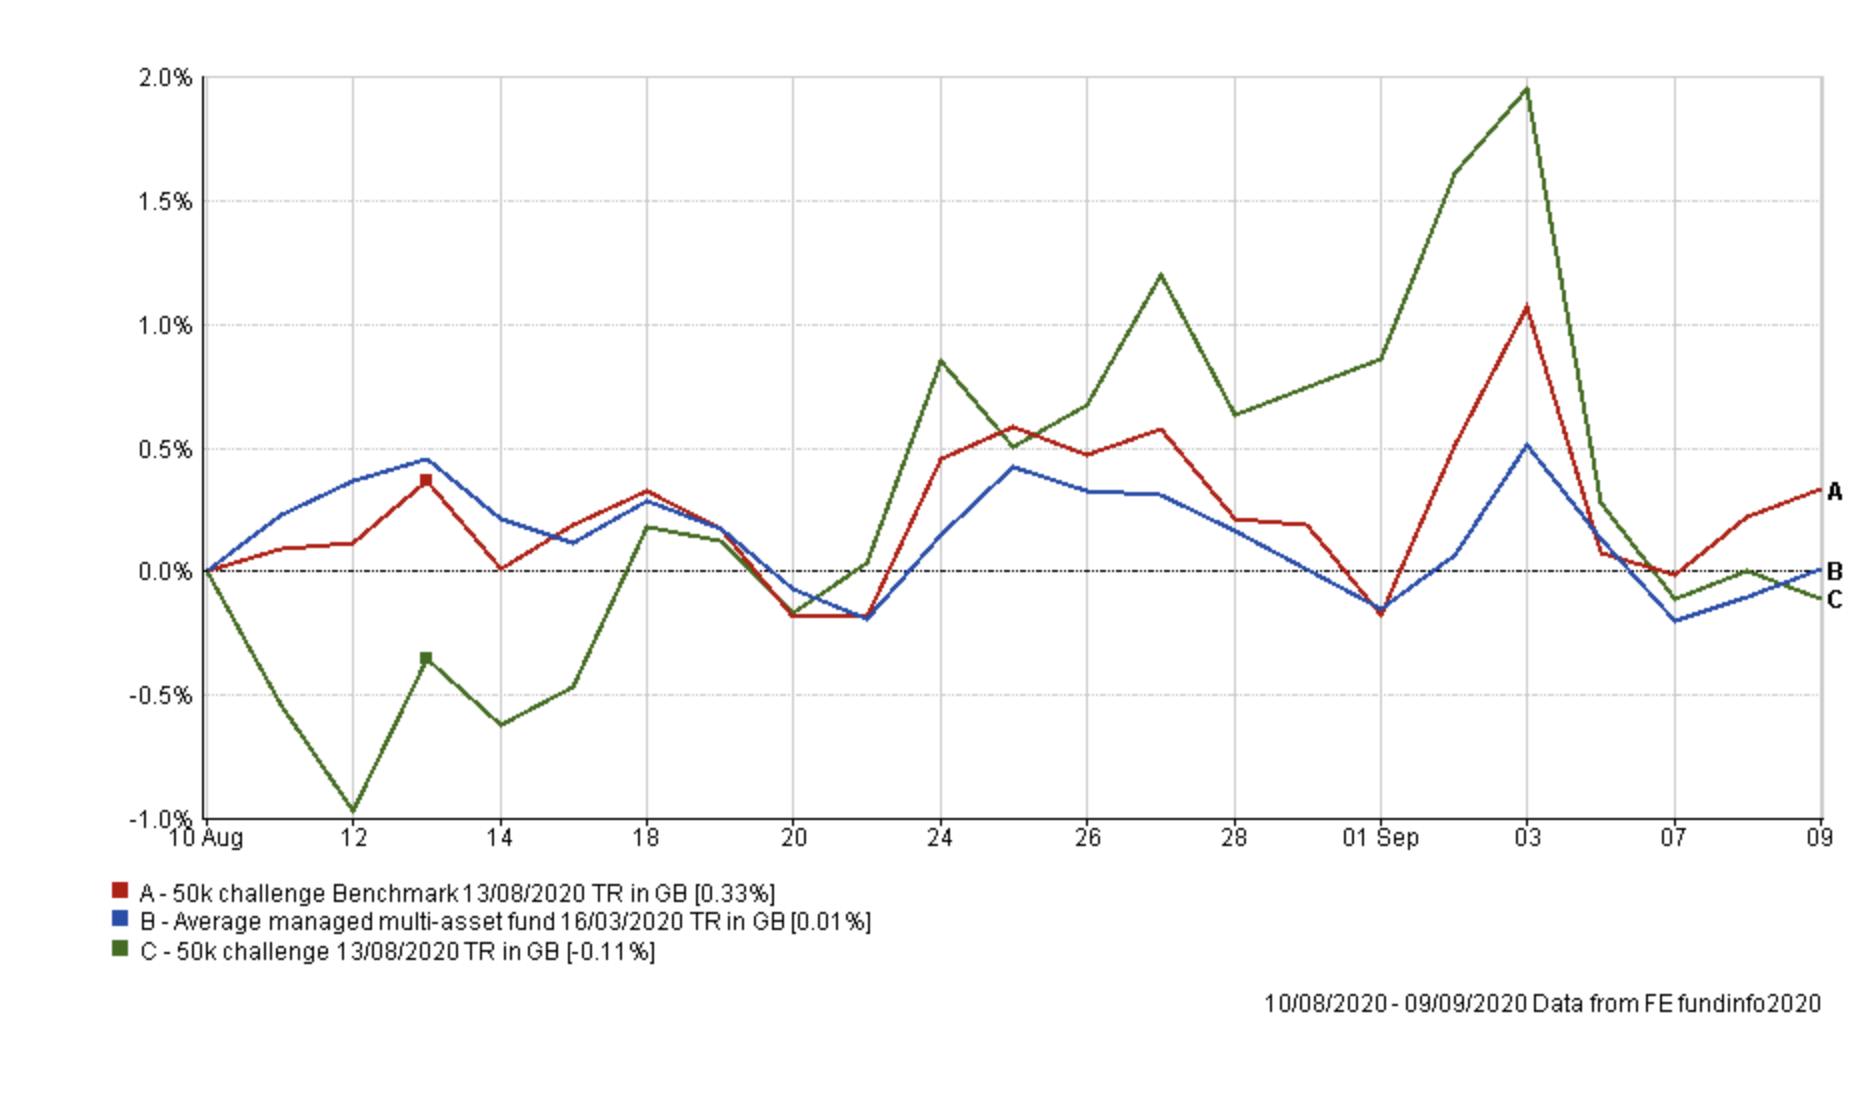
You can see that my portfolio was strongly outperforming its benchmark until the start of September when technology stocks crashed, which I wrote about in September's monthly newsletter. Breaking this down further, the table below shows the performance of each component of my portfolio over the last month and since the high on 2nd September 2020. The top performers over each period are in green while the bottom performers are in red.

Obviously I don't obsess over short term market moves but what the data does highlight is where correlations exist and what has been going on beneath the surface. The standout performers since my last review are:
- Baillie Gifford Long Term Global Growth Investment
- JPM Japan
- Allianz Total Return Asian Equity
- Baillie Gifford Positive Change
But, following the technology stock sell-off (in fact the NASDAQ 100 fell more than 10%) most of these have struggled as shown in the above chart. Disappointedly, Allianz Strategic Bond has not protected the portfolio during the recent equity sell-off as well as it has done in the past. That's partly because US Treasuries haven't rallied as they usually do during a crisis. One characteristic of 2020 has been that the usual bond/equity portfolio diversification benefits have reduced during periods of market tension. Gold, on the other hand, has shone particularly brightly in the latest equity sell-off which is good to see.
Of course, the 80-20 Investor algorithm screening process still highlights the momentum that the aforementioned funds have, despite the recent pullback. Will the pullback be short-lived or is this the beginning of a significant change in the direction of markets?
As is the routine in my portfolio reviews, the table below shows which funds within my portfolio are in the current BOTB or BFBS tables and which are not. Those funds in green are still in the BOTB while those in yellow are not in the BOTB but remain in the BFBS list. Meanwhile, any funds in red have dropped out of both shortlists.
| Name | Allocation % (rounded) | Risk | Sector | ISIN Code |
| Baillie Gifford European | 5 | High | Europe Excluding UK | GB0006058258 |
| Schroder Global Healthcare | 7.5 | Medium | Global | GB00B76V7Q08 |
| Baillie Gifford Long Term Global Growth Investment | 9 | High | Global | GB00BD5Z0Z54 |
| VT Gravis Clean Energy Income | 5.5 | Medium | Global | GB00BFN4H792 |
| Premier Diversified Growth | 9 | Medium | Mixed Investment 40-85% Shares | GB00B8BJV423 |
| Royal London UK Government Bond | 15 | Medium | UK Gilts | GB00B881TW52 |
| Allianz Strategic Bond | 16.5 | Low | Sterling Strategic Bond | GB00B06T9362 |
| Troy Asset Management Ltd Trojan Ethical | 10.5 | Medium | Flexible Investment | GB00BJP0XX17 |
| Baillie Gifford Positive Change | 5.5 | High | Global | GB00BYVGKV59 |
| Liontrust Sustainable Future Cautious Managed | 5 | Medium | Mixed Investment 40-85% Shares | GB00BMN90304 |
| iShares Physical Gold ETC | 5.5 | Medium | Commodity & Energy ETF | - |
| Allianz Total Return Asian Equity | 3 | Medium | Asia Pacific Excluding Japan | GB00B1FRQV53 |
| JPM Japan | 3 | Medium | Japan | GB00B1XMTP77 |
The first thing to notice is that 5 funds are no longer in September's BOTB or BFBS tables. Ironically, with the exception of VT Gravis Clean Energy Income, these are the funds that have performed best during September's market sell-off. If you look back at last month's portfolio review, Schroder Healthcare was in both the BOTB and BFBS. While it may have fallen out of the BOTB and BFBS at the start of the month the fund's performance during the technology sell-off merits its inclusion for now.
The same could be said for Premier Diversified, Liontrust Sustainable Future Cautious Managed and Troy Asset Management Ltd Trojan Ethical, the latter benefiting from the performance of gold and bonds during the US equity wobble. Premier Diversified has benefited from its exposure to UK equities which have outperformed US equities in recent weeks.
Ordinarily. I would look to remove the VT Clean Energy fund, given that it has been out of the 80-20 Investor tables for some time and has even underperformed during the tech-orientated rout. However, at the time of writing the volatility in investment and currency markets has rocketed. The VIX (known as the market fear gauge) which is also a volatility indicator for the S&P 500 has surged over 31 (a bad sign). The volatility in technology stocks, in particular, has risen even faster. It means that on a given day individual stocks are moving up and down wildly. On top of that, news that the UK's Brexit negotiations could collapse leaving the UK withdrawal agreement in tatters (along with hopes of a trade deal) has seen the pound tumble. This means that any gains on overseas holdings are fluctuating even more wildly.
To use an analogy, swapping funds for whatever reason during a period such as this would be akin to disembarking one ship and boarding another out in a stormy sea. There is no telling whether the outcome would be positive or a complete disaster, as markets could move for or against you very quickly.
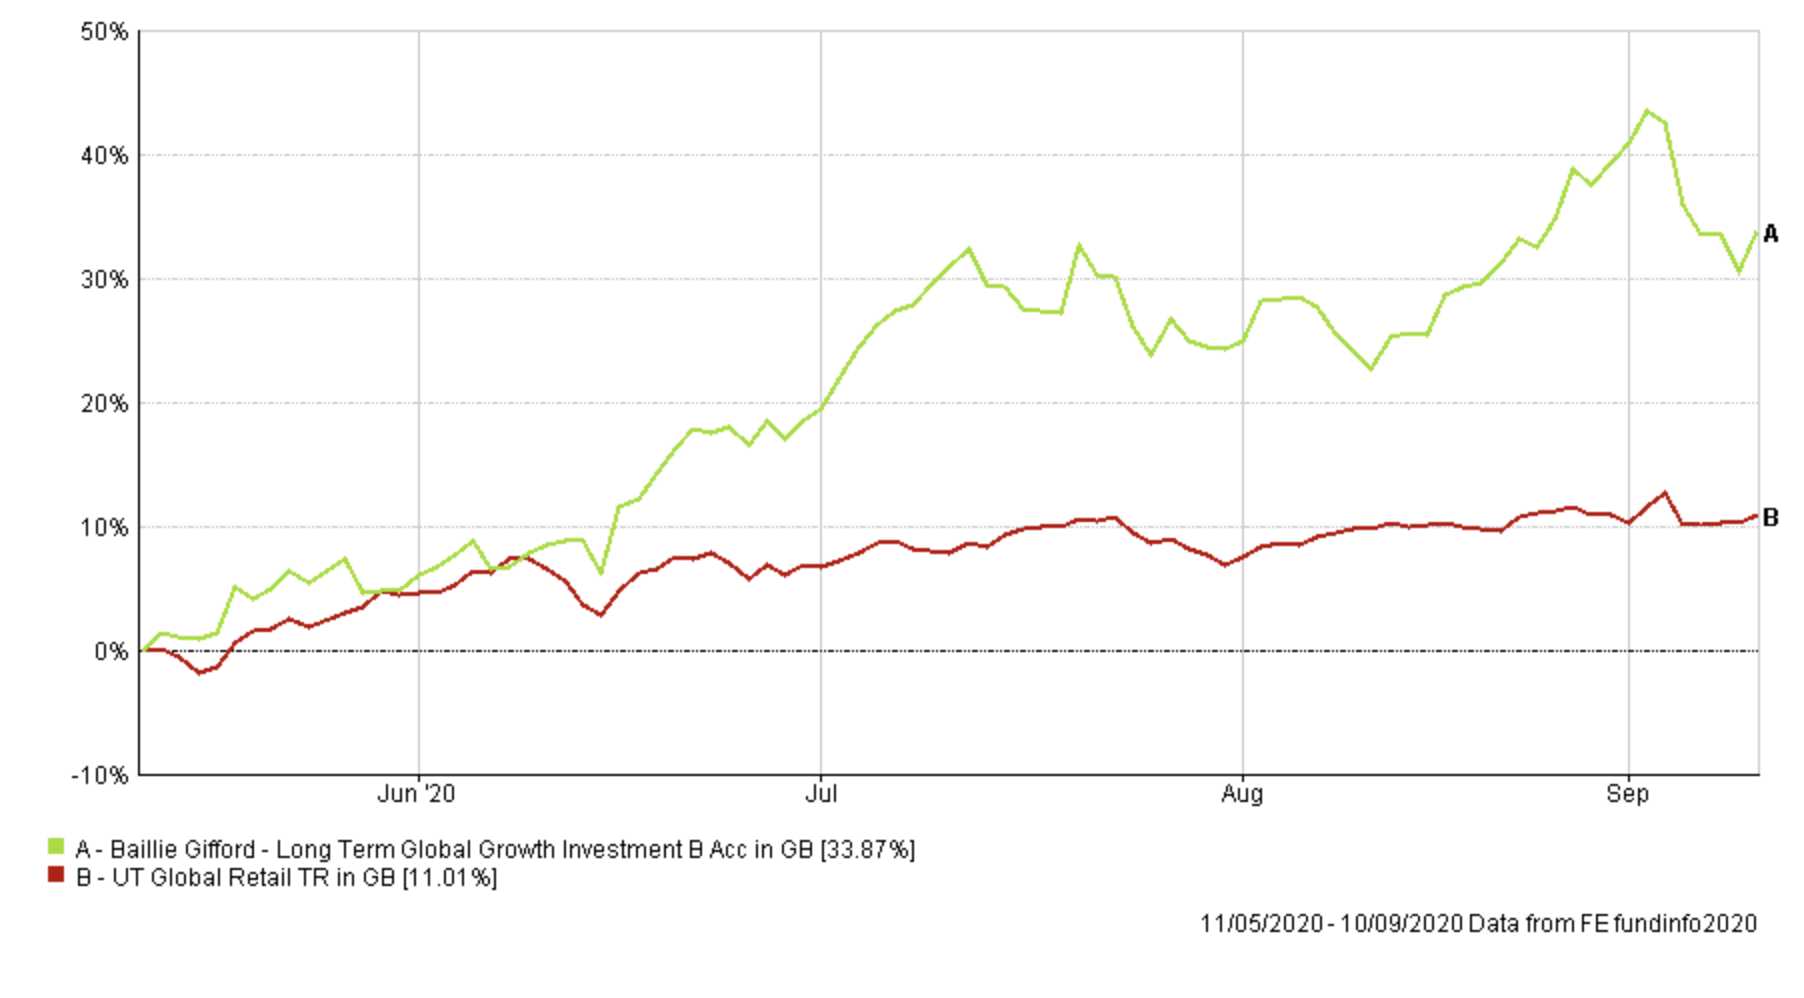
Again ordinarily I will consider increasing the equity exposure of my own portfolio to be more in line with the BOTB (now at 62% versus 48% for my portfolio), perhaps looking to reduce my exposure to technology stocks which have had a fantastic run. The chart below shows the performance of the Baillie Gifford Long Term Global Growth Investment since I've held it.
With the recent stop loss alert and ongoing market action, it could be deemed prudent to take some profits. However, then the choice would be where to put the proceeds. Placing the money into cash would be one option but I would be decreasing my overall equity exposure, which is something I do not want to do. Of course, the current market wobble could get worse, and potentially be a precursor to an event such as we saw back in February, simply because the uptrends that we have seen since the March-lows can't go on forever. On the flip side, many of those uptrends, while being tested, have yet to completely break at the time of writing. However, I don't have a crystal ball and have no idea of what the outcome will be.
If the prevailing momentum trends do reverse then I will cross that bridge when it happens, as I did following the market crash in February. If they do then my portfolio's performance will be impacted over the short term, which I accept. While my portfolio's concentrated exposure to US equities and technology stocks is currently being put to the test, I think it prudent to offset this by maintaining my portfolio's overall equity exposure as it is for now (i.e. lower than that of the BOTB's 62% right now) given the level of volatility we are experiencing across markets.
The upshot is, that despite whatever changes I might want to make to my portfolio for positive reasons, right now it is perhaps wiser to wait until this storm has passed.
My Portfolio asset mix
My portfolio asset mix is as shown below which is now around 48% which is still 5% less than I had before the coronavirus sell-off. Also the asset mix remains unchanged from last month (shown in brackets):
-
- UK Equities 5% (5%)
- North American Equities 20% (20%)
- Global Fixed Interest 23% (23%)
- Japanese Equities 4% (4%)
- European Equities 11% (11%)
- UK Fixed Interest 0% (0%)
- UK Gilt 13% (13%)
- Cash 4% (4%)
- Alternative Investment Strategies 7% (7%)
- Asian Equities 3% (3%)
- Emerging Market Equities 3% (3%)
- Commodities and energy 7% (7%)
- Property 0% (0%)
Damien's higher risk and lower risk portfolios
Using the logic described in my post: Update to Damien’s alternative risk portfolios I created hypothetical higher and lower risk versions of my portfolio below:
Higher risk
| Name | Allocation % |
| Baillie Gifford European | 6 |
| Schroder Global Healthcare | 9 |
| Baillie Gifford Long Term Global Growth Investment | 9.5 |
| VT Gravis Clean Energy Income | 7 |
| Premier Diversified Growth | 11.5 |
| Royal London UK Government Bond | 18 |
| Troy Asset Management Ltd Trojan Ethical | 13 |
| Baillie Gifford Positive Change | 6 |
| Liontrust Sustainable Future Cautious Managed | 6 |
| iShares Physical Gold ETC | 6 |
| Allianz Total Return Asian Equity | 4 |
| JPM Japan | 4 |
Lower risk
| Fund | Allocation % |
| Schroder Global Healthcare | 9.5 |
| VT Gravis Clean Energy Income | 7 |
| Premier Diversified Growth | 11 |
| Royal London UK Government Bond | 18.5 |
| Allianz Strategic Bond | 20.5 |
| Troy Asset Management Ltd Trojan Ethical | 13 |
| Liontrust Sustainable Future Cautious Managed | 6 |
| iShares Physical Gold ETC | 6.5 |
| Allianz Total Return Asian Equity | 4 |
| JPM Japan | 4 |

£200 Pension Cashback Offer
Make a qualifying deposit or transfer a pension to our partner Interactive Investor.
- Deposit or transfer a pension of at least £20k and you could earn £200 cashback
- Terms and Fees apply, Capital at risk
- New & Existing customers opening a SIPP
- Offer ends 31st July 2026
Before starting your transfer, check you won't lose any valuable benefits (such as guaranteed annuity rates or a lower protected pension age) and find out what exit fees you might have to pay
