

The background to my portfolio
Back in March 2015 I decided to invest £50,000 of my own money using 80-20 Investor. The purpose was twofold, firstly to show how you can use 80-20 Investor to invest and outperform the market with only a few minutes effort every now and then. Secondly, no other investment commentator, journalist or research provider invests their own money for fear of failing. This is a sorry state of affairs and is precisely why I committed to openly running my own portfolio for 80-20 Investor members to see.
Since then I have periodically changed my portfolio using the fund suggestions provided by the 80-20 Investor algorithm and associated research. I always disclose the changes at the time they are made.
Performance update
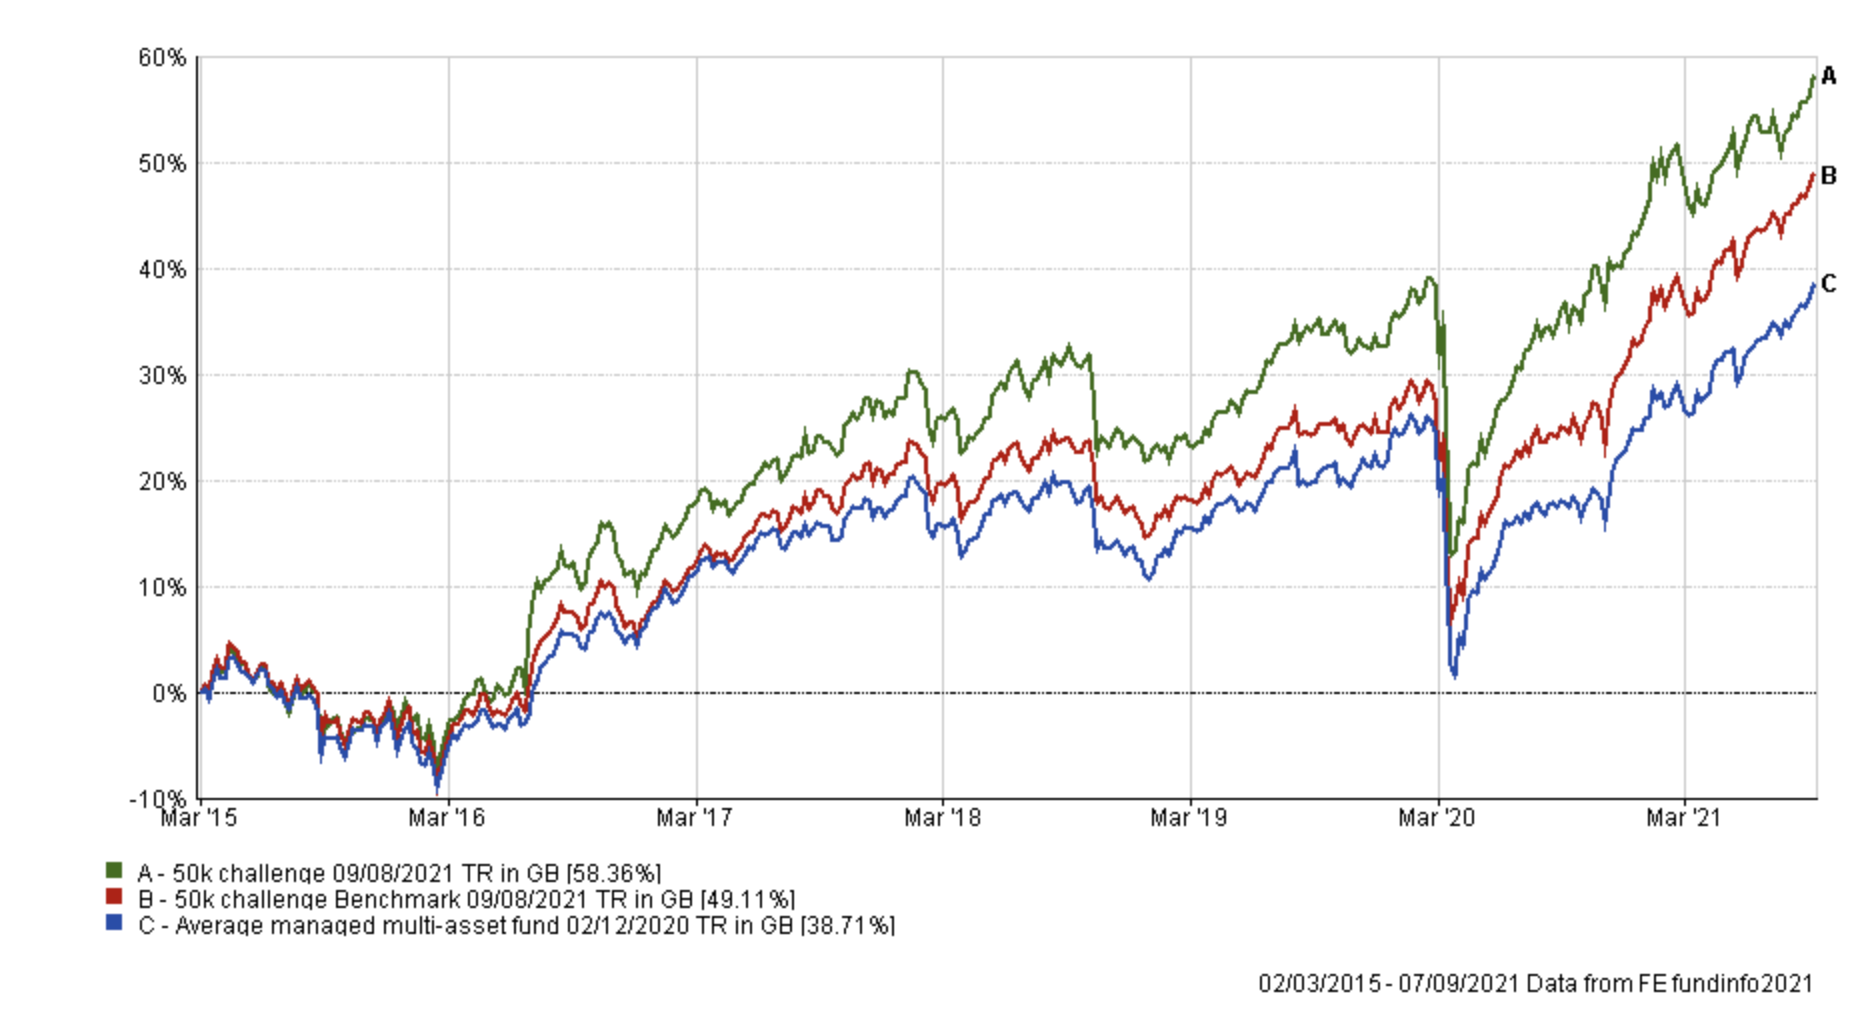
As is usual in my portfolio reviews, the chart below shows how my portfolio has outperformed since I started the challenge in March 2015, which is over six years ago. The green line is the performance of my portfolio while the red line is the benchmark showing the average return achieved by professional fund managers given the same asset mix. To accurately calculate this I have used the average return for each sector in which my portfolio invested. The blue line shows what the average multi-asset fund with comparable equity content achieved. In other words, the red line would show the extra performance added by just the asset mix of my portfolio (where I was invested i.e European equities etc) over picking a typical multi-asset fund (the blue line). While the green line (which is my actual performance) shows the impact of being in the right funds at the right time, as identified by the 80-20 Investor algorithm.
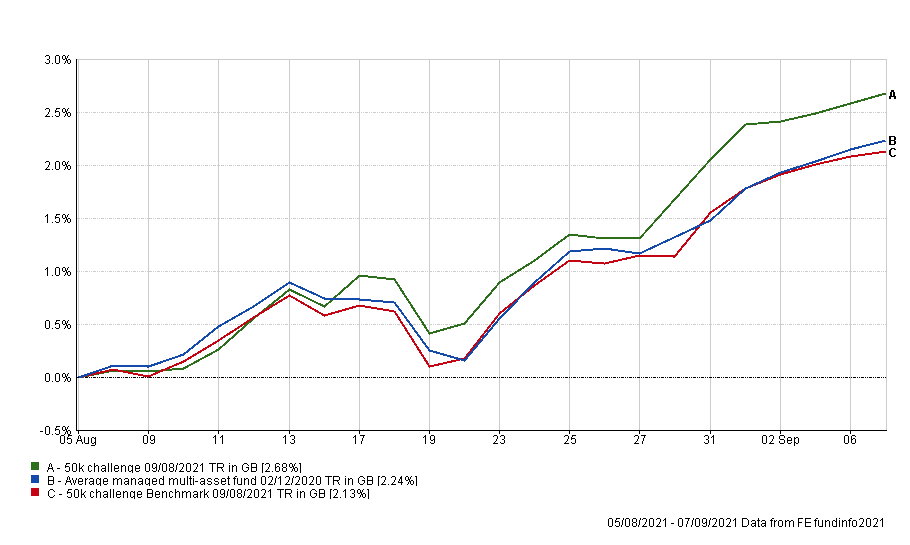
My £50k portfolio currently sits at a new all-time high which is obviously good to see and continues to beat its benchmarks. The chart below shows how my portfolio outperformed its benchmarks during the last month, finishing up 2.68%.
The table below shows the overall performance of each fund within my portfolio since my review last month. There were some strong performances from funds with exposure to smaller companies in the UK as well as US equities. It is also good to see recent additions BMO North American Equity, Slater Recovery and Fidelity Emerging Europe Middle East and Africa continuing to perform strongly. At the opposite end of the table you can see the low risk funds within my portfolio, all of which still produced a positive return.
| Name | % return 5th August to 7th Sept 2021 |
| Fidelity UK Smaller Companies | 5.25 |
| Slater Recovery | 3.99 |
| BMO North American Equity | 3.7 |
| Fidelity Emerging Europe Middle East and Africa | 3.49 |
| Fidelity Global Property | 3.25 |
| Premier Miton Diversified Growth | 3.23 |
| Marlborough European Multi-Cap | 2.68 |
| Fundsmith Equity | 2.34 |
| Wise Funds Limited TB Wise Multi-Asset Growth | 2.12 |
| iShares Physical Gold ETC | 1.13 |
| BM Brooks Macdonald Defensive Capital | 1.05 |
| Fidelity Global High Yield | 0.74 |
| ASI Strategic Bond | 0.21 |
As usual, the table below shows which funds within my current portfolio are in the current BOTB or BFBS tables and which are not. Those funds in green are still in the BOTB while those in orange are not in the BOTB but remain in the BFBS list. Meanwhile, any funds in red have dropped out of both shortlists.
|
Name |
Allocation % (rounded) | Risk | Sector | ISIN Code |
| ASI Strategic Bond | 10 | Low | Sterling Strategic Bond |
GB00BWK27X12
|
| BM Brooks Macdonald Defensive Capital | 5 | Low | Targeted Absolute Return |
GB00B61MR835
|
| BMO North American Equity | 5.5 | Medium | North America | GB0030281405 |
| Fidelity Emerging Europe Middle East and Africa | 6.5 | High | Specialist | GB00B87Z7808 |
| Fidelity Global High Yield | 8 | Low | Sterling High Yield |
GB00B7K7SQ18
|
| Fidelity Global Property | 7 | Medium | Property Other |
GB00B7K2NZ09
|
| Fidelity UK Smaller Companies | 9.5 | High | UK Smaller Companies |
GB00B7VNMB18
|
| Fundsmith Equity | 7.5 | Medium | Global |
GB00B4Q5X527
|
| iShares Physical Gold ETC | 4 | Medium | Commodity & Energy ETF | IE00B4ND3602 |
| Marlborough European Multi-Cap | 6.5 | High | Europe Excluding UK | GB0001719730 |
| Premier Diversified Growth | 16 | Medium | Mixed Investment 40-85% Shares | GB00B8BJV423 |
| Slater Recovery | 6 | Medium | UK All Companies | GB0031554248 |
| Wise Multi-Asset Growth | 8.5 | Medium | Flexible Investment | GB0034272533 |
Looking at the colour-coded table above only two funds are no longer in either the BOTB or BFBS and are coloured red. They are Wise Multi-Asset Growth and ASI Strategic Bond. If you recall, last month I decided to begin reducing my exposure to ASI Strategic Bond over time and began dripping out of the fund, in favour of the BM Brooks Macdonald Defensive Capital.
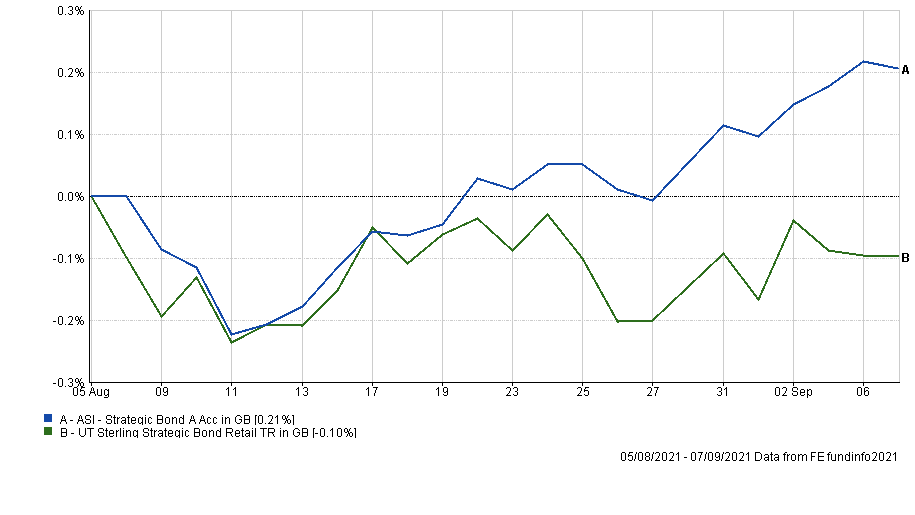
As I also stated last month, the ASI Strategic Bond has been in my portfolio since 2020 and has outperformed the average of its peers in that time. This remains the case (as shown below).

Ordinarily I would look to continue reducing my exposure in favour of BM Brooks Macdonald Defensive Capital but ASI Strategic Bond has performed well versus its peers in the Strategic Bond sector as shown below over the last month.
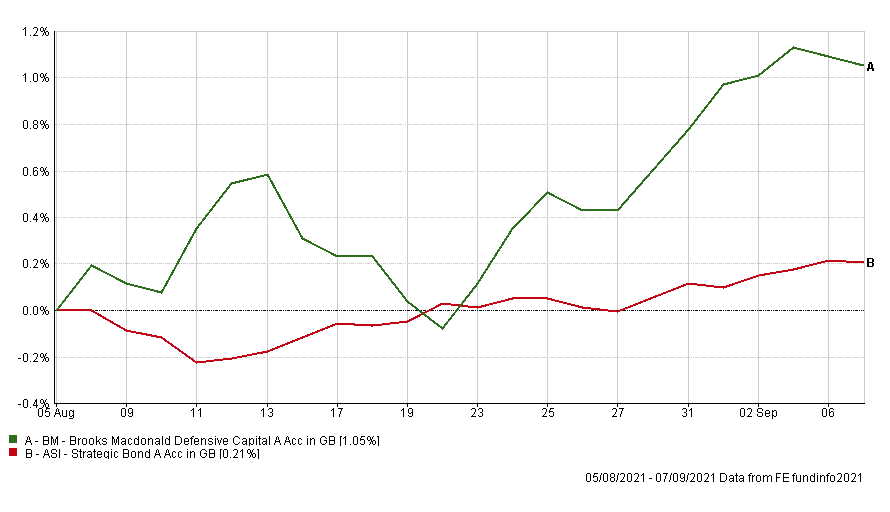
Not just that it has also worked well in countering the increased volatility of BM Brooks Macdonald Defensive Capital. At present we are seeing increased levels of volatility and given that ASI Strategic Bond has only just fallen off the BFBS I plan to keep a watching brief with a view to reviewing its inclusion next month, and possibly to continue dripping out of the fund.
Similarly, Wise Multi-Asset Growth has just fallen out of the BFBS tables so is now on my watchlist. The chart below shows the fund's performance since my last portfolio review, versus its peers. You can see how the fund has mostly performed in line with its peers over the last month, after a disappointing couple of months.
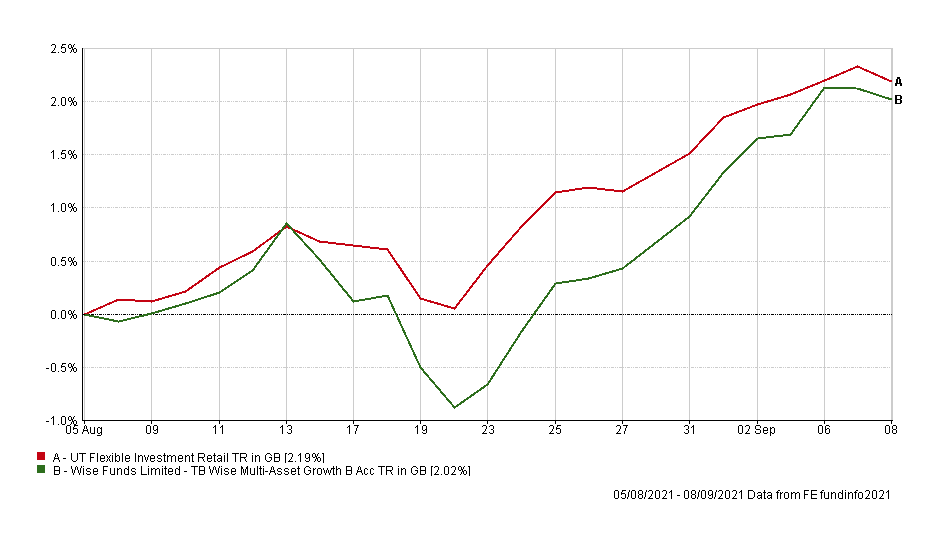
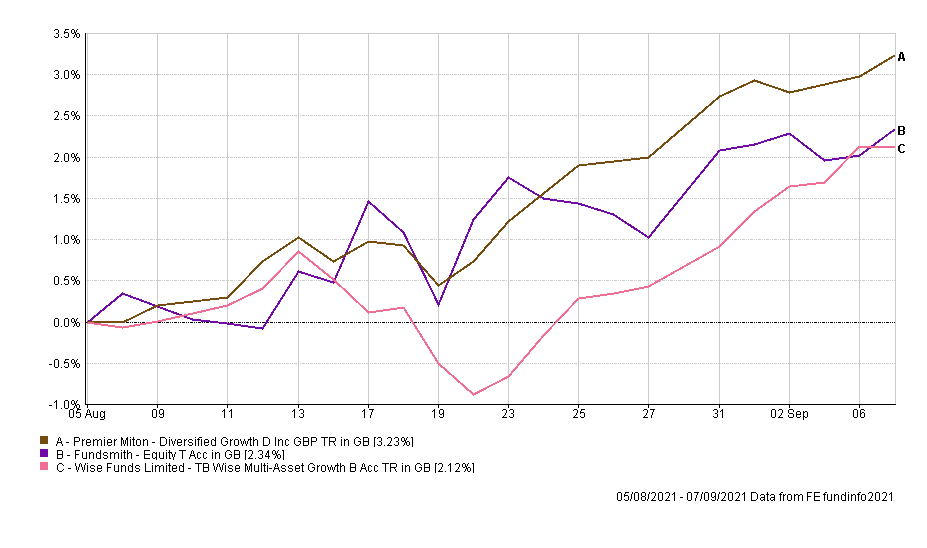
The fund has only just dropped out of the BFBS table so there is no need to knee-jerk and replace it. Again ordinarily I would look to replace or reduce the fund's allocation, perhaps splitting the sale proceeds between other funds within my portfolio. But if you compare its performance with the global growth-orientated equity-focused funds within my portfolio, such as Fundsmith equity, you can see that Wise Multi-Asset Growth provides a level of diversification, given its greater value focus. You can even see the market rotations on the chart below where value or growth styles came in and out of favour.
So, I am going to give the fund a stay of execution for now. If you look at the rest of the portfolio the funds remain in the BOTB or BFBS tables, and the asset mix of my portfolio broadly matches that of the BOTB, although my equity content is a little lower at 63% as opposed to 67%. As always I am keen to keep fund changes to a minimum, especially during periods of market volatility (and equity sector rotations back and forth) so I don't plan to make any changes to my portfolio this month.
My portfolio
My portfolio remains:
|
Name |
Allocation % (rounded) | Risk | Sector | ISIN Code |
| ASI Strategic Bond | 10 | Low | Sterling Strategic Bond |
GB00BWK27X12
|
| BM Brooks Macdonald Defensive Capital | 5 | Low | Targeted Absolute Return |
GB00B61MR835
|
| BMO North American Equity | 5.5 | Medium | North America | GB0030281405 |
| Fidelity Emerging Europe Middle East and Africa | 6.5 | High | Specialist | GB00B87Z7808 |
| Fidelity Global High Yield | 8 | Low | Sterling High Yield |
GB00B7K7SQ18
|
| Fidelity Global Property | 7 | Medium | Property Other |
GB00B7K2NZ09
|
| Fidelity UK Smaller Companies | 9.5 | High | UK Smaller Companies |
GB00B7VNMB18
|
| Fundsmith Equity | 7.5 | Medium | Global |
GB00B4Q5X527
|
| iShares Physical Gold ETC | 4 | Medium | Commodity & Energy ETF | IE00B4ND3602 |
| Marlborough European Multi-Cap | 6.5 | High | Europe Excluding UK | GB0001719730 |
| Premier Diversified Growth | 16 | Medium | Mixed Investment 40-85% Shares | GB00B8BJV423 |
| Slater Recovery | 6 | Medium | UK All Companies | GB0031554248 |
| Wise Multi-Asset Growth | 8.5 | Medium | Flexible Investment | GB0034272533 |
My Portfolio asset mix
My portfolio asset mix remains as shown below which has around a 63% exposure to equities.
-
- UK Equities 20%
- North American Equities 15%
- Asian/Emerging Market Equities 6%
- Japanese Equities 0%
- European Equities 7%
- Chinese equities 0%
- Other equity 7%
- Commodities and energy 5%
- UK Fixed Interest 4%
- Global Fixed Interest 14%
- Cash 5%
- Alternative Investment Strategies 9%
- Property 8%
Damien's higher risk and lower risk portfolios
Using the logic described in my post: Update to Damien’s alternative risk portfolios I created hypothetical higher and lower risk versions of my portfolio below:
Lower risk
| Fund | Allocation % |
| ASI Strategic Bond | 13 |
| BM Brooks Macdonald Defensive Capital | 6 |
| BMO North American Equity | 7 |
| Fidelity Global High Yield | 10 |
| Fidelity Global Property | 9 |
| Fundsmith Equity | 10 |
| iShares Physical Gold ETC | 5 |
| Premier Diversified Growth | 21 |
| Slater Recovery | 8 |
| Wise Multi-Asset Growth | 11 |
Higher risk
| Fund | Allocation % |
| BMO North American Equity | 8 |
| Fidelity Emerging Europe Middle East and Africa | 8 |
| Fidelity Global Property | 9 |
| Fidelity UK Smaller Companies | 12 |
| Fundsmith Equity | 10 |
| iShares Physical Gold ETC | 5 |
| Marlborough European Multi-Cap | 8 |
| Premier Diversified Growth | 21 |
| Slater Recovery | 8 |
| Wise Multi-Asset Growth | 11 |

£200 Pension Cashback Offer
Make a qualifying deposit or transfer a pension to our partner Interactive Investor.
- Deposit or transfer a pension of at least £20k and you could earn £200 cashback
- Terms and Fees apply, Capital at risk
- New & Existing customers opening a SIPP
- Offer ends 31st July 2026
Before starting your transfer, check you won't lose any valuable benefits (such as guaranteed annuity rates or a lower protected pension age) and find out what exit fees you might have to pay
