

The background to my portfolio
Back in March 2015 I decided to invest £50,000 of my own money using 80-20 Investor. The purpose was twofold, firstly to show how you can use 80-20 Investor to invest and outperform the market with only a few minutes effort every now and then. Secondly, no other investment commentator, journalist or research provider invests their own money for fear of failing. This is a sorry state of affairs and is precisely why I committed to openly running my own portfolio for 80-20 Investor members to see.
Since then I have periodically changed my portfolio using the fund suggestions provided by the 80-20 Investor algorithm and associated research. I always disclose the changes at the time they are made.
Performance update
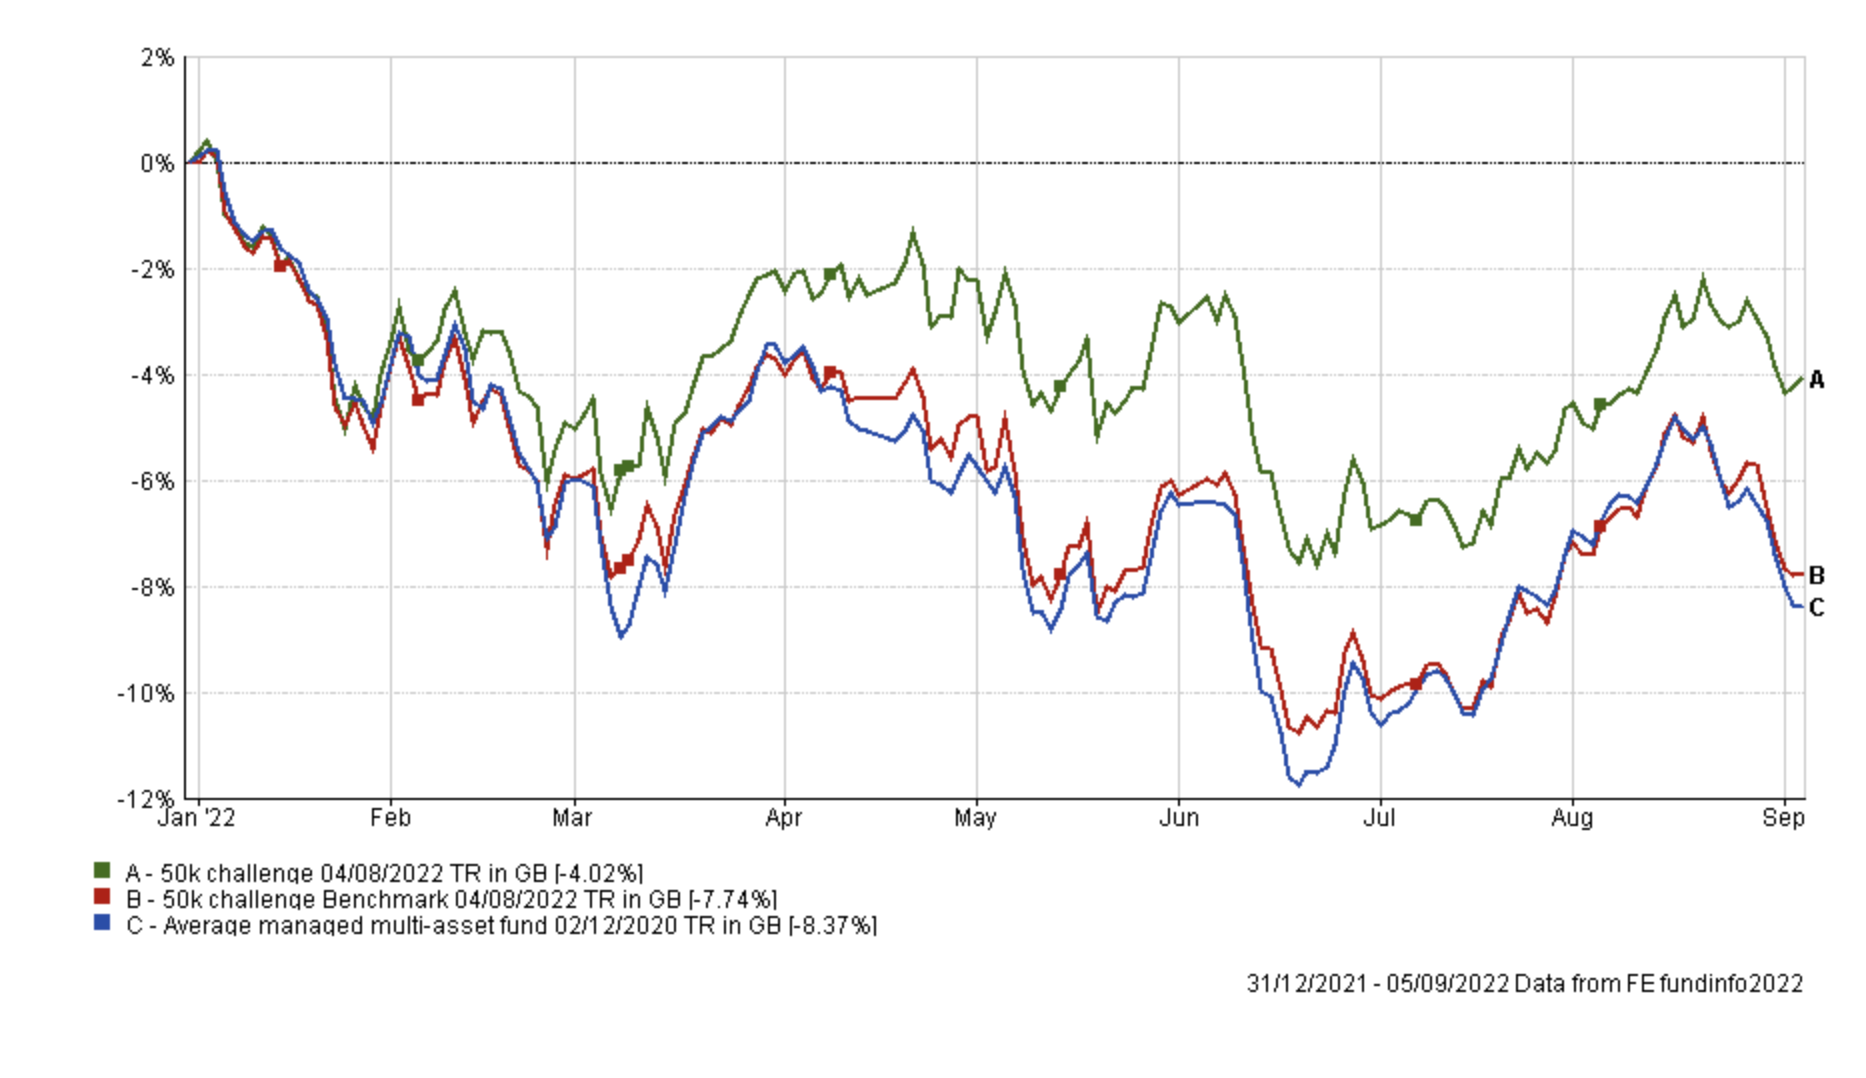
As is usual in my portfolio reviews, the chart below shows how my portfolio has outperformed since I started the challenge in March 2015, which is over seven years ago. The green line is the performance of my portfolio while the red line is the benchmark showing the average return achieved by professional fund managers given the same asset mix. To accurately calculate this I have used the average return for each sector in which my portfolio invested. The blue line shows what the average multi-asset fund with comparable equity content achieved. In other words, the red line would show the extra performance added by just the asset mix of my portfolio (where I was invested i.e European equities etc) over picking a typical multi-asset fund (the blue line). While the green line (which is my actual performance) shows the impact of being in the right funds at the right time, as identified by the 80-20 Investor algorithm.

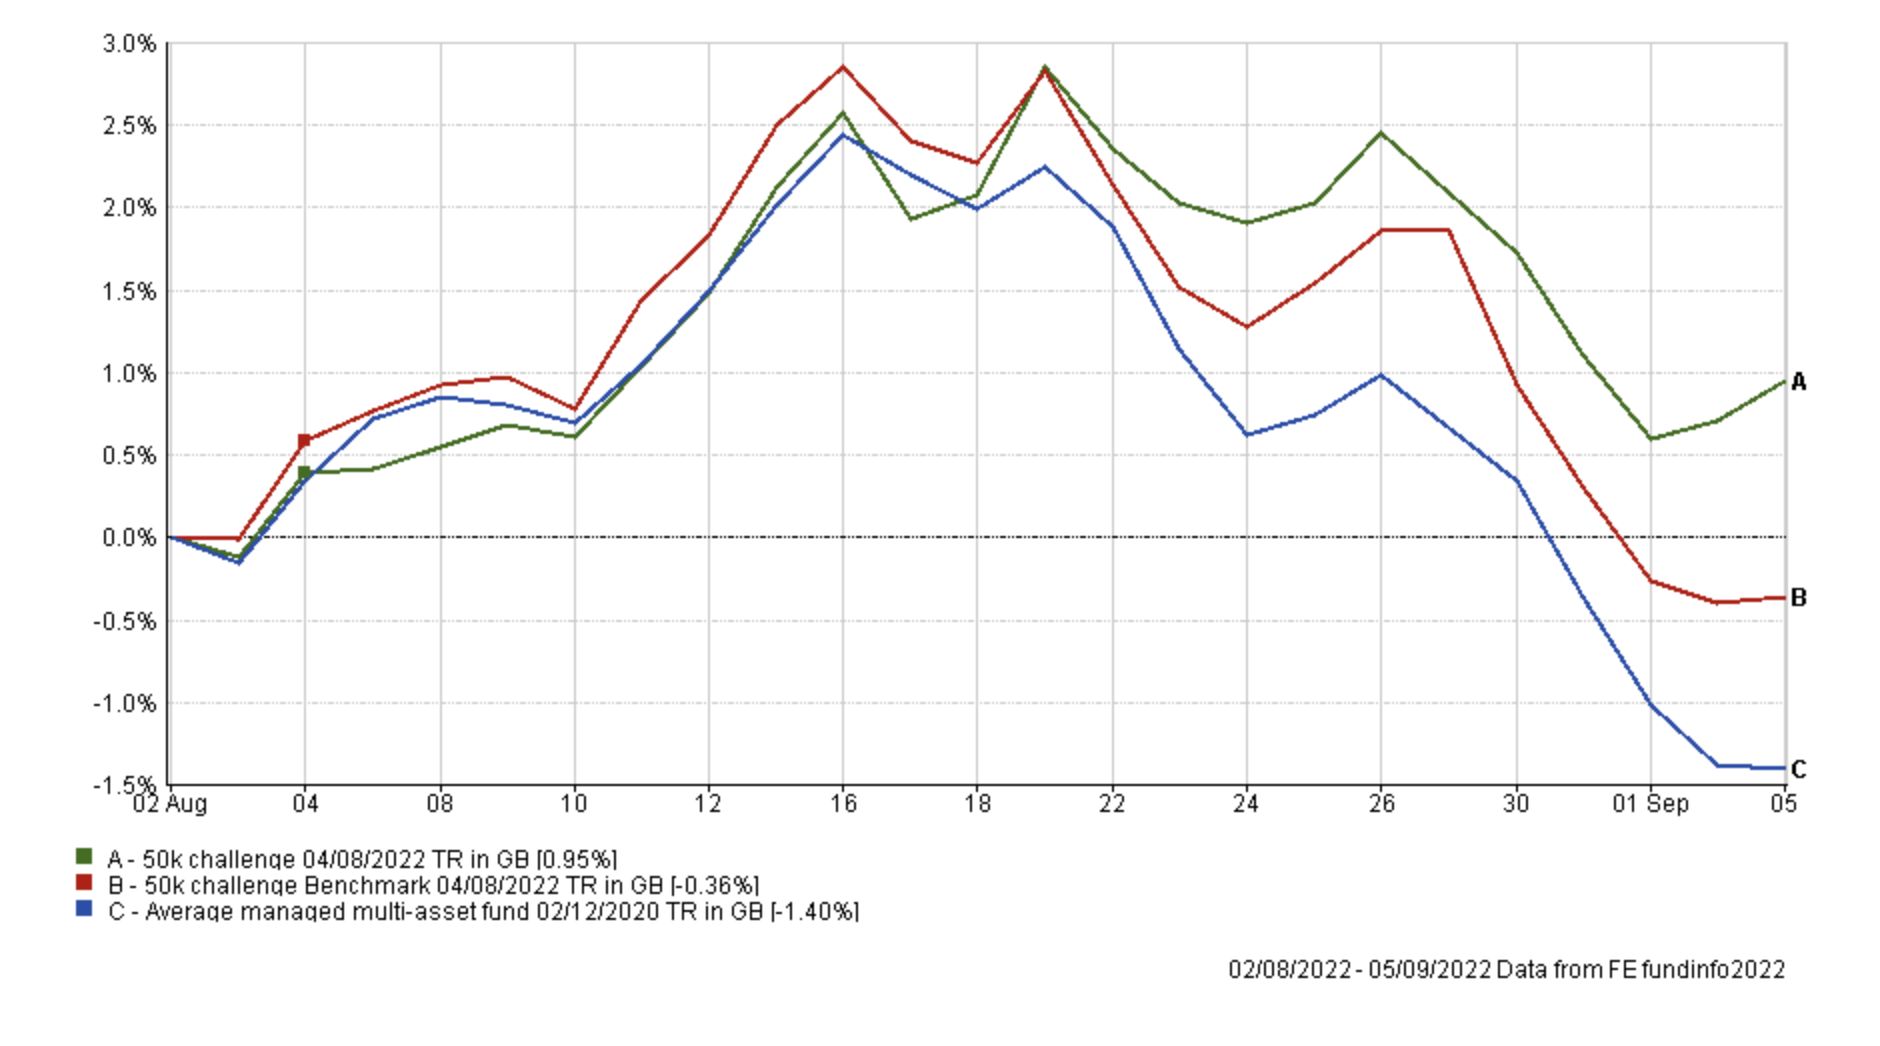
My portfolio continues to outperform its benchmarks over the long term. Since my last update at the start of August my £50k portfolio has produced a strong positive return, outperforming its benchmarks which both fell into negative territory for the month (as shown in the chart below).
The table below shows the individual performance of each holding in my portfolio since my last review a month ago.
| Holding | % return since last review on 2nd August |
| BlackRock Natural Resources Growth & Income | 9.2 |
| Fidelity American Special Situations | 4.12 |
| iShares Physical Gold ETC | 2.07 |
| Fidelity Index US | 2.02 |
| Janus Henderson Inst Overseas Bond | 1.09 |
| JOHCM Global Opportunities | 1.07 |
| Thesis TM Tellworth UK Select | 0.8 |
| Premier Miton Defensive Growth | 0.16 |
| Cash | 0.09 |
| M&G Global Dividend | 0.02 |
| McInroy & Wood Balanced | -0.33 |
| Troy Asset Management Ltd Trojan Ethical | -0.76 |
| Fidelity Global Property | -0.88 |
| Invesco UK Opportunities (UK) | -2.26 |
It was a great month for my £50k portfolio, made all the more impressive that it occurred during a month when both bond and equity markets struggled. As stated in my September monthly newsletter, during August US stocks endured their weakest August performance since 2015. Bond funds also tumbled as bond yields burst higher as markets began pricing in more hawkish policy decisions from central banks. UK corporate bond funds had their worst month in 4 years. UK gilts also had a dire month as concerns grew about the scale of government borrowing required to cope with the cost of living crisis.
With both bond and equity markets falling in tandem during August it was reminiscent of the first half of 2022. A case of déjà vu. The typical 60% equity / 40% bond portfolio struggled through its lack of diversification, falling by around 1.75% during August. My portfolio's exposure to commodities and alternative assets (typified by my holdings from the Targeted Absolute return sector) provided much-needed diversification during August and ultimately a performance boost, as it did in the first half of 2022. Meanwhile, my cash holding helped preserve capital.
My portfolio performance was also boosted by the 4.5% fall in the value of the pound against the dollar during August, which boosted my holdings in US equities as well as commodities. With the market narrative once again favouring a more hawkish US Federal Reserve, technology stocks, something I have little exposure to in my portfolio, were hit hard. This also helped my portfolio significantly outperform its benchmarks.
All these things worked in my favour in August (as they did in the first half of 2022), whereas they proved a drag on performance during the powerful market rally in July which ultimately proved a false dawn. Should the market narrative pivot once again, to one where investors believe central banks will become more dovish, then we will see a similar performance lag from my portfolio for a period of time.
The chart below shows the performance of my portfolio year to date against its benchmarks in order to give the summer moves some context.
As usual, the table below shows which funds within my portfolio are in the current BOTB or BFBS tables and which are not. Those funds in green are still in the BOTB while those in orange are not in the BOTB but remain in the BFBS list. Meanwhile, any funds in red have dropped out of both shortlists.
| Name | Allocation % (rounded) | Risk | Sector | ISIN Code |
| BlackRock Natural Resources Growth & Income | 4.00% | High | Commodity/Natural Resource | GB00B6865B79 |
| Cash | 6.50% | Low | ||
| Fidelity American Special Situations | 8.50% | Medium | North America | GB00B89ST706 |
| Fidelity Global Property | 8.00% | High | Property Other | GB00B7K2NZ09 |
| Fidelity Index US | 7.50% | High | North America | GB00BJS8SH10 |
| Invesco UK Opportunities (UK) | 5.00% | Medium | UK All Companies | GB00B1W7HM62 |
| iShares Physical Gold ETC | 5.00% | Medium | Commodity & Energy ETF | IE00B4ND3602 |
| Janus Henderson Inst Overseas Bond | 6.50% | Low | Global Bonds | GB0007673055 |
| JOHCM Global Opportunities | 10.25% | Medium | Global | GB00BJ5JMC04 |
| M&G Global Dividend | 6.50% | Medium | Global Equity Income | GB00B46J9127 |
| McInroy & Wood Balanced | 10.00% | Medium | Mixed Investment 40-85% Shares |
GB00B7RRJ163
|
| Premier Miton Defensive Growth | 9.00% | Low | Targeted Absolute Return | GB00B832BD89 |
| Thesis TM Tellworth UK Select | 5.25% | Low | Targeted Absolute Return | GB00BNY7YM73 |
| Troy Asset Management Ltd Trojan Ethical | 8.00% | Low | Flexible Investment | GB00BJP0XX17 |
With the Déjà vu feeling (rising bond yields and falling equity prices) returning to investment markets, my portfolio's fund selection and asset mix helped preserve the value of my portfolio, at least for now. Right now, there are only two funds (marked in red) that have fallen out of the BOTB and BFBS tables, one of them being Invesco UK Opportunities (UK) which I reduced my exposure to last month.
Troy Asset Management Ltd Trojan Ethical was in the BFBS as recently as last month, while Invesco UK Opportunities (UK) has been one of the strongest performers within its sector since late August, when the market narratives began reversing.
Unsurprisingly, with such a strong performance from the portfolio since my last review I don't plan to make any changes this month. In addition, the asset mix of my portfolio is in line with that of the BOTB, with the exception of its exposure to Asian and Japanese equities, the latter of which only rejoined the fold this month. As ever my portfolio is adaptive, and in time I will probably look to include them in my portfolio. For now, I plan to sit tight.
Fund switches
I am not making any fund switches within my portfolio this month.
My portfolio
My portfolio remains unchanged, as shown below:
| Name | Allocation % (rounded) | Risk | Sector | ISIN Code |
| BlackRock Natural Resources Growth & Income | 4.00% | High | Commodity/Natural Resource | GB00B6865B79 |
| Cash | 6.50% | Low | ||
| Fidelity American Special Situations | 8.50% | Medium | North America | GB00B89ST706 |
| Fidelity Global Property | 8.00% | High | Property Other | GB00B7K2NZ09 |
| Fidelity Index US | 7.50% | High | North America | GB00BJS8SH10 |
| Invesco UK Opportunities (UK) | 5.00% | Medium | UK All Companies | GB00B1W7HM62 |
| iShares Physical Gold ETC | 5.00% | Medium | Commodity & Energy ETF | IE00B4ND3602 |
| Janus Henderson Inst Overseas Bond | 6.50% | Low | Global Bonds | GB0007673055 |
| JOHCM Global Opportunities | 10.25% | Medium | Global | GB00BJ5JMC04 |
| M&G Global Dividend | 6.50% | Medium | Global Equity Income | GB00B46J9127 |
| McInroy & Wood Balanced | 10.00% | Medium | Mixed Investment 40-85% Shares |
GB00B7RRJ163
|
| Premier Miton Defensive Growth | 9.00% | Low | Targeted Absolute Return | GB00B832BD89 |
| Thesis TM Tellworth UK Select | 5.25% | Low | Targeted Absolute Return | GB00BNY7YM73 |
| Troy Asset Management Ltd Trojan Ethical | 8.00% | Low | Flexible Investment | GB00BJP0XX17 |
My Portfolio asset mix
My portfolio asset mix still has around 60% exposure to equities. Last month's figures are shown in brackets.
-
- UK Equities 12% (12%)
- North American Equities 22% (22%)
- Asian/Emerging Market Equities 0% (0%)
- Japanese Equities 0% (0%)
- European Equities 4% (4%)
- Chinese equities 0% (0%)
- Other equity 8% (8%)
- Commodities and energy 9% (9%)
- UK Fixed Interest 0% (0%)
- Global Fixed Interest 11% (11%)
- Cash 6% (6%)
- Alternative Investment Strategies 20% (20%)
- Property 8% (8%)
Damien's higher risk and lower risk portfolios
Using the logic described in my post: Update to Damien’s alternative risk portfolios I created hypothetical higher and lower risk versions of my portfolio below:
Lower risk
| Fund | Allocation % |
| Cash | 8 |
| Fidelity American Special Situations | 11 |
| Invesco UK Opportunities (UK) | 6 |
| iShares Physical Gold ETC | 6 |
| Janus Henderson Inst Overseas Bond | 8 |
| JOHCM Global Opportunities | 13 |
| M&G Global Dividend | 8 |
| McInroy & Wood Balanced | 12 |
| Premier Miton Defensive Growth | 11 |
| Thesis TM Tellworth UK Select | 7 |
| Troy Asset Management Ltd Trojan Ethical | 10 |
Higher risk
| Fund | Allocation % |
| BlackRock Natural Resources Growth & Income | 6 |
| Fidelity American Special Situations | 13 |
| Fidelity Global Property | 12 |
| Fidelity Index US | 12 |
| Invesco UK Opportunities (UK) | 8 |
| iShares Physical Gold ETC | 8 |
| JOHCM Global Opportunities | 16 |
| M&G Global Dividend | 10 |
| McInroy & Wood Balanced | 15 |

£200 Pension Cashback Offer
Make a qualifying deposit or transfer a pension to our partner Interactive Investor.
- Deposit or transfer a pension of at least £20k and you could earn £200 cashback
- Terms and Fees apply, Capital at risk
- New & Existing customers opening a SIPP
- Offer ends 31st July 2026
Before starting your transfer, check you won't lose any valuable benefits (such as guaranteed annuity rates or a lower protected pension age) and find out what exit fees you might have to pay
