

The background to my portfolio
Back in March 2015 I decided to invest £50,000 of my own money using 80-20 Investor. The purpose was twofold, firstly to show how you can use 80-20 Investor to invest and outperform the market with only a few minutes effort every now and then. Secondly, no other investment commentator, journalist or research provider invests their own money for fear of failing. This is a sorry state of affairs and is precisely why I committed to openly running my own portfolio for 80-20 Investor members to see.
Since then I have periodically changed my portfolio using the fund suggestions provided by the 80-20 Investor algorithm and associated research. I always disclose the changes at the time they are made.
Performance update
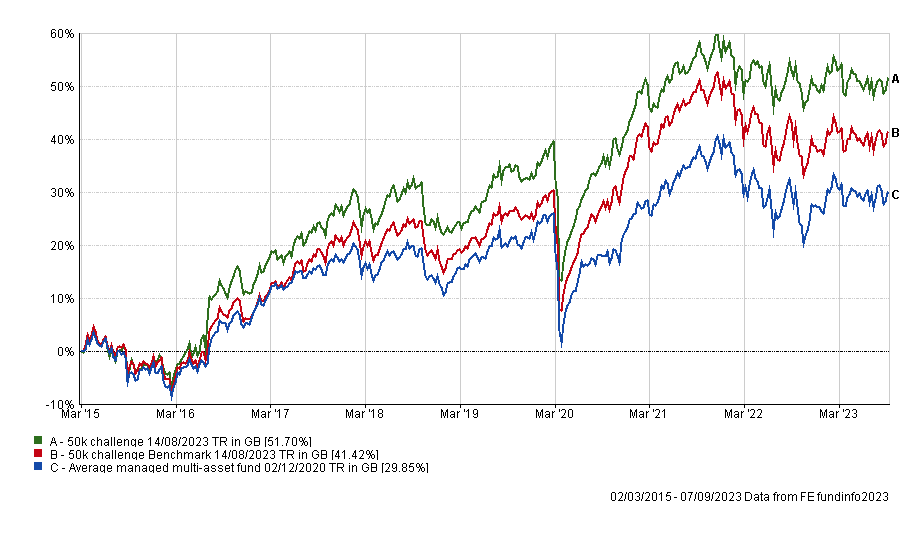
As is usual in my portfolio reviews, the chart below shows how my portfolio has outperformed since I started the challenge in March 2015. The green line is the performance of my portfolio while the red line is the benchmark showing the average return achieved by professional fund managers given the same asset mix. To accurately calculate this I have used the average return for each sector in which my portfolio invested. The blue line shows what the average multi-asset fund with comparable equity content achieved. In other words, the red line would show the extra performance added by just the asset mix of my portfolio (where I was invested i.e European equities etc) over picking a typical multi-asset fund (the blue line). While the green line (which is my actual performance) shows the impact of being in the right funds at the right time, as identified by the 80-20 Investor algorithm.
The biggest performance drivers during the month were the Fidelity Index Japan and Fidelity American funds. This is particularly pleasing given that the latter was only added to my portfolio as a result of last month's portfolio review. The table below shows the performance of the funds within my portfolio since my last review in August and it is almost the complete reverse of the performance leaderboard we saw last time, when Thesis TM Tellworth UK Select was the portfolio's worst performing fund.
| Name | % return since 9th August 2023 |
| Fidelity Index Japan | 3.74 |
| Fidelity American | 3.08 |
| Thesis TM Tellworth UK Select | 2.26 |
| iShares Physical Gold ETC | 1.8 |
| abrdn High Yield Bond | 0.8 |
| Troy Asset Management Ltd Trojan Global Equity | 0.8 |
| BNY Mellon Multi-Asset Balanced | 0.39 |
| Moneyfacts 90 Days Notice 100K | 0.3 |
| BNY Mellon Global Dynamic Bond | -0.42 |
| TB Saracen Global Income and Growth | -0.62 |
| Fundsmith Equity | -0.93 |
| TB Evenlode Global Income | -1.36 |
| CT European Select | -2.04 |
As usual the table below shows which funds within my portfolio are in the current BOTB or BFBS tables and which are not. Those funds in blue are still in the BOTB while those in orange are not in the BOTB but remain in the BFBS list. Meanwhile, any funds in red have dropped out of both shortlists.
| Fund | Allocation | Risk | Sector | ISIN |
| abrdn High Yield Bond | 12 | Low | Sterling High Yield |
GB00B79RR984
|
| BNY Mellon Global Dynamic Bond | 8.5 | Low | Targeted Absolute Return | GB00B8K10865 |
| BNY Mellon Multi-Asset Balanced | 6 | Medium | Mixed Investment 40-85% Shares | GB00B8K9JZ06 |
| Cash | 7 | Low | ||
| CT European Select | 6 | High | Europe Excluding UK | GB0001529345 |
| Fidelity American | 10 | Medium | North America |
GB00B8GPC429
|
| Fidelity Index Japan | 5 | Medium | Japan |
GB00BHZK8872
|
| Fundsmith Equity | 10 | Medium | Global |
GB00B4Q5X527
|
| iShares Physical Gold ETC | 5 | Medium | Commodity & Energy ETF | IE00B4ND3602 |
| TB Evenlode Global Income | 7 | Medium | Global Equity Income |
GB00BF1QMV61
|
| TB Saracen Global Income & Growth | 9.5 | Medium | Global Equity Income | GB00B5B35X02 |
| Thesis TM Tellworth UK Select | 5.5 | Low | Targeted Absolute Return |
GB00BNY7YM73
|
| Troy Asset Management Ltd Trojan Global Equity | 8.5 | Medium | Global | GB00B0ZJ5S47 |
Four funds are now outside out the BOTB and BFBS tables and are coloured in red. These are:
- BNY Mellon Multi-Asset Balanced
- Fundsmith Equity
- TB Evenlode Global Income
- TB Saracen Global Income & Growth
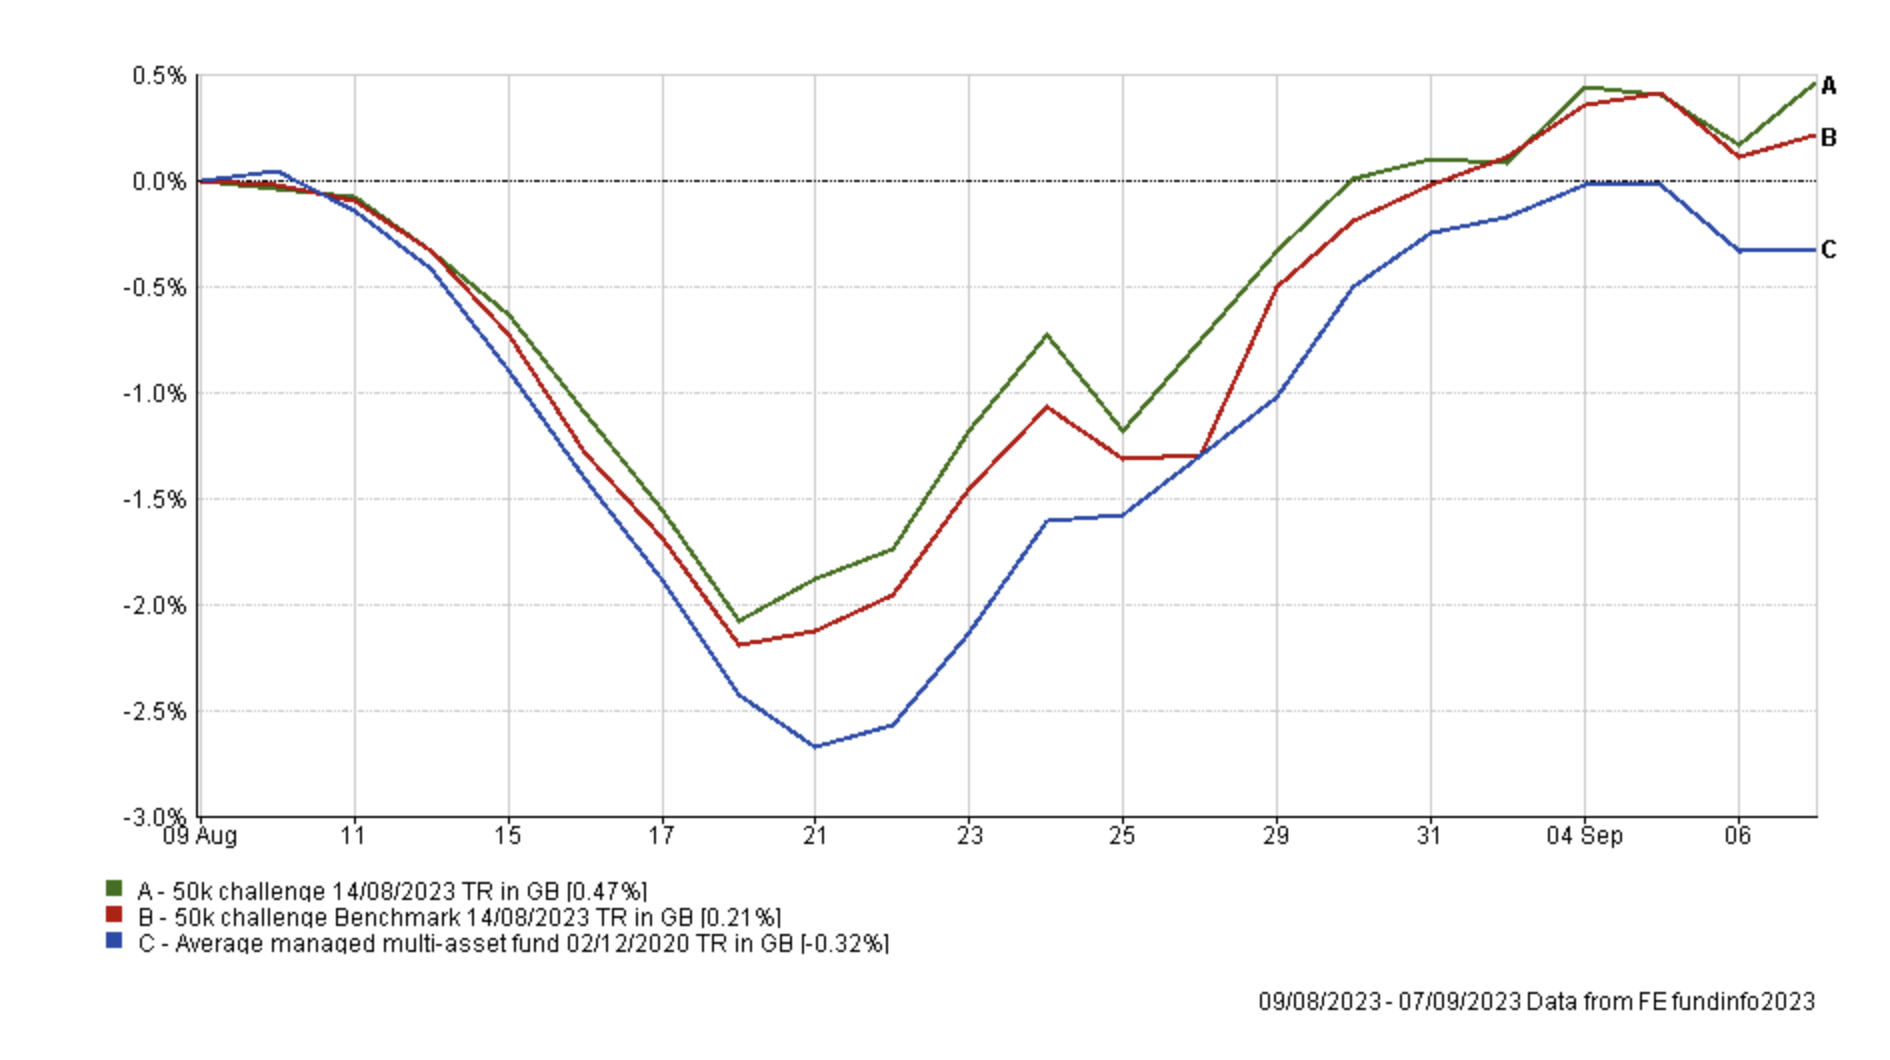
However it is worth giving the portfolio's recent performance some context. Since my last review a month ago, my portfolio has performed well during a difficult month for UK investors. If we take the two unit trust sectors of professionally managed multi-asset funds, namely the Mixed Investment 20-60% Shares sector and the Mixed Investment 40-85% Shares sector, the average fund performance in each sector over the period was -0.43% for the former and -0.32% for the latter. This compares to a 0.47% gain from my portfolio.
Furthermore, if you placed my portfolio in the more adventurous Mixed Investment 40-85% Shares sector it would have ranked 12th out of 262 funds for performance over the last month. If we include the more cautious funds from the Mixed Investment 20-60% Shares sector as well, then my portfolio would have ranked 14 out of 465 funds in total. That's because it was a tricky month as mentioned, where excessive risk was punished but also where alternative strategies and gold outperformed bonds,
In other words my portfolio is currently working in this volatile and changing environment. It emphasises the point that large scale changes this month are likely to be unwise or unwarranted.
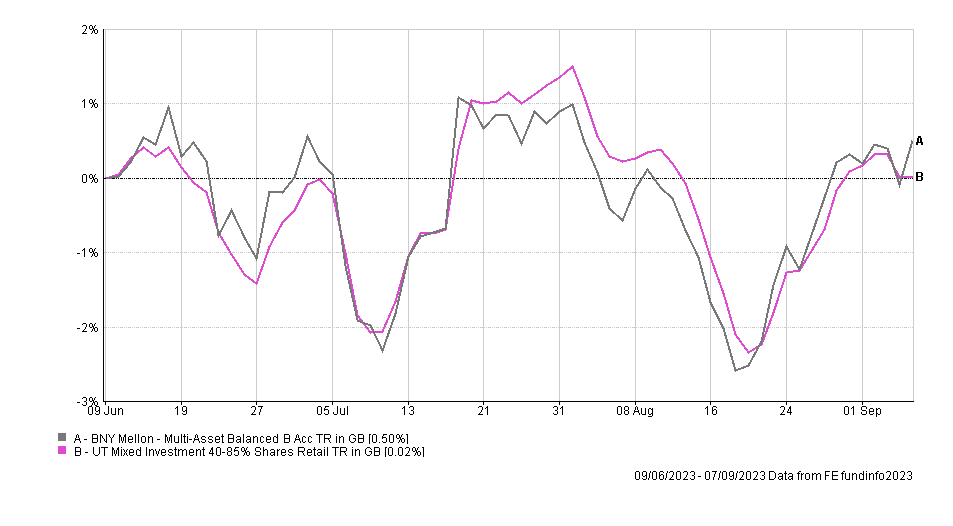
So with this caveat in mind I have reviewed my portfolio this month. Firstly, BNY Mellon Multi-Asset Balanced has marginally outperformed its peer group average since I've held it as shown in the chart below. This is a period where the worst performers from the sector have fallen more than 3%.
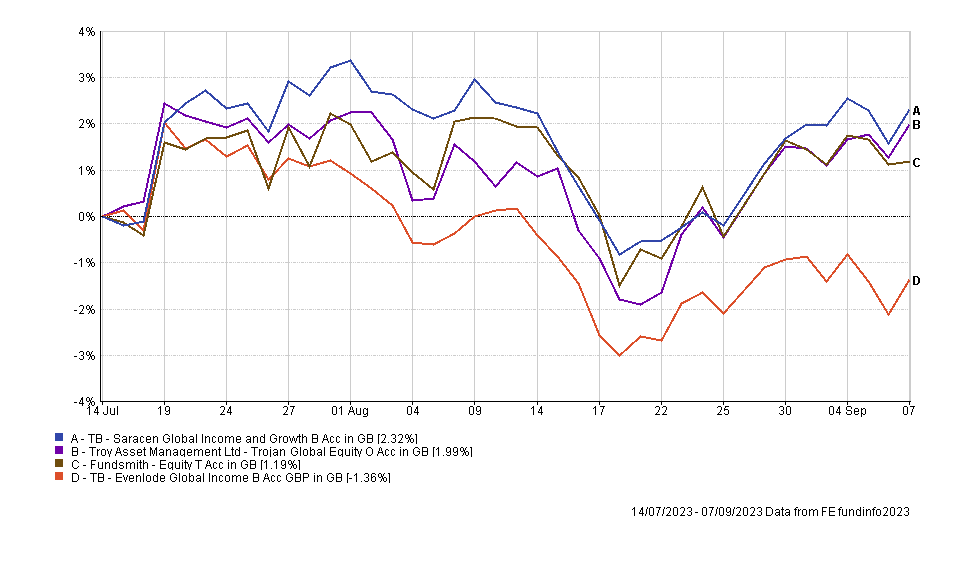
A recent addition to the portfolio has been Troy Asset Management Ltd Trojan Global Equity which is currently in the BOTB and has performed well since its inclusion. It also provides a good performance comparison for the other three funds in my portfolio that have global equity exposure. The chart below shows the performance of all four funds since the addition of the Trojan fund back in July.
Of course, 80-20 Investor's algorithm looks beyond such short-term price moves when assessing momentum, however, the underperformance of the TB Evenlode Global Income has been a feature that started soon after I introduced it into my portfolio. The main driver behind its underperformance is its 43% exposure to European equities, which also happens to be the fund's highest allocation to any geographical region. This is unusual for a global equity fund as they usually are US-focused. However, if you look at the earlier performance table, the only fund to underperform the TB Evenlode Global Income in the last month was the CT European Select, which is the only pure European equity fund within my portfolio.
So while TB Saracen Global Income & Growth & Fundsmith Equity are certainly on my watchlist, their recent performance doesn't warrant a knee-jerk reaction. As I mentioned earlier, the portfolio as a whole has worked well in the latest period of market volatility and sector rotations so I don't want to make significant changes, instead favouring a wait and see approach.
However, I think the TB Evenlode Global Income fund is a more pressing issue. There has been a trend over recent months of reducing the European equity exposure in the BOTB which has been to its benefit. By replacing the TB Evenlode Global Income fund I would achieve a similar feat within my own £50k portfolio and if you recall I reduced my direct European equity exposure last month too.
Therefore looking at my portfolio and the BOTB and BFBS tables an obvious choice for the sale proceeds from the TB Evenlode Global Income fund would be Trojan Global Equity. However, that would increase the portfolio's allocation to that fund to around 15% which is way too high for one equity fund. So instead I plan to put some of the proceeds into the Trojan Global Equity fund, with the rest going into the T. Rowe Price US Large Cap Growth Equity fund. Initially I looked at alternative global equity or global equity income funds, but a number of those listed in the current BOTB or BFBS are currently unavailable on my fund platform (which is something I will look into). However the T. Rowe Price US Large Cap Growth Equity has been a regular in the BOTB for many months. It is US-focused, so it will marginally increase my exposure to US equities, and is higher risk than the equity income fund that it replaces. However the holding will be less than 5% of the portfolio size, so it won't materially increase the risk profile of my portfolio.
As the rest of the funds within my portfolio remain in the BOTB and BFBS tables, I will leave them be for now. At the lower risk end of my portfolio I am still sitting on some cash awaiting opportunities to re-invest. But I plan to hold fire for the time being given the portfolio's recent performance and the guaranteed 3% annual interest rate my investment platform of choice now pays me on cash.
Fund switches
- 100% out of TB Evenlode Global Income and 25% into Troy Asset Management Ltd Trojan Global Equity and 75% into T. Rowe Price US Large Cap Growth Equity
The fund changes mean that the number of holdings within my portfolio will remain the same. The switches only impact approximately 7% of my portfolio while keeping my portfolio's equity exposure at around 63%.
My portfolio
My portfolio now looks like this:
| Fund | Allocation | Risk | Sector | ISIN |
| abrdn High Yield Bond | 12 | Lower | Sterling High Yield | GB00B79RR984 |
| BNY Mellon Global Dynamic Bond | 8.5 | Lower | Targeted Absolute Return | GB00B8K10865 |
| BNY Mellon Multi-Asset Balanced | 6 | Medium | Mixed Investment 40-85% Shares | GB00B8K9JZ06 |
| Cash | 7 | Lower | ||
| CT European Select | 6 | Higher | Europe Excluding UK | GB0001529345 |
| Fidelity American | 10 | Medium | North America | GB00B8GPC429 |
| Fidelity Index Japan | 5 | Medium | Japan | GB00BHZK8872 |
| Fundsmith Equity | 10 | Medium | Global | GB00B4Q5X527 |
| iShares Physical Gold ETC | 5 | Medium | Commodity & Energy ETF | IE00B4ND3602 |
| T. Rowe Price US Large Cap Growth Equity | 5 | Higher | North America | GB00BD5FHW12 |
| TB Saracen Global Income & Growth | 9.5 | Medium | Global Equity Income | GB00B5B35X02 |
| Thesis TM Tellworth UK Select | 5.5 | Lower | Targeted Absolute Return | GB00BNY7YM73 |
| Troy Asset Management Ltd Trojan Global Equity | 10.5 | Medium | Global | GB00B0ZJ5S47 |
My Portfolio asset mix
My portfolio asset mix has around 63% exposure to equities. Last month's figures are shown in brackets.
-
- UK Equities 9% (10%)
- North American Equities 29% (28%)
- Asian/Emerging Market Equities 0% (0%)
- Japanese Equities 5% (5%)
- European Equities 13% (16%)
- Chinese equities 0% (0%)
- Other equity 7% (3%)
- Commodities and energy 5% (5%)
- UK Fixed Interest 0% (0%)
- Global Fixed Interest 20% (20%)
- Cash 8% (8%)
- Alternative Investment Strategies 4% (5%)
- Property 0% (0%)
Damien's higher risk and lower risk portfolios
Using the logic described in my post: Update to Damien’s alternative risk portfolios I created hypothetical higher and lower risk versions of my portfolio below:
Lower risk
| Fund | Allocation % |
| abrdn High Yield Bond | 13 |
| BNY Mellon Global Dynamic Bond | 10 |
| BNY Mellon Multi-Asset Balanced | 7 |
| Cash | 8 |
| Fidelity American | 11 |
| Fidelity Index Japan | 6 |
| Fundsmith Equity | 11 |
| iShares Physical Gold ETC | 6 |
| TB Saracen Global Income & Growth | 11 |
| Thesis TM Tellworth UK Select | 6 |
| Troy Asset Management Ltd Trojan Global Equity | 11 |
Higher risk
| Fund | Allocation % |
| BNY Mellon Multi-Asset Balanced | 9 |
| CT European Select | 9 |
| Fidelity American | 15 |
| Fidelity Index Japan | 7 |
| Fundsmith Equity | 15 |
| iShares Physical Gold ETC | 7 |
| T. Rowe Price US Large Cap Growth Equity | 8 |
| TB Saracen Global Income & Growth | 14 |
| Troy Asset Management Ltd Trojan Global Equity | 16 |

£200 Pension Cashback Offer
Make a qualifying deposit or transfer a pension to our partner Interactive Investor.
- Deposit or transfer a pension of at least £20k and you could earn £200 cashback
- Terms and Fees apply, Capital at risk
- New & Existing customers opening a SIPP
- Offer ends 31st July 2026
Before starting your transfer, check you won't lose any valuable benefits (such as guaranteed annuity rates or a lower protected pension age) and find out what exit fees you might have to pay
