

The background to my portfolio
Back in March 2015 I decided to invest £50,000 of my own money using 80-20 Investor. The purpose was twofold, firstly to show how you can use 80-20 Investor to invest and outperform the market with only a few minutes effort every now and then. Secondly, no other investment commentator, journalist or research provider invests their own money for fear of failing. This is a sorry state of affairs and is precisely why I committed to openly running my own portfolio for 80-20 Investor members to see.
Since then I have periodically changed my portfolio using the fund suggestions provided by the 80-20 Investor algorithm and associated research. I always disclose the changes at the time they are made.
Performance update
As is usual in my portfolio reviews, the chart below shows how my portfolio has outperformed since I started the challenge in March 2015, almost five years ago. The green line is the performance of my portfolio while the red line is the benchmark showing the average return achieved by professional fund managers given the same asset mix. To accurately calculate this I have used the average return for each sector in which my portfolio invested. The blue line shows what the average multi-asset fund with comparable equity content achieved. In other words, the red line would show the extra performance added by just the asset mix of my portfolio (where I was invested i.e European equities etc) over picking a typical multi-asset fund (the blue line). While the green line (which is my actual performance) shows the impact of being in the right funds at the right time, as identified by the 80-20 Investor algorithm.
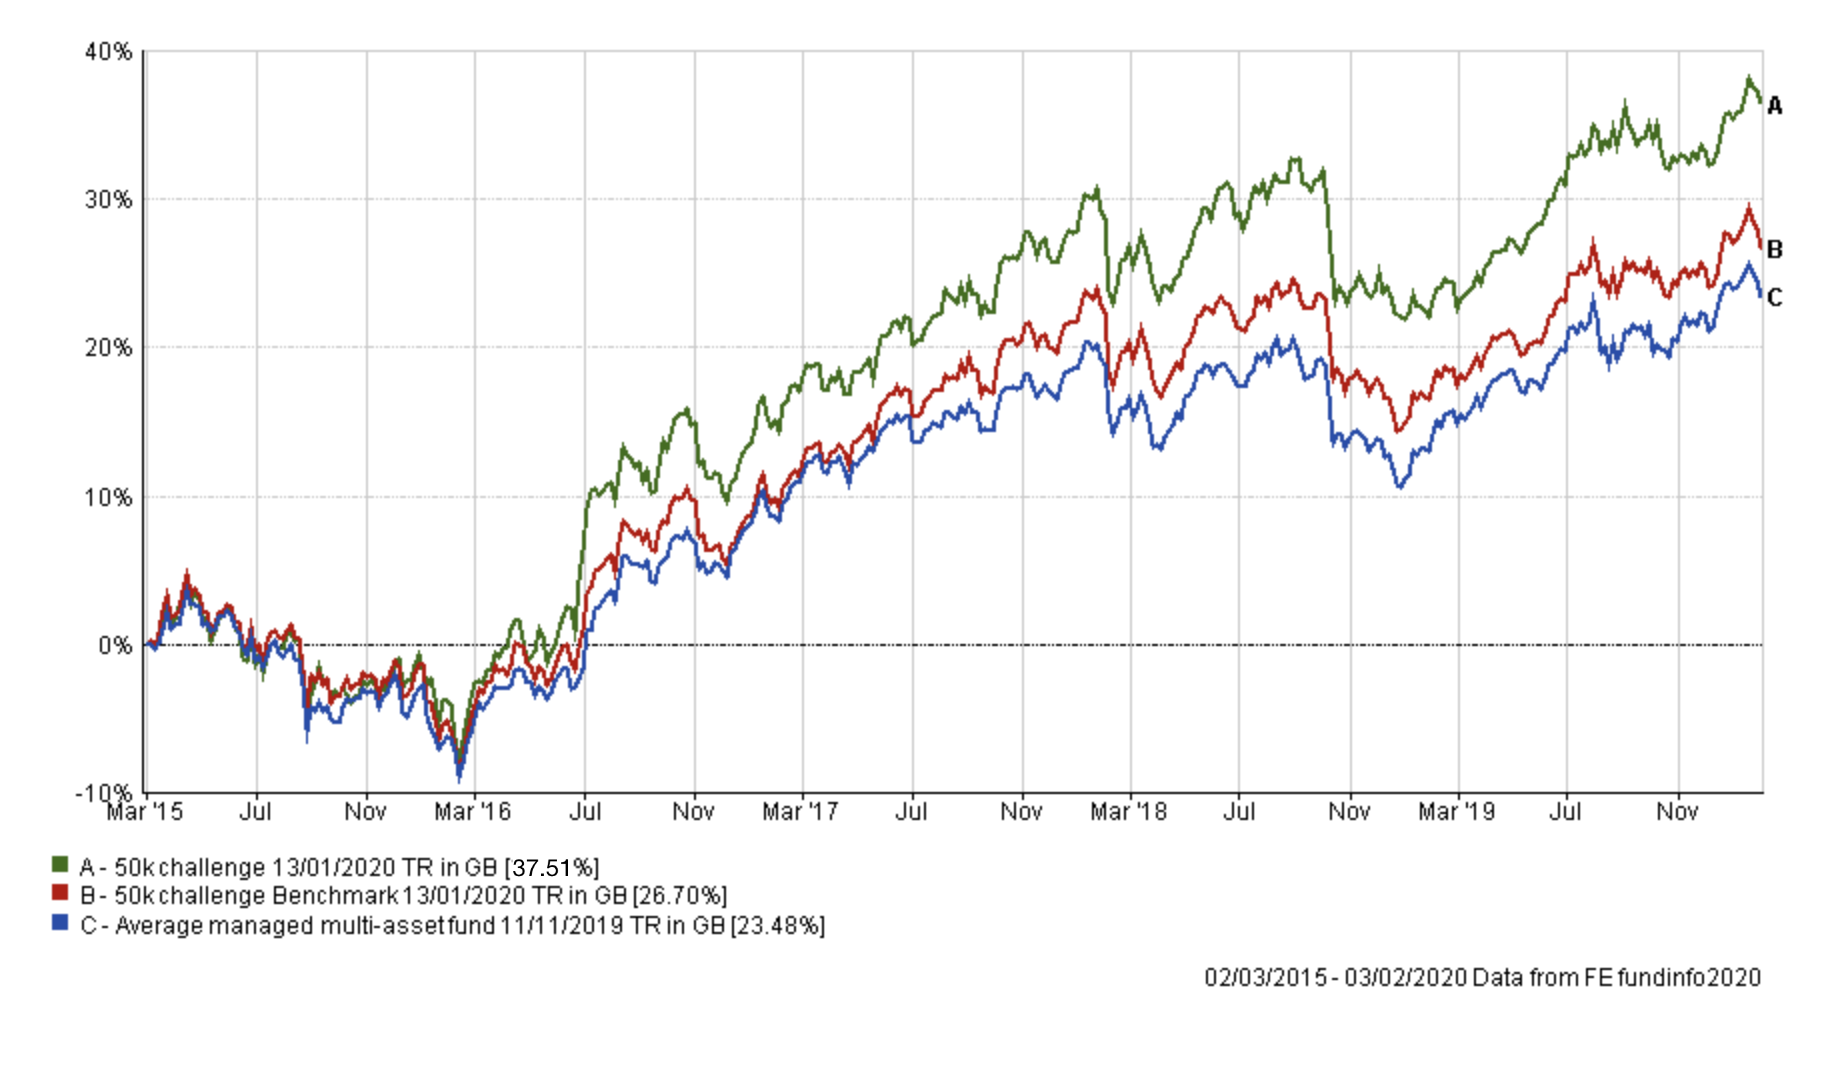
Last month I made a number of changes to my portfolio to reduce my unhedged US equity exposure while increasing my UK equity exposure. I also wanted to reduce my emerging market debt exposure in favour of UK fixed interest. If you look at the performance of my portfolio since the start of the year compared to its benchmarks you can see that the moves boosted my portfolio's performance
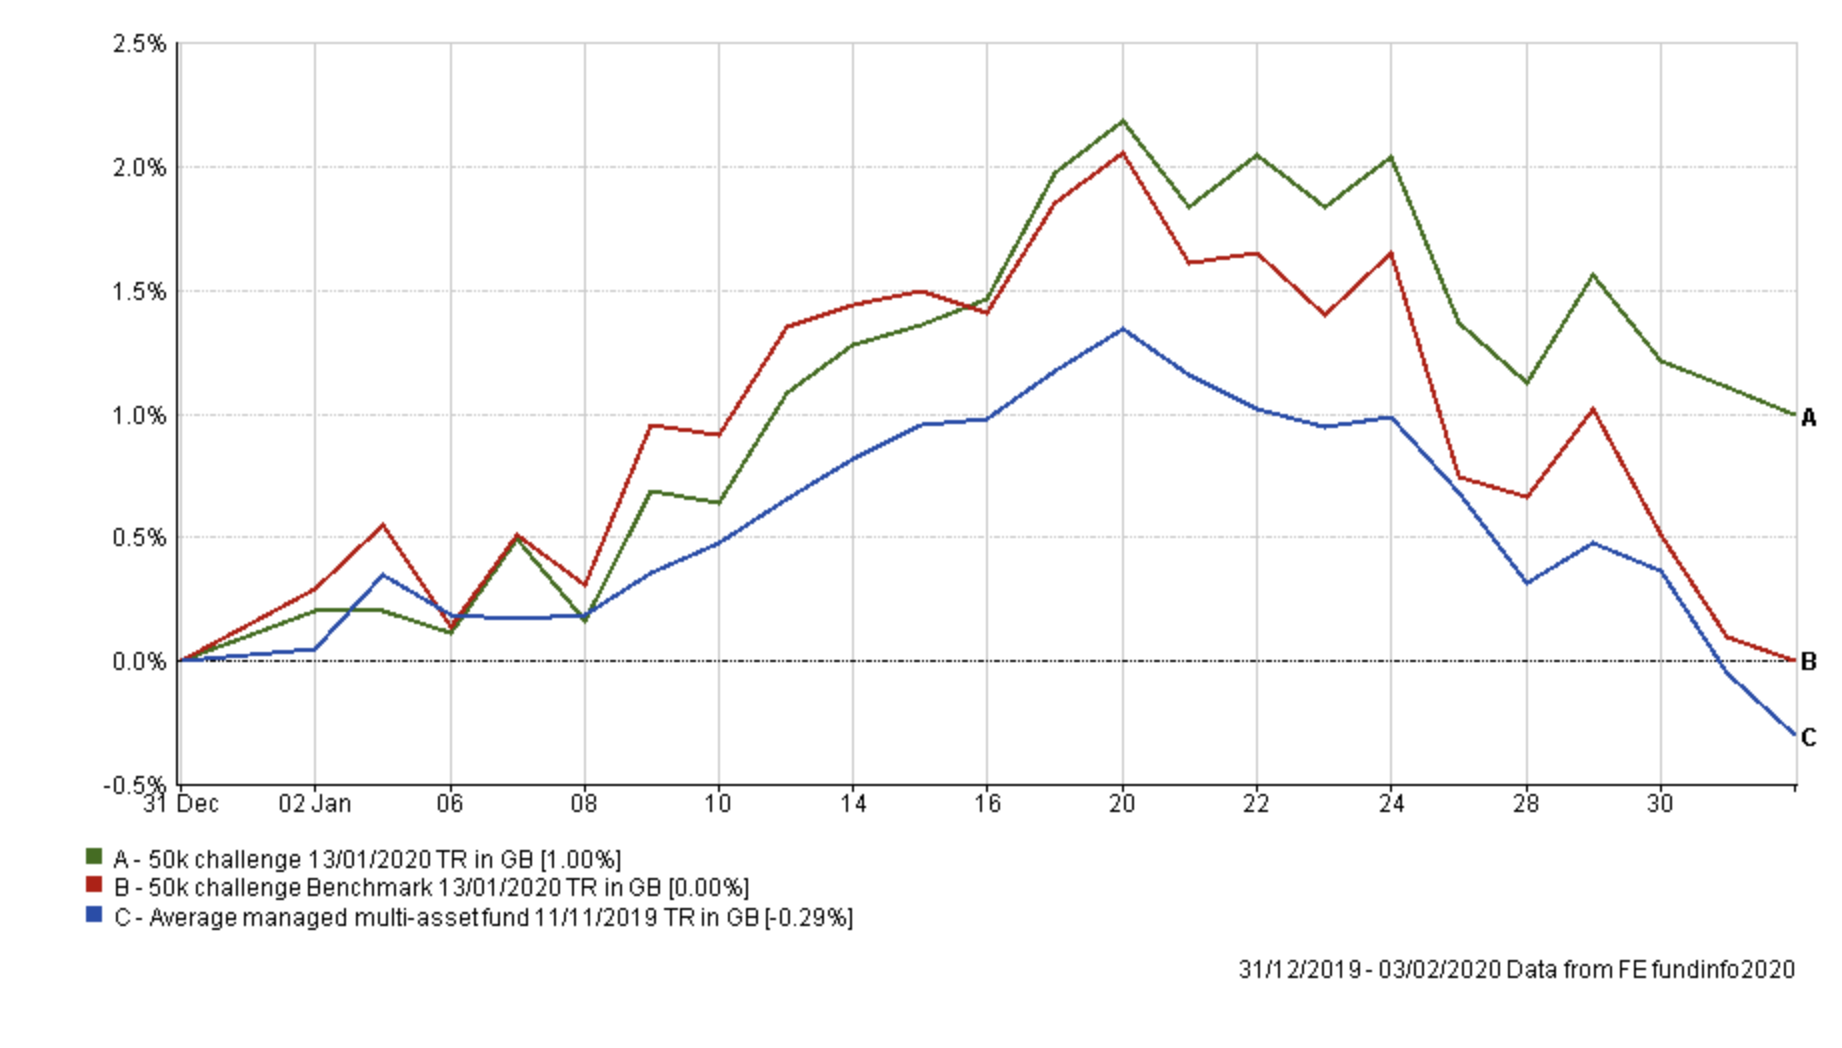
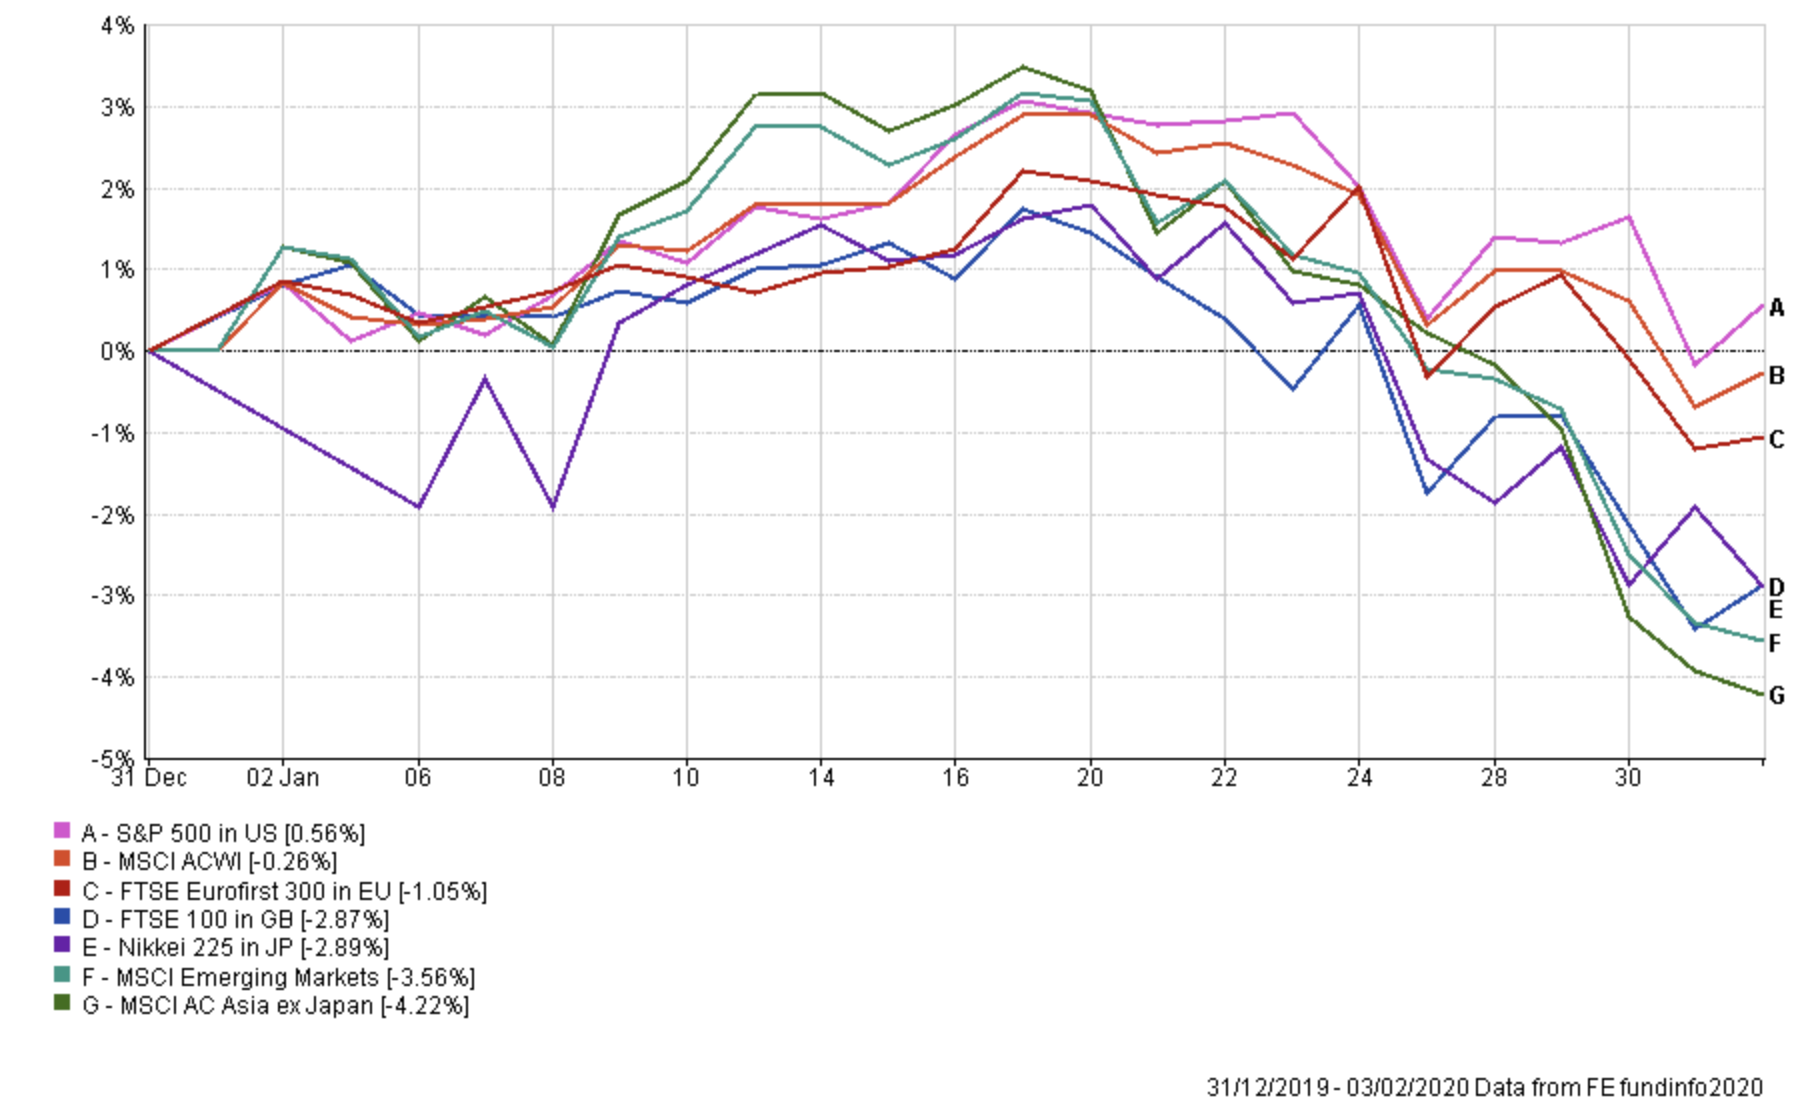
Obviously I am very pleased with this given how the coronavirus knocked equity markets for six as shown in the chart below as concerns of a global recession reemerged.
My portfolio was able to still make a profit because of its defensive core (of utilities and REITs). The table below shows the performance of each fund within my portfolio, year to date, in order to highlight the key performance drivers. The M&G fund has a focus on utilities while the property funds listed hold REITs.
| Name | Year to date % |
| M&G Global Listed Infrastructure | 3.3 |
| ASI Global Real Estate Share | 2.35 |
| Liontrust Sustainable Future Corporate Bond | 2.28 |
| ASI Emerging Markets Bond | 1.39 |
| VT Gravis Clean Energy Income | 1.2 |
| Slater Growth | 1.07 |
| Janus Henderson Fixed Interest Monthly Income | 1.07 |
| BNY Mellon Real Return Sterling | 0.81 |
| ASI UK Real Estate Share | 0.42 |
| Fidelity European | -0.22 |
| Premier Diversified Growth | -0.65 |
| Jupiter Japan Income | -1.15 |
While you can't plan for a black swan style event such as the coronavirus it shows the benefit of diversification and not chasing short-term moves as a result of your FOMO (fear of missing out).
Setting aside short-term moves and focusing back on the 80-20 Investor process, the table below shows which funds within my portfolio are in the current BOTB or BFBS tables and which are not. Those funds in green are still in the BOTB while those in yellow are not in the BOTB but remain in the BFBS list. Meanwhile, any funds in red have dropped out of both shortlists.
| Name | Allocation % (rounded) | Risk | Sector | ISIN Code |
| ASI Emerging Markets Bond | 5 | Low | Global Emerging Markets Bond | GB00B5L9HN22 |
| ASI Global Real Estate Share | 3.5 | High | Property Other | GB00B7MR5W47 |
| BNY Mellon Real Return | 11 | Low | Targeted Absolute Return | GB0001642635 |
| Fidelity European | 7 | Medium | Europe Excluding UK | GB00BFRT3504 |
| Janus Henderson Fixed Interest Monthly Income | 16 | Low | Sterling Strategic Bond | GB0001920486 |
| Jupiter Japan Income | 9 | Medium | Japan | GB00B0HZTZ55 |
| M&G Global Listed Infrastructure | 7 | Medium | Global | GB00BF00R928 |
| Slater Growth | 10 | Medium | UK All Companies | GB00B0706C66 |
| VT Gravis Clean Energy Income | 14 | Medium | Global | GB00BFN4H792 |
| ASI UK Real Estate Share | 3.5 | High | Property Other | GB00B0XWNN66 |
| Liontrust Sustainable Future Corporate Bond | 5 | Low | Sterling Corporate Bond | GB0030029069 |
| Premier Diversified Growth | 9 | Medium | Mixed Investment 40-85% Shares | GB00B8BJV423 |
As you can see, only two funds have fallen out of the 80-20 Investor tables and are marked in red. Also, it is interesting to see the M&G Global Infrastructure fund (with its exposure to utilities) has stormed back into the BOTB table after slipping out altogether in January.
It backs up my approach of not making knee-jerk reactions but instead looking to drip in and out of funds where possible.
Of the two funds that have fallen out of the BOTB and BFBS tables, the Fidelity European, in particular, is notable for its continued absence. That chart below shows how the fund has performed since I first bought it in November.
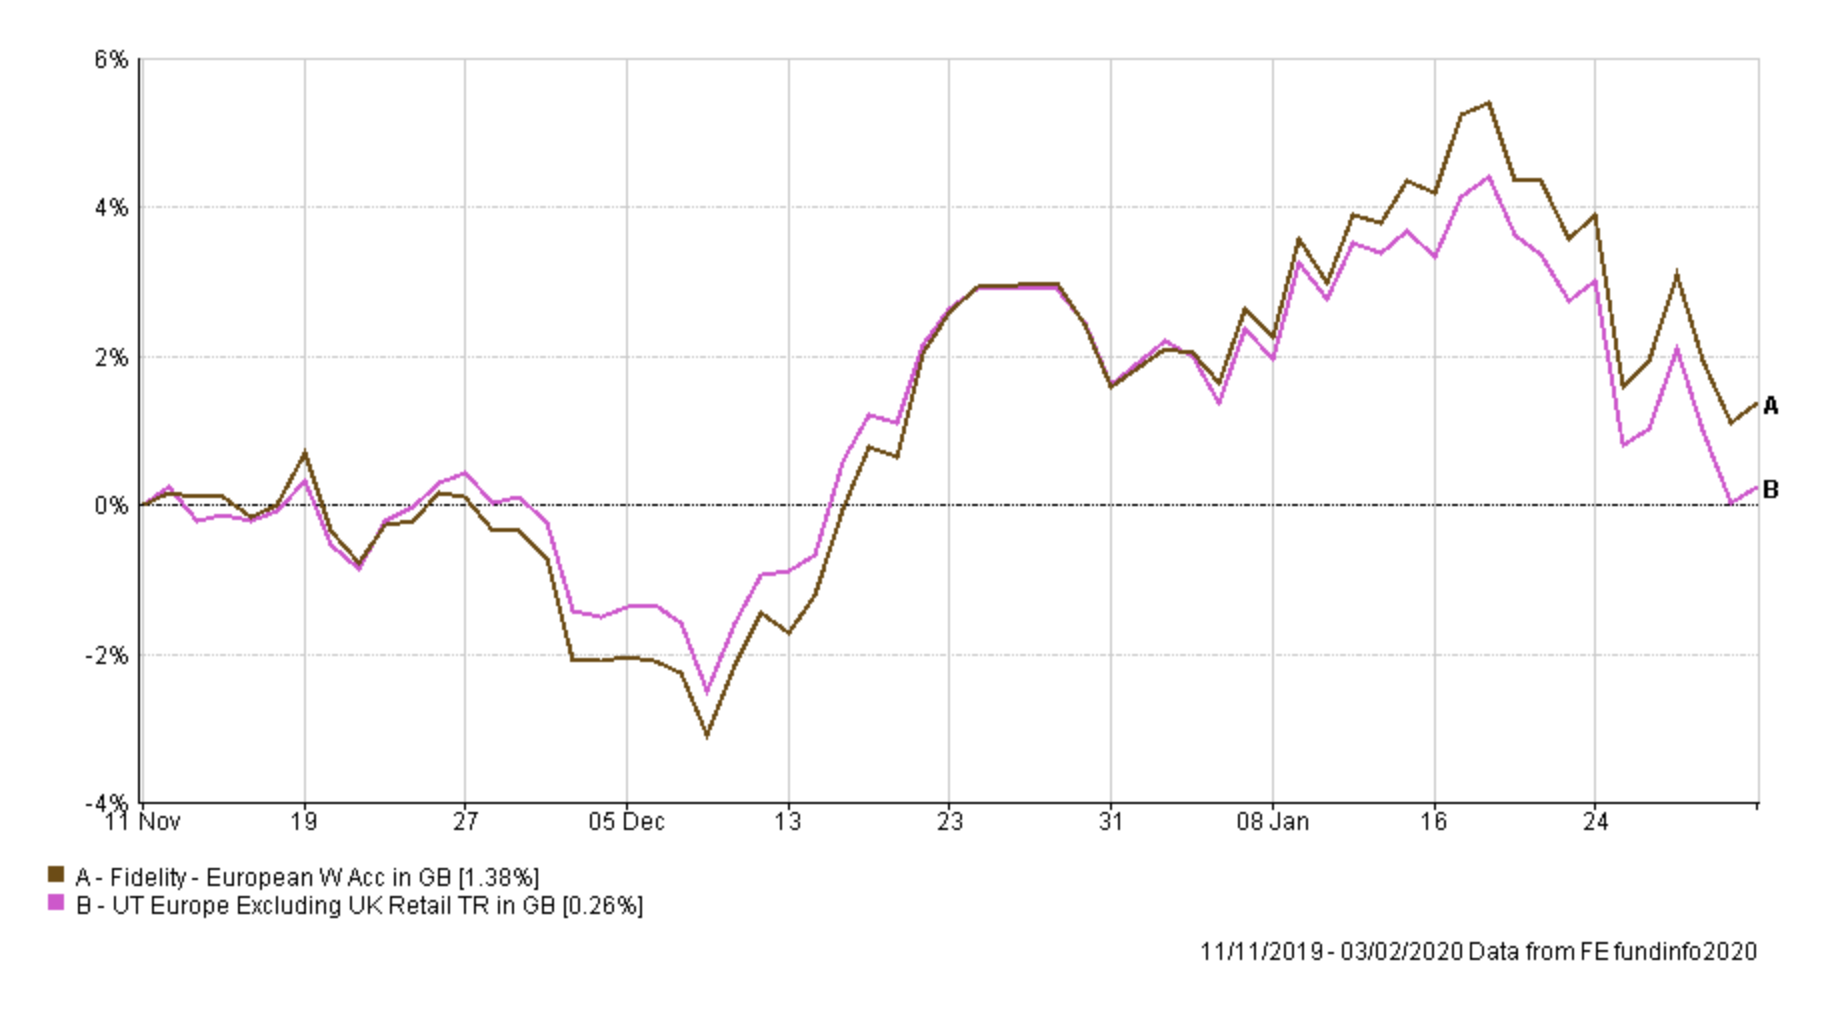
As you can see it has outperformed its peer group by around 1%. So for now, at least the fund is performing adequately, if not setting the world alight. I spent some considerable time looking at the performance against the other European funds highlighted by 80-20 Investor right now.
The Liontrust European Enhanced Income in the BOTB is the hedged version of the fund. There is also an unhedged version. Below I compare the unhedged version of the Liontrust fund and the hedged fund to that of the Fidelity European fund. You can see that the Fidelity European fund actually outperforms the unhedged version of the fund. Or in other words it is the currency hedging that's added the extra performance to the Liontrust fund that has made this month's BOTB.
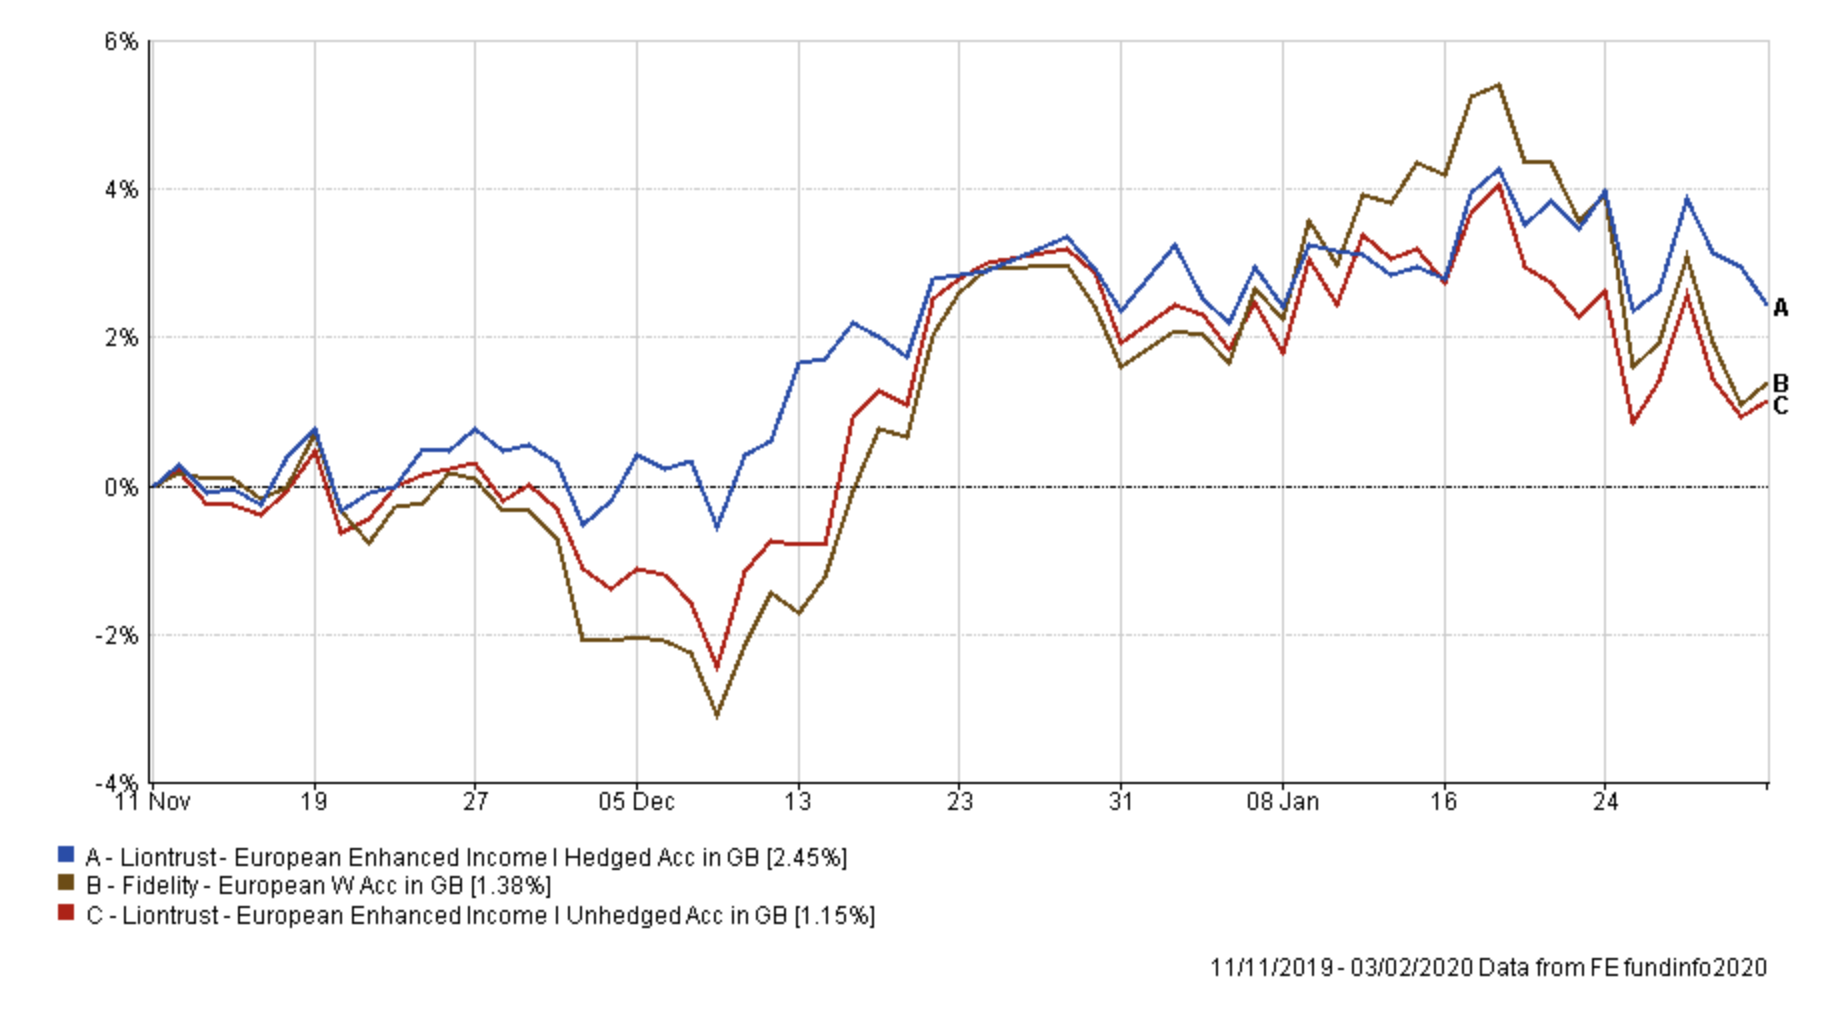
Based on this, and the fact that the Liontrust fund has a small bid/offer spread, something I always try and avoid, I think right now it's not worth switching funds, given that I have previously dramatically decreased my portfolio's currency exposure. I did also look at the other European funds within the BFBS and 4 out of the 5 also have bid/offer spreads which is very unusual. The only one that doesn't is the Barclays Europe (ex-UK) Alpha, but it's max weekly fall figure points to far more volatility, which is something I'm loathed to commit to in the current environment. So, for now, I will keep the Fidelity European fund on my watchlist but reduce my position size to bring my portfolio's European equity exposure back more in line with that of the BOTB.
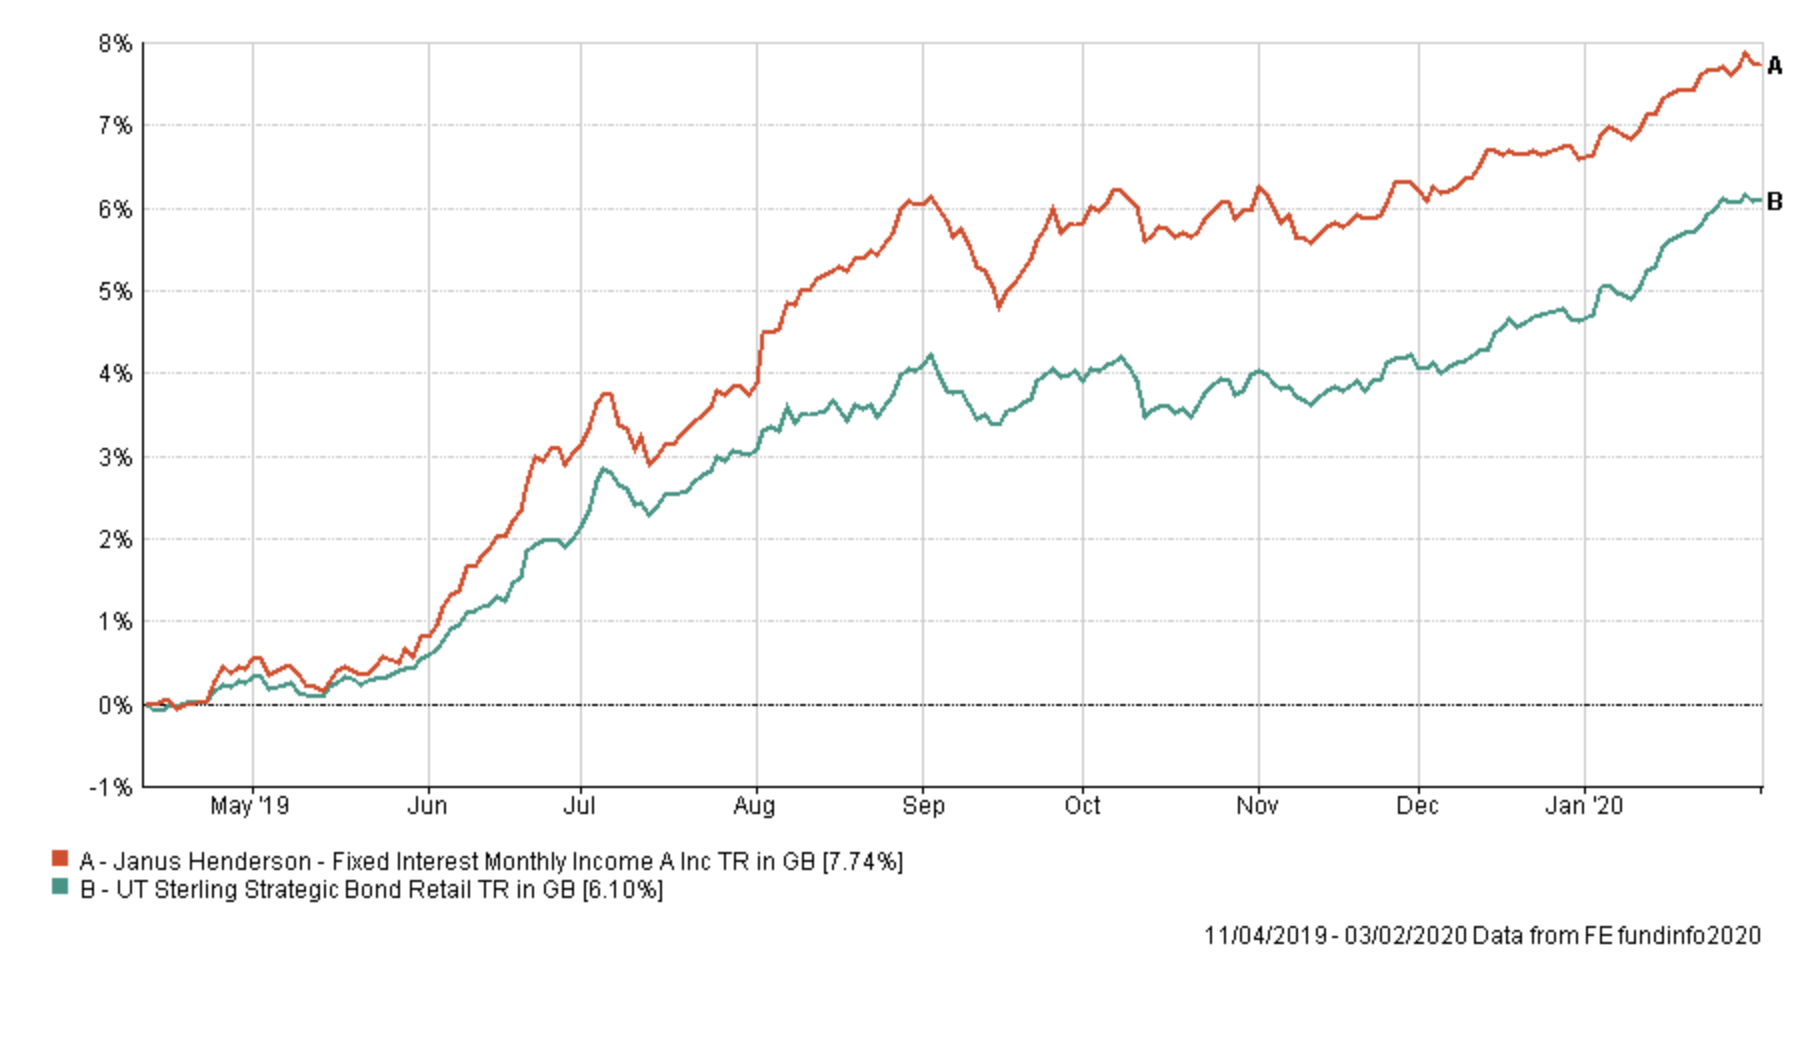
The Janus Henderson Fixed Interest Monthly Income fund (also coloured red in the above table) has finally dropped out of the 80-20 Investor tables. However, it has only just slipped out of contention and as the chart below shows the fund has been a strong performer since I first bought it in April 2019. There's certainly no need to panic, especially in a choppy environment as we have now. I plan to remain invested in it for now but keep it on my watchlist.
So looking at the rest of my portfolio there is no need to make any drastic changes especially given how well my portfolio has performed in the current environment, which has caught a lot of fund managers off their guard. The narrative of FOMO quickly changed to all out fear and continues to flip back and forth.
Looking at my portfolio in its entirety the asset mix broadly reflects that of the new BOTB. The only key difference is that:
- my portfolio now has a marginally higher equity component
- my portfolio has exposure to emerging market bonds (and no gilt exposure)
- my portfolio has exposure to Japanese equities (unlike the BOTB) as well as a higher European equity exposure.
As you can see from the earlier table the emerging market debt fund I hold continues to perform well and helps diversify the low-risk portion of my portfolio. I recently reduced my exposure to this fund and for now I will leave things as they are.
So being mindful of the BOTB's asset mix (but not obsessed over it) I plan to drip out of my Japanese equity exposure and European equity exposure in favour of UK equities and a slightly increased bond allocation. This helps bring my asset mix more in line with that of the BOTB.
Below I have broken down each fund switch in detail with my reasonings.
Fund switches
Fund switch 1
33.3% switch out of the Jupiter Japan Income and 100% into Liontrust Sustainable Future Corporate Bond
This switch allows me to reduce Japanese equity exposure in favour of increasing my bond exposure. I have favoured the Liontrust over my other bond holdings because a) it has a lower allocation in my portfolio and b) it has performed strongly recently
Fund Switch 2
33.3% out of Fidelity European fund and 100% into ASI UK Real Estate Share
This is a simple case of reducing my European equity exposure (and exposure to a fund that has been out of the 80-20 Investor tables for a little while). Rather than overexpose my portfolio to the fortunes of one UK equity fund (in my case Slater Growth) I have decided to put the proceeds into the ASI UK Real Estate Share. This boosts the UK equity exposure of my portfolio, although in the asset mix below it is included under Property.
My portfolio
The fund switches only affect about 5% of my portfolio so now my portfolio looks like this:
| Name | Allocation % (rounded) | Risk | Sector | ISIN Code |
| ASI Emerging Markets Bond | 5 | Low | Global Emerging Markets Bond | GB00B5L9HN22 |
| ASI Global Real Estate Share | 3.5 | High | Property Other | GB00B7MR5W47 |
| BNY Mellon Real Return | 11 | Low | Targeted Absolute Return | GB0001642635 |
| Fidelity European | 5 | Medium | Europe Excluding UK | GB00BFRT3504 |
| Janus Henderson Fixed Interest Monthly Income | 16 | Low | Sterling Strategic Bond | GB0001920486 |
| Jupiter Japan Income | 6 | Medium | Japan | GB00B0HZTZ55 |
| M&G Global Listed Infrastructure | 7 | Medium | Global | GB00BF00R928 |
| Slater Growth | 10 | Medium | UK All Companies | GB00B0706C66 |
| VT Gravis Clean Energy Income | 14 | Medium | Global | GB00BFN4H792 |
| ASI UK Real Estate Share | 5.5 | High | Property Other | GB00B0XWNN66 |
| Liontrust Sustainable Future Corporate Bond | 8 | Low | Sterling Corporate Bond | GB0030029069 |
| Premier Diversified Growth | 9 | Medium | Mixed Investment 40-85% Shares | GB00B8BJV423 |
My Portfolio asset mix
My portfolio asset mix is shown below (the previous asset mix is in brackets) with approximately 57% invested in equities:
-
- UK Equities 17% (17%)
- North American Equities 11% (11%)
- Global Fixed Interest 17% (17%)
- Japanese Equities 6% (9%)
- European Equities 9% (11%)
- UK Fixed Interest 6% (4%)
- Cash 4% (2%)
- Alternative Investment Strategies 12% (13%) (including absolute return)
- Emerging Market Fixed Interest 4% (4%)
- Commodities and energy 5% (5%)
- Property 9% - 5.5% of which is in UK equities (7%)
Damien's higher risk and low risk portfolios
Using the logic described in my post: Update to Damien’s alternative risk portfolios I create hypothetical higher and lower risk versions of my portfolio below:
Higher risk
| Fund | Allocation % |
| ASI Global Real Estate Share | 5.8 |
| Fidelity European | 8.3 |
| Jupiter Japan Income | 10 |
| M&G Global Listed Infrastructure | 11.7 |
| Slater Growth | 16.7 |
| VT Gravis Clean Energy Income | 23.3 |
| ASI UK Real Estate Share | 9.2 |
| Premier Diversified Growth | 15 |
Lower risk
| Fund | Allocation % |
| ASI Emerging Markets Bond | 5.5 |
| BNY Mellon Real Return | 12.1 |
| Fidelity European | 5.5 |
| Janus Henderson Fixed Interest Monthly Income | 17.6 |
| Jupiter Japan Income | 6.6 |
| M&G Global Listed Infrastructure | 7.7 |
| Slater Growth | 11.0 |
| VT Gravis Clean Energy Income | 15.4 |
| Liontrust Sustainable Future Corporate Bond | 8.8 |
| Premier Diversified Growth | 9.8 |

£200 Pension Cashback Offer
Make a qualifying deposit or transfer a pension to our partner Interactive Investor.
- Deposit or transfer a pension of at least £20k and you could earn £200 cashback
- Terms and Fees apply, Capital at risk
- New & Existing customers opening a SIPP
- Offer ends 31st July 2026
Before starting your transfer, check you won't lose any valuable benefits (such as guaranteed annuity rates or a lower protected pension age) and find out what exit fees you might have to pay
