

The background to my portfolio
Back in March 2015 I decided to invest £50,000 of my own money using 80-20 Investor. The purpose was twofold, firstly to show how you can use 80-20 Investor to invest and outperform the market with only a few minutes effort every now and then. Secondly, no other investment commentator, journalist or research provider invests their own money for fear of failing. This is a sorry state of affairs and is precisely why I committed to openly running my own portfolio for 80-20 Investor members to see.
Since then I have periodically changed my portfolio using the fund suggestions provided by the 80-20 Investor algorithm and associated research. I always disclose the changes at the time they are made.
Performance update
As is usual in my portfolio reviews, the chart below shows how my portfolio has outperformed since I started the challenge in March 2015, four and a half years ago. The green line is the performance of my portfolio while the red line is the benchmark showing the average return achieved by professional fund managers given the same asset mix. To accurately calculate this I have used the average return for each sector in which my portfolio invested. The blue line shows what the average multi-asset fund with comparable equity content achieved. In other words, the red line would show the extra performance added by just the asset mix of my portfolio (where I was invested i.e European equities etc) over picking a typical multi-asset fund (the blue line). While the green line (which is my actual performance) shows the impact of being in the right funds at the right time, as identified by the 80-20 Investor algorithm.
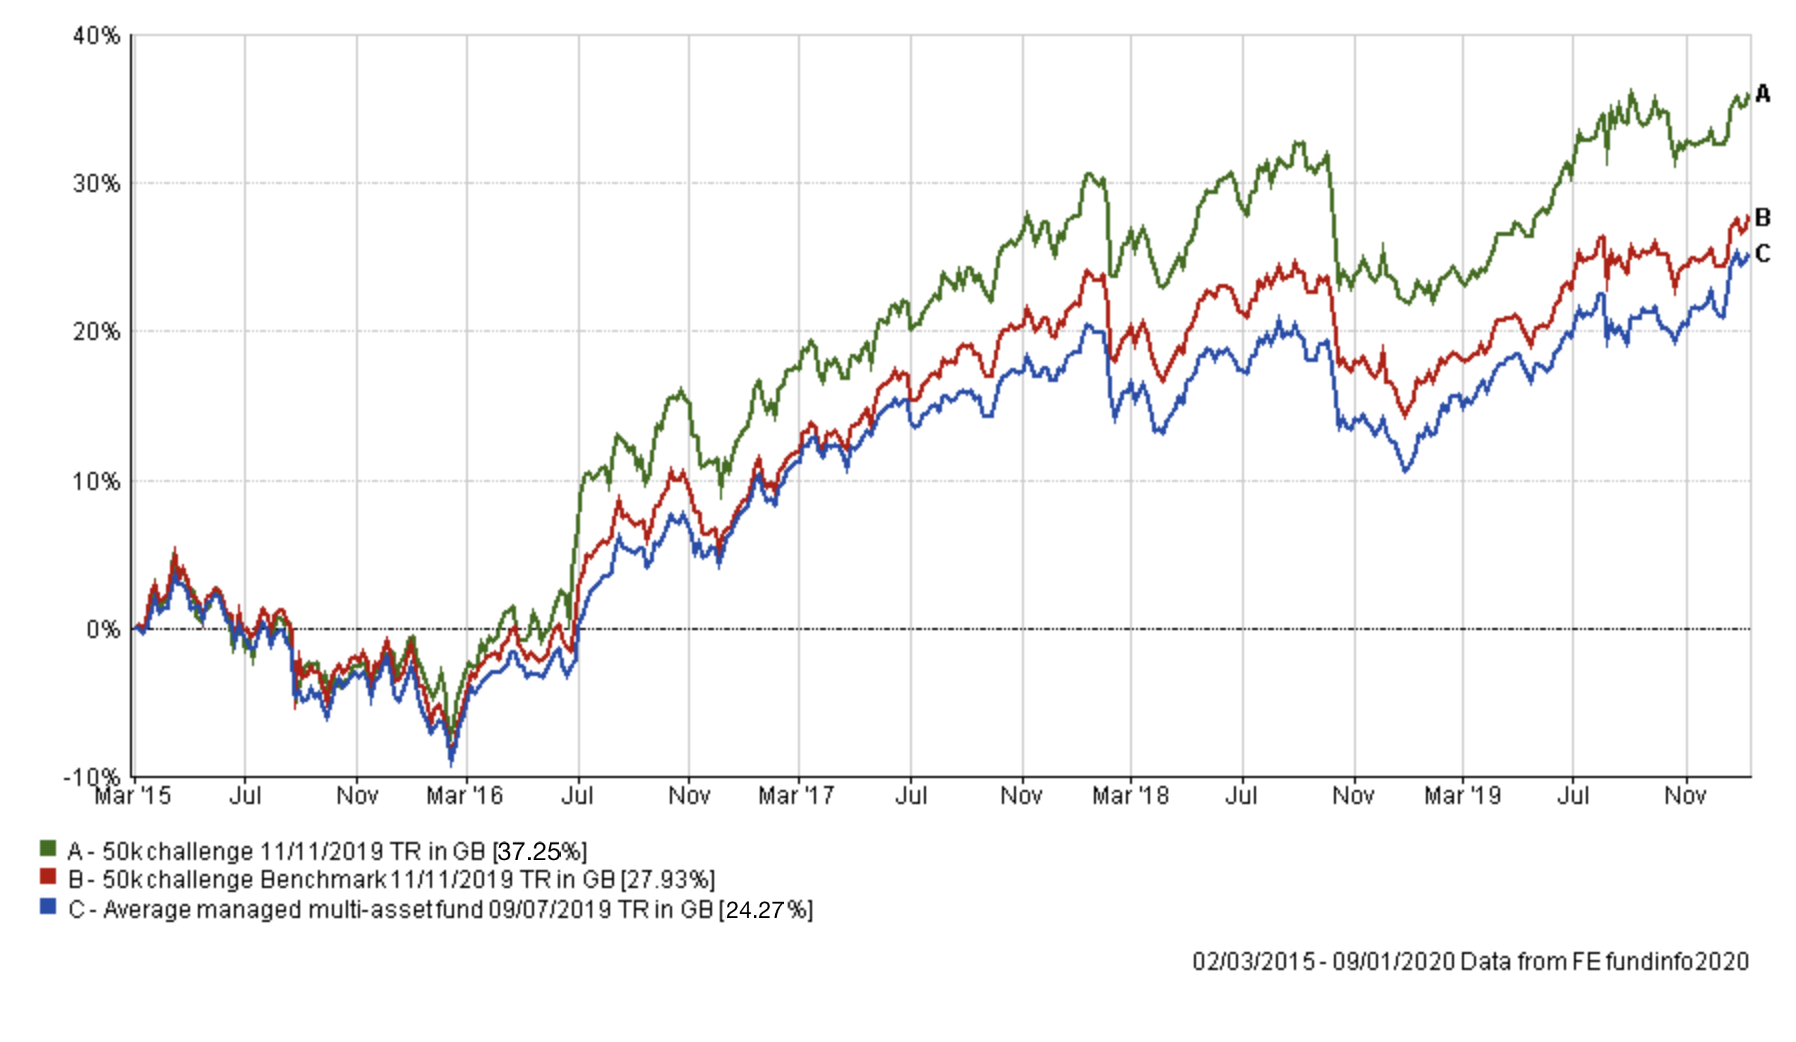
I refrained from making any changes to my portfolio during December when markets were very volatile. It turned out to be a wise choice, with the benefit of hindsight, as the Santa rally soon got underway propelling my portfolio to a new all-time high in terms of profit.
The chart below shows the performance of my portfolio since I last made changes in November and you can see that my portfolio captured nearly all of the upside and less of the downside compared to its benchmarks.
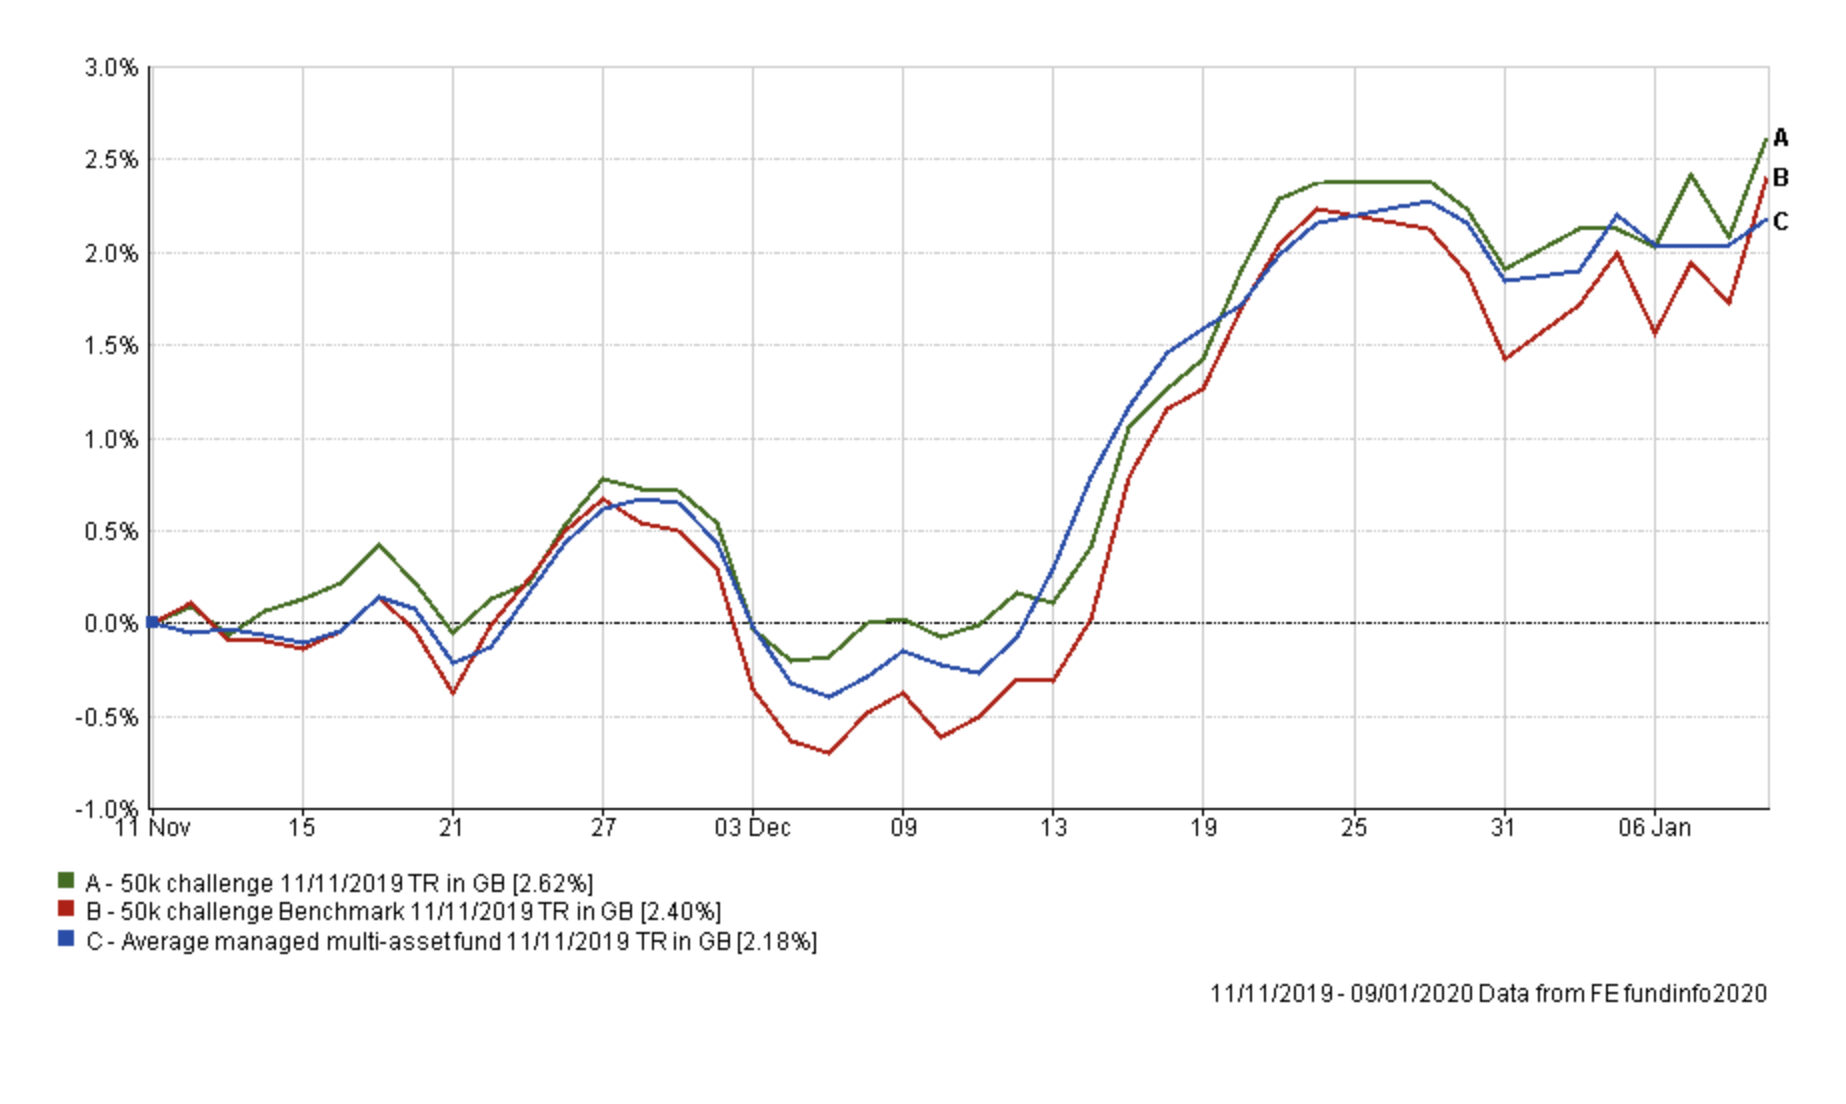
It is good to see that by avoiding FOMO (fear of missing out) knee-jerk reactions after the UK election my portfolio still rode the rally into the year-end and sits at an all-time high. However, it is now time to make a few changes to the portfolio.
The table below shows which funds within my portfolio are in the current BOTB or BFBS tables and which are not. Those funds in green are still in the BOTB while those in yellow are not in the BOTB but remain in the BFBS list. Meanwhile, any funds in red have dropped out of both shortlists.
| Fund | Allocation % | Risk | Sector | ISIN Code |
| Fidelity Global Enhanced Income | 5 | Medium | Global Equity Income | GB00BD1NLJ41 |
| M&G Global Listed Infrastructure | 7 | Medium | Global | GB00BF00R928 |
| Janus Henderson Fixed Interest Monthly Income | 16 | Low | Sterling Strategic Bond | GB0001920486 |
| BNY Mellon Real Return | 11 | Low | Targeted Absolute Return | GB0001642635 |
| ASI Emerging Markets Bond | 10 | Low | Global Emerging Markets Bond | GB00B5L9HN22 |
| Vanguard LifeStrategy 20% Equity | 6 | Low | Mixed Investment 0-35% Shares | GB00B4NXY349 |
| Jupiter Japan Income | 9 | High | Japan | GB00B0HZTZ55 |
| VT Gravis Clean Energy Income | 11 | Medium | Global | GB00BFN4H792 |
| TB Evenlode Global Income | 6 | High | Global Equity Income | GB00BF1QMV61 |
| ASI Global Real Estate Share | 7 | High | Property Other | GB00B7MR5W47 |
| Fidelity European | 7 | Medium | Europe Excluding UK | GB00BFRT3504 |
| Slater Growth | 5 | Medium | UK All Companies | GB00B0706C66 |
Five funds have now fallen out of the BOTB and BFBS tables altogether reflecting the shift in momentum trends. A turnaround in fortunes for UK assets and fluctuations in the value of the pound have had a marked impact.
Of the 5 funds in red, Fidelity European and M&G Global Listed Infrastructure were both in the BOTB when I last made changes to my portfolio in November. In addition, as the chart below shows they have both outperformed their peer group averages since my November update and enjoyed particularly strong Decembers.
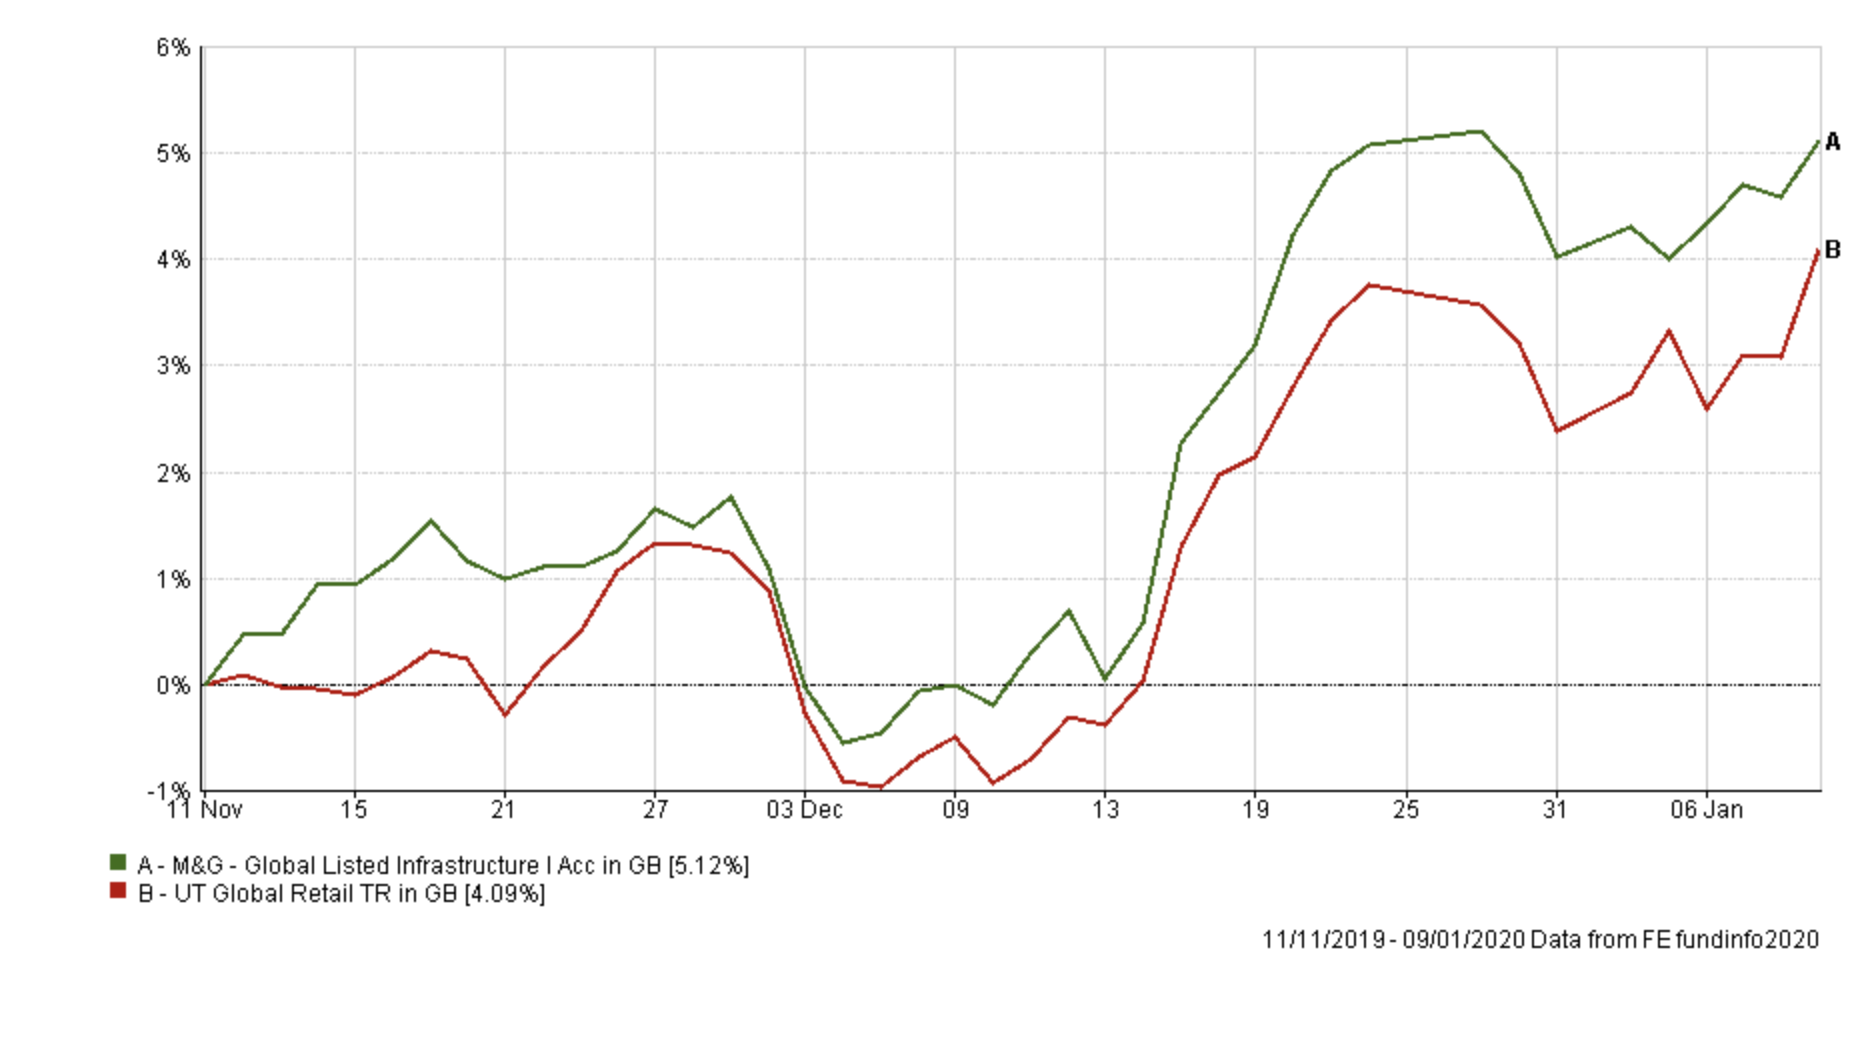
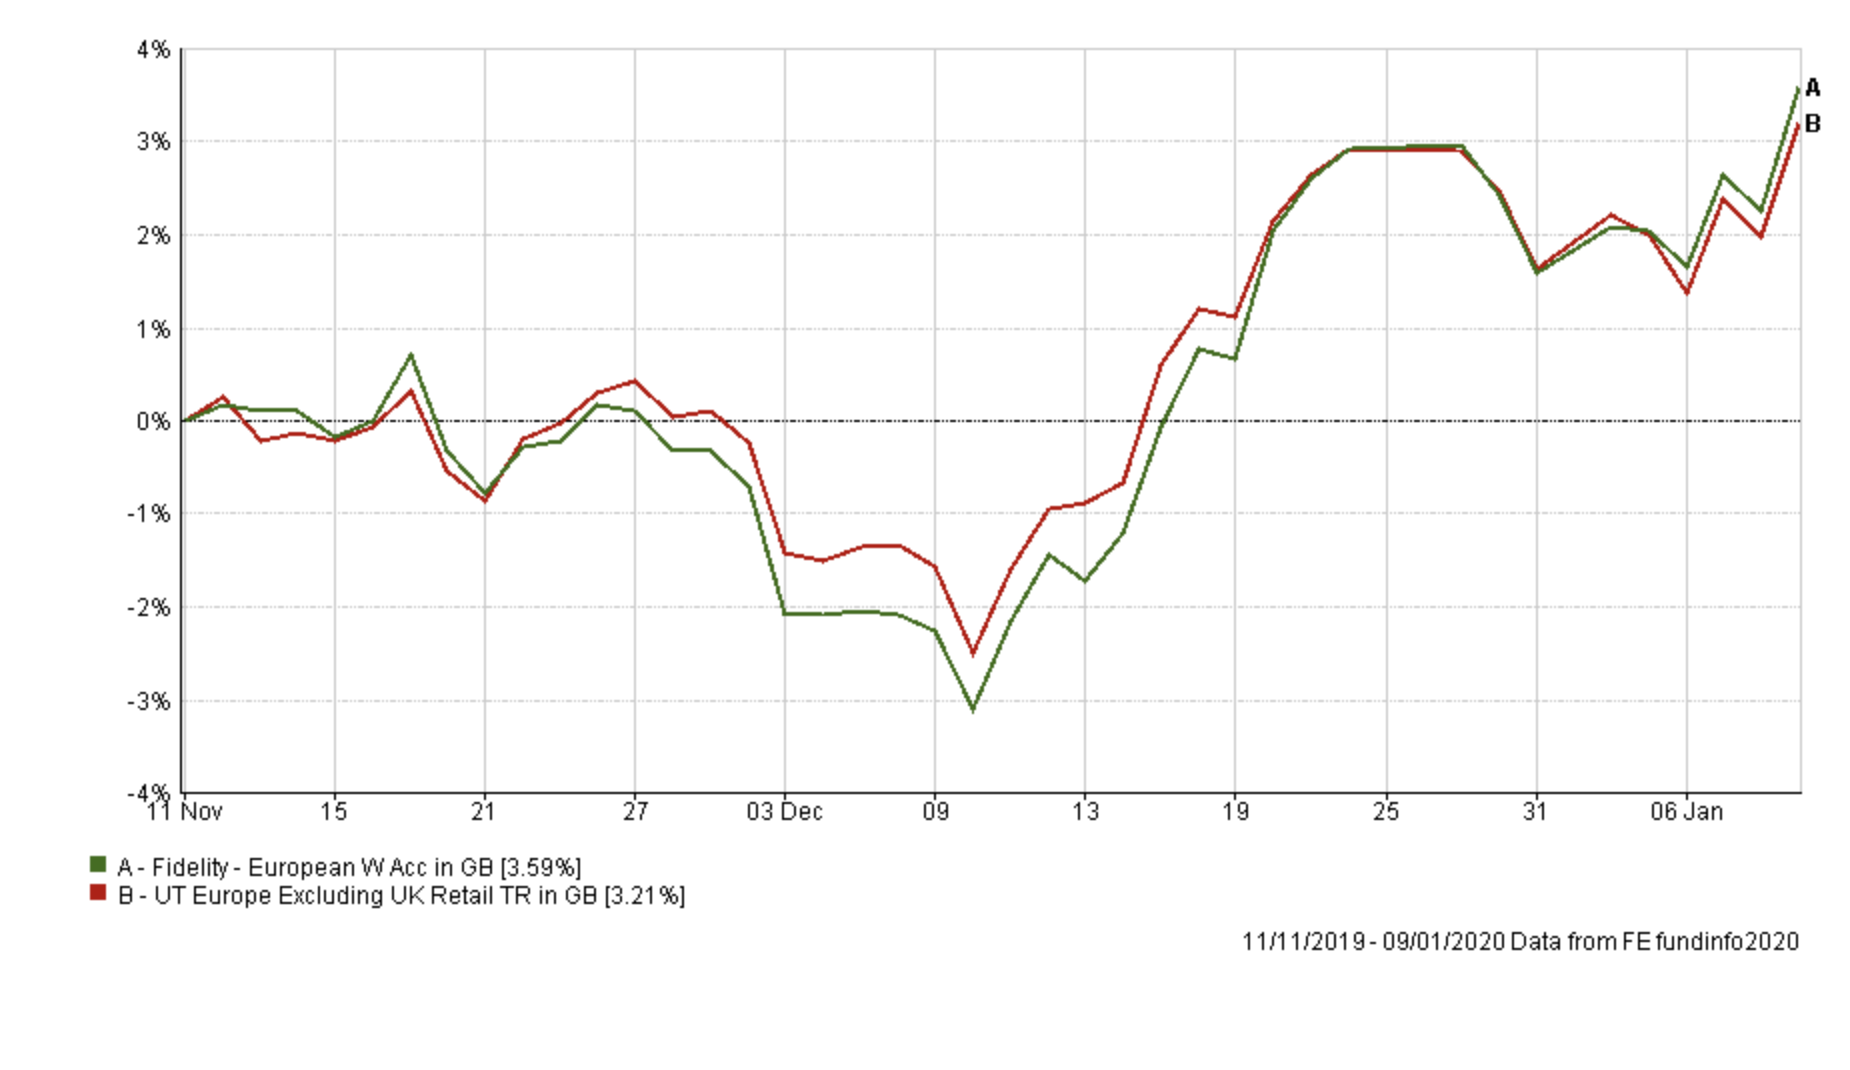
As such I will put these both on my watchlist and review their inclusion next time.
The other three funds in red have not been in the BOTB for at least three months and so I think it is time to freshen things up.
Given the performance of my portfolio there is no need to be too radical. However, if I compare the asset mix of my portfolio as it currently stands against that of the new BOTB the key differences include:
- I have more exposure to US equities
- I have more exposure to Japanese equities
- I have significantly less exposure to UK equities
- I have no exposure to UK fixed interest
- I have more exposure to emerging market debt
I have tried to address all of these differences via a number of fund switches. My aim was to reduce my unhedged US equity exposure while increasing my UK equity exposure. I also wanted to reduce my emerging market debt exposure in favour of UK fixed interest. However, I do maintain some exposure to emerging market debt. This is because it is still one of the best performing low-risk parts of my portfolio in recent months.
Below I have broken down each fund switch in detail with my reasonings.
Fund switches
Fund switch 1
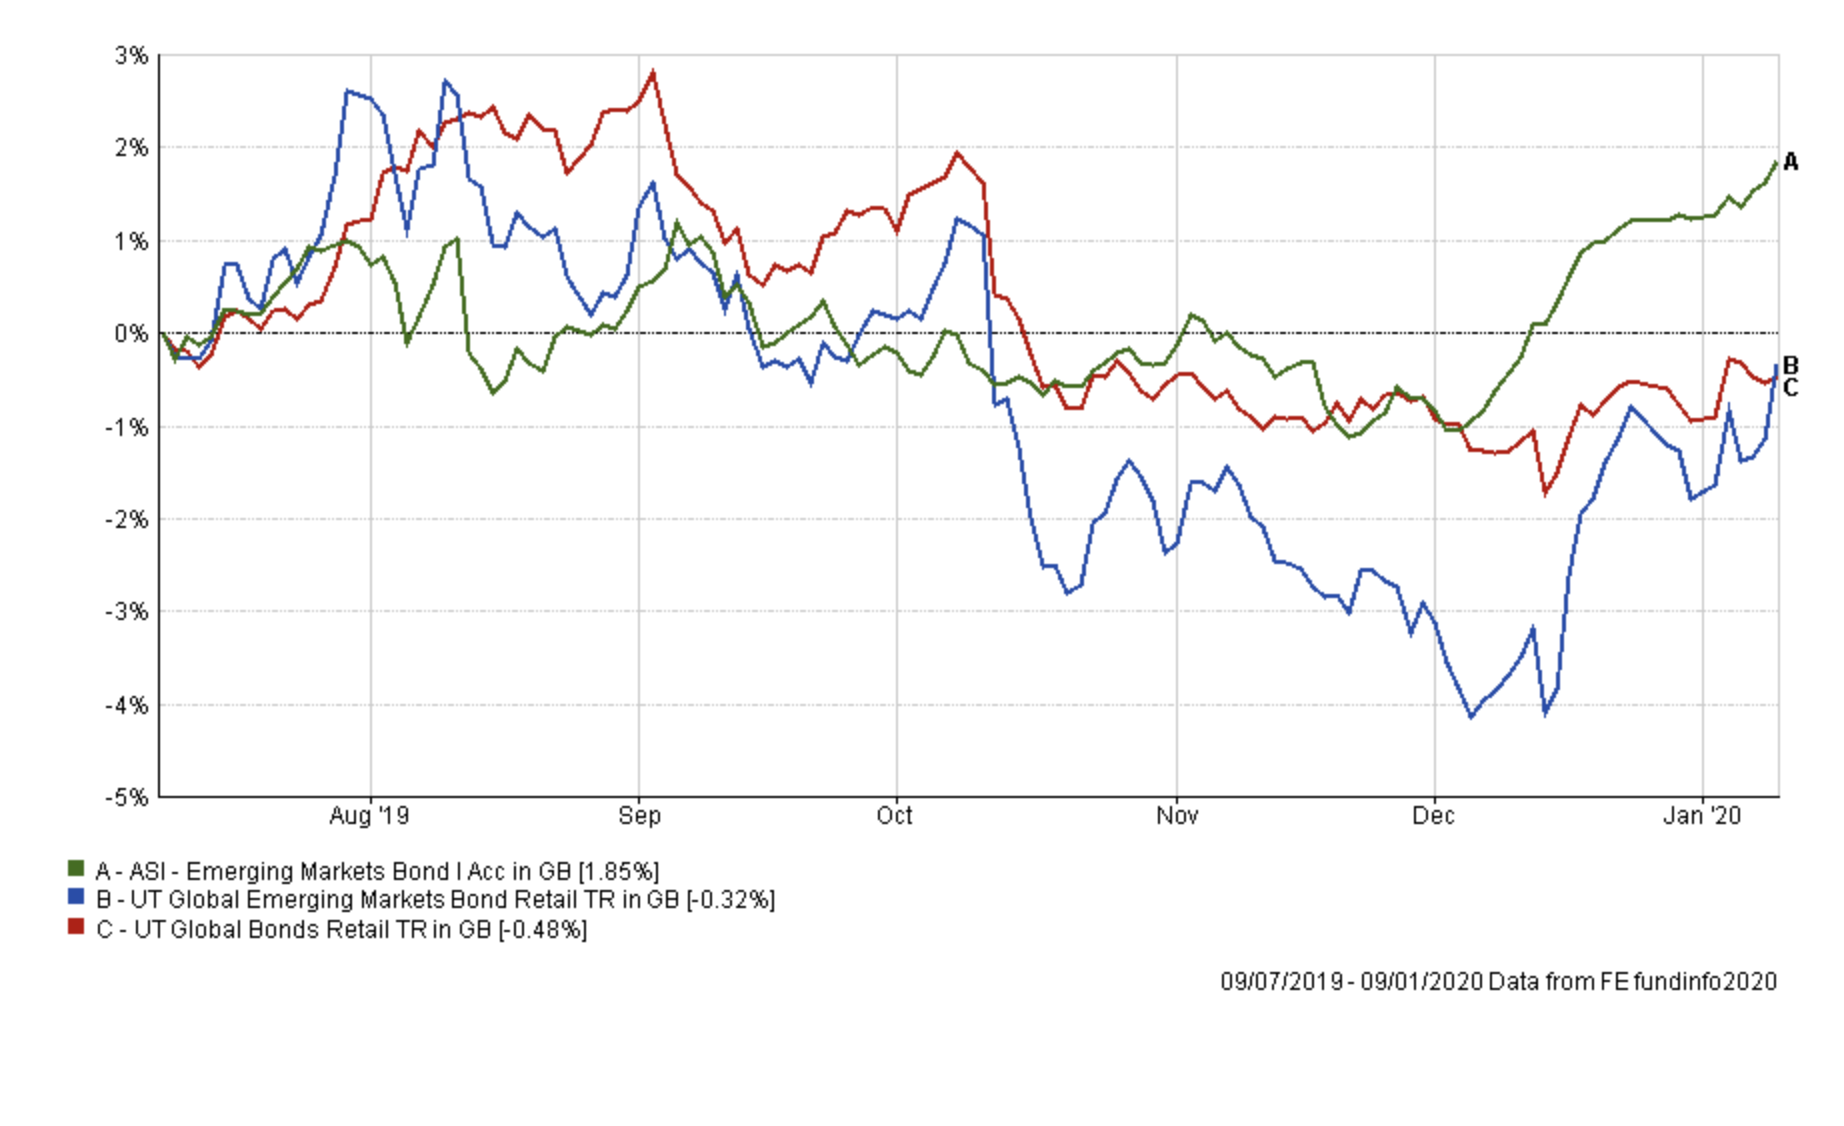
50% switch out of the ASI Emerging Markets Bond fund and 100% into Liontrust Sustainable Future Corporate Bond
The chart below highlights just how well the ASI bond has fared versus global bond funds and its own peer group over the last six months. Although, not exciting it has preserved capital very well, riding the recent wave of a falling dollar. However, it makes up a significant portion of my portfolio so I am looking to reduce the level of exposure. I am investing the proceeds into the Liontrust Sustainable Future Corporate Bond fund as it has been a regular in the BOTB. For comparison, the Liontrust fund is up more than 3.5% over the last six months
Fund switch 2
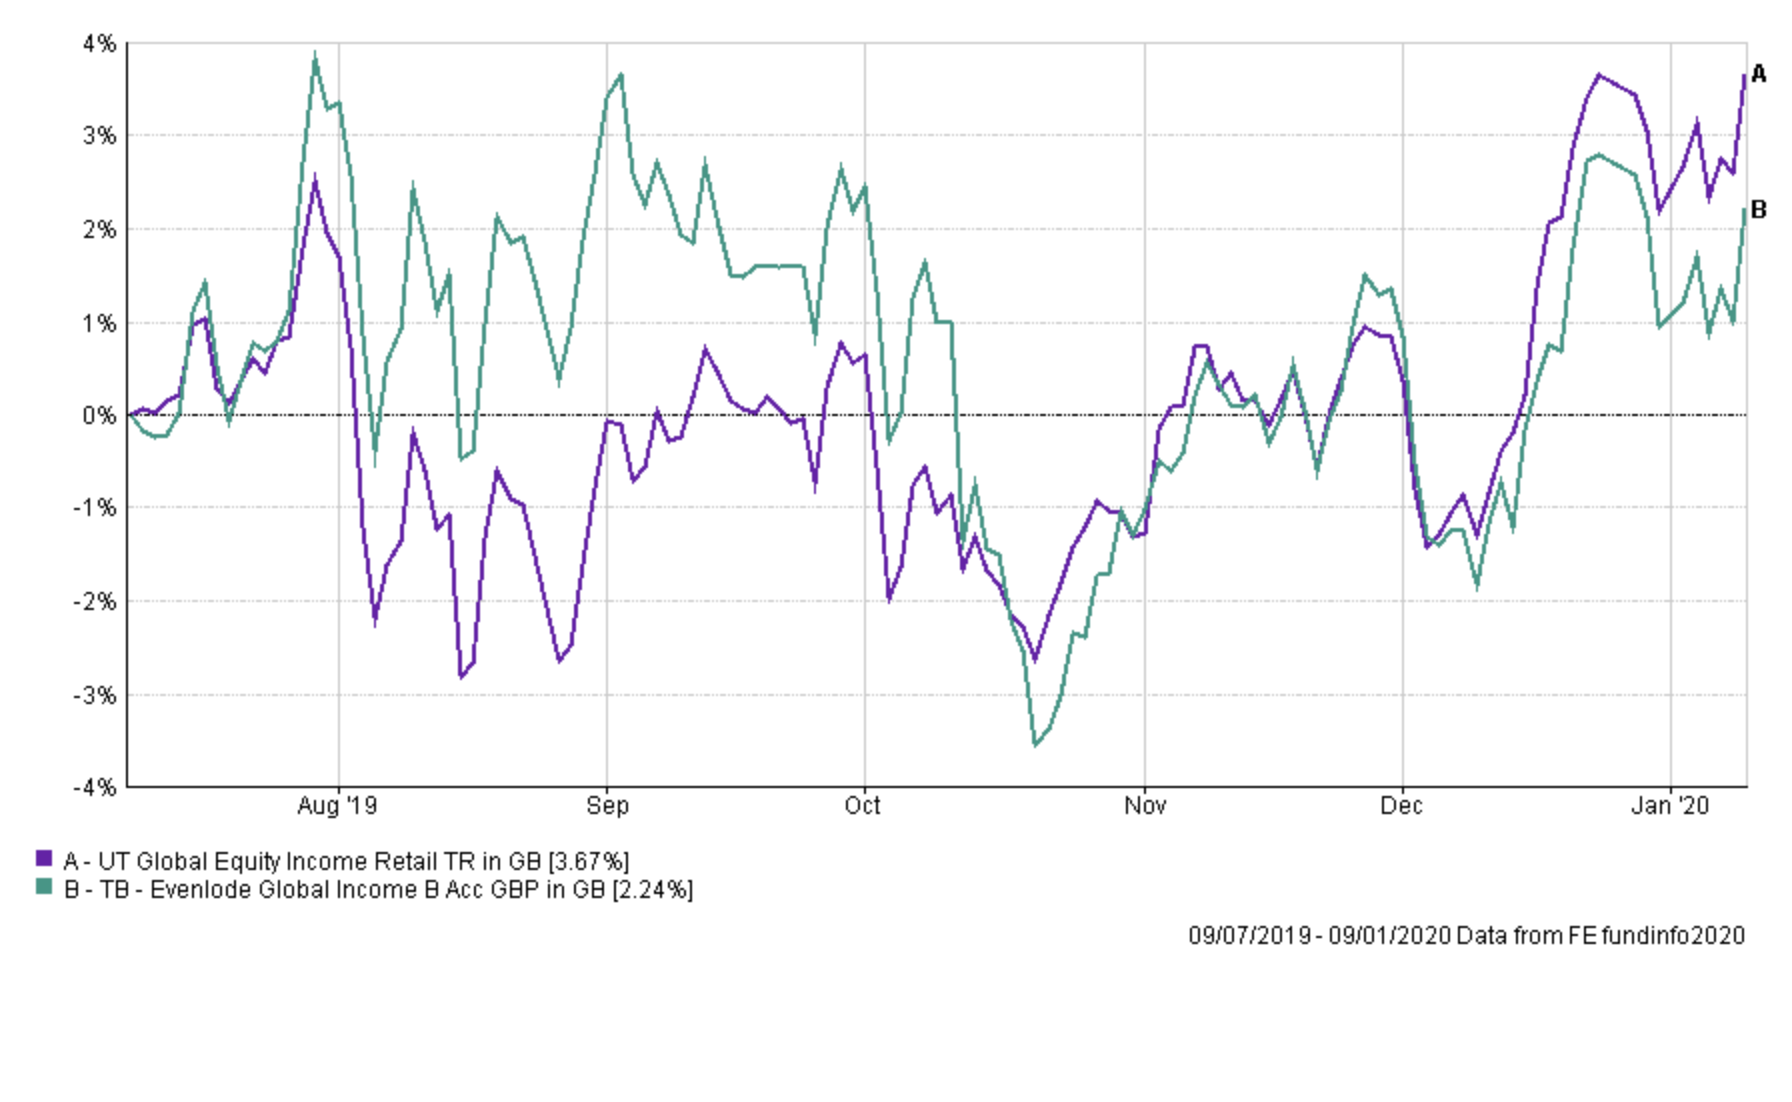
100% out of TB Evenlode Global Income and 100% into Premier Diversified Growth
(see comments below)
Fund Switch 3
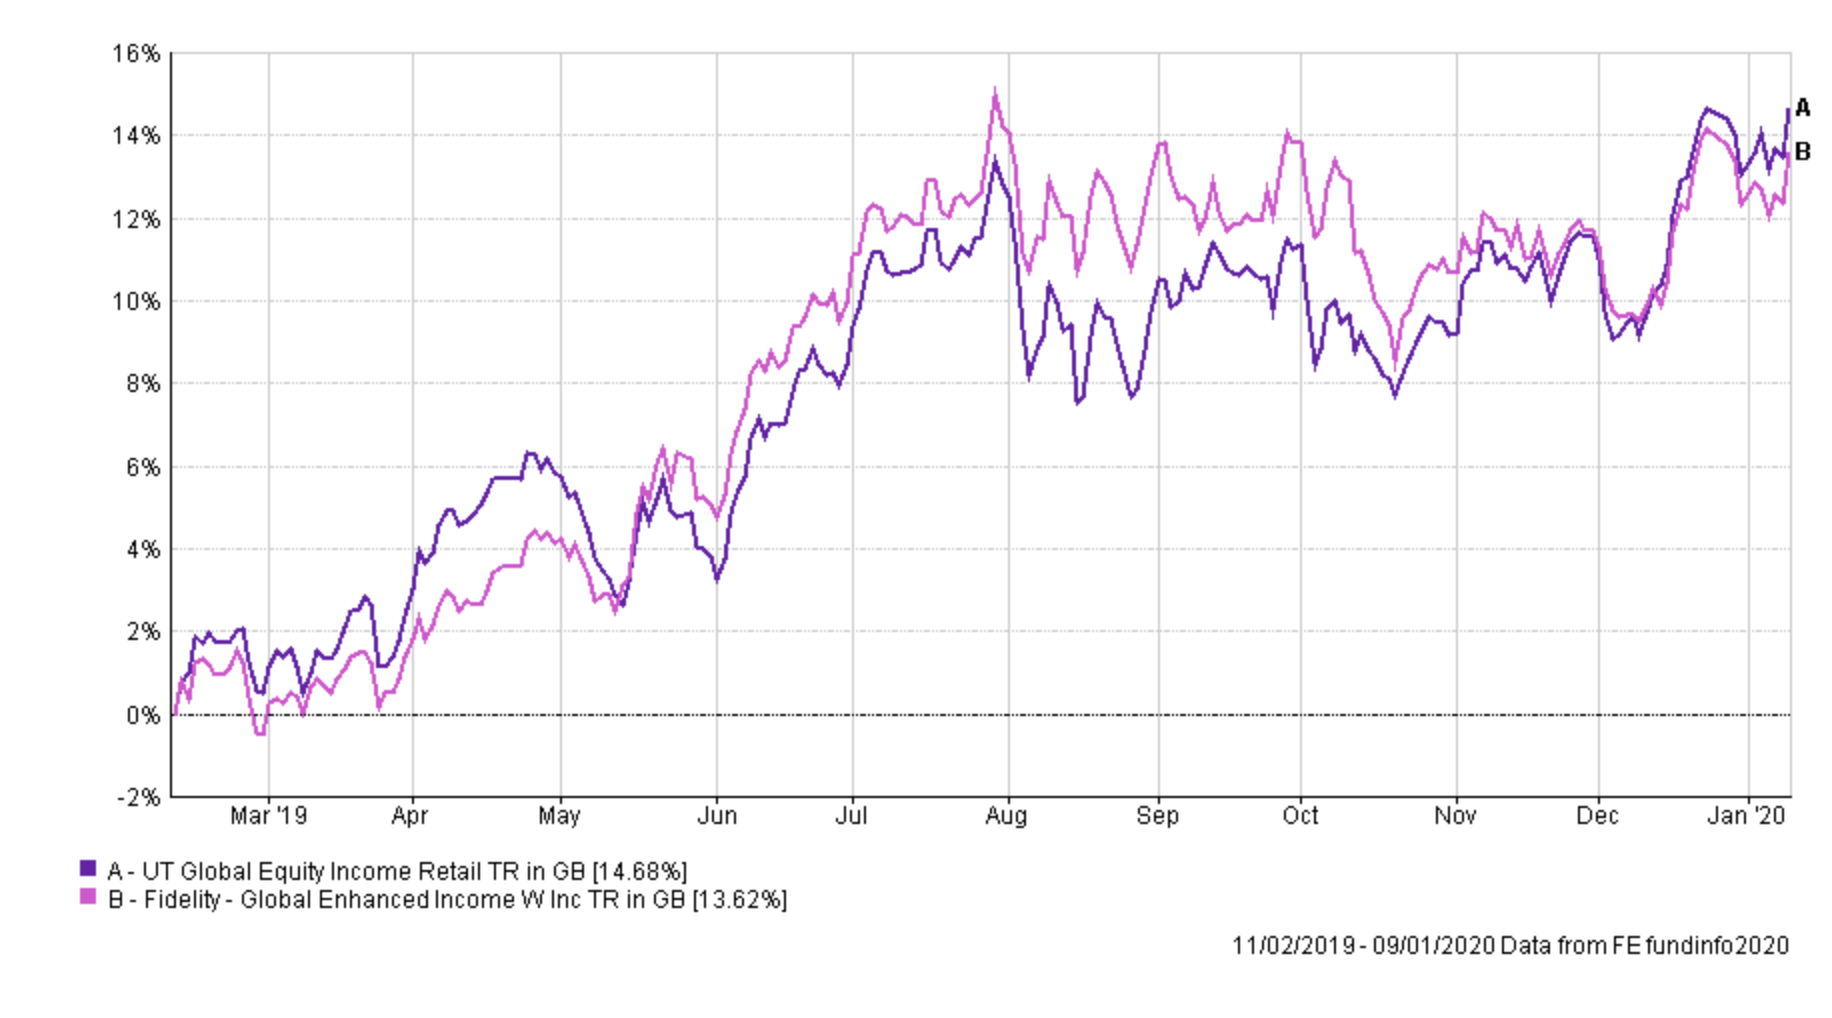
100% out of Fidelity Global Enhanced Income and 100% into Slater Growth
Both fund switch 2 and 3 aim to reduce the US exposure of my portfolio in favour of UK equities. Global equity funds are often quasi-US equity funds and so replacing them with funds with UK equity exposure is a good way to achieve my asset allocation aim. The charts below also highlight that while the funds produced decent returns since I've held them they are now more or less just tracking their peer group. The switches also help to further reduce the portfolio's exposure to the volatility of the pound. By investing some of the switch proceeds into the Slater Growth I am essentially backing an existing winner. The Premier Diversified fund, on the other hand, is a balanced fund investing in a range of assets. Approximately 60% of assets are invested in equities, just under half of which is invested in UK equities. By investing in the Premier Diversified fund (a medium risk fund) it helps counter the increased investment risk my next switch introduces.
Fund switch 4
100% out of Vanguard LifeStrategy 20% Equity and 50% into VT Gravis Clean Energy Income and 50% into Premier Diversified Growth
This switch is a simple case of using the proceeds to back an existing winner (VT Gravis Clean Energy Income) while at the same time helping to build a position in the Premier Diversified Growth fund.
Fund switch 5
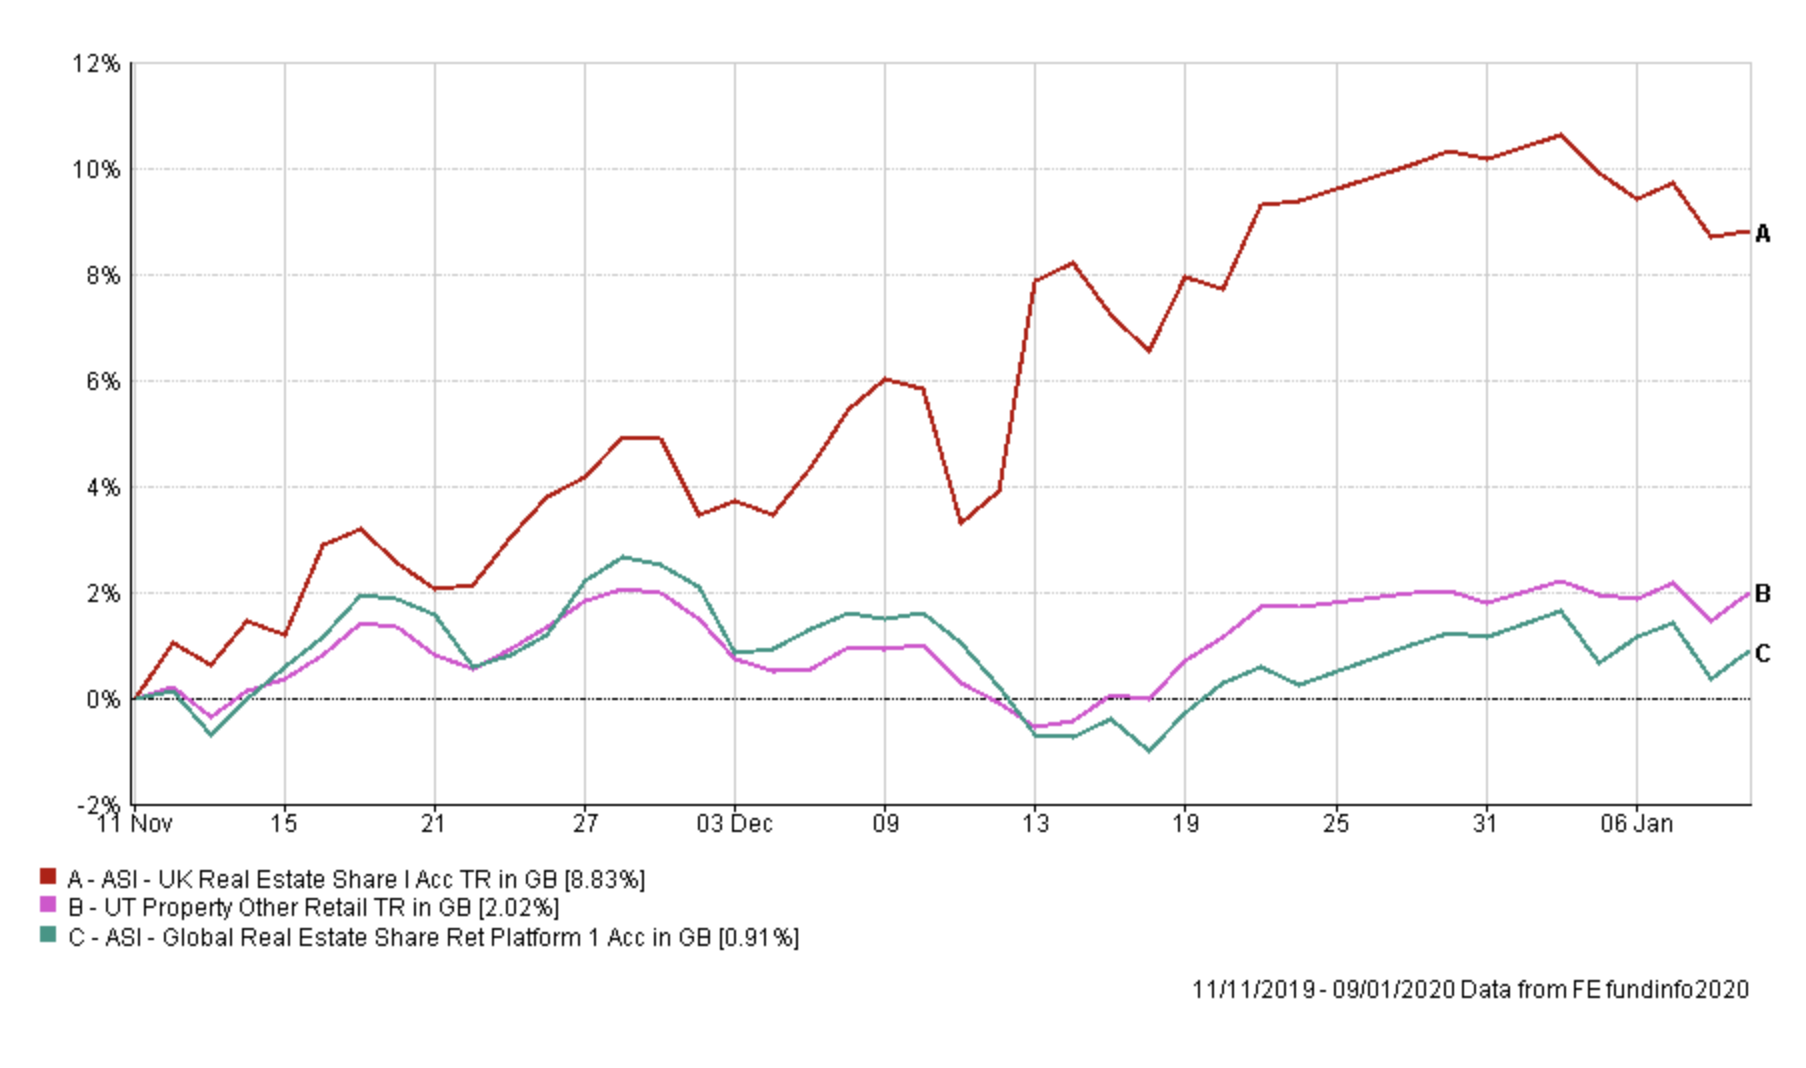
50% out of ASI Global Real Estate Share and 100% into ASI UK Real Estate Share
The chart below highlights the difference in fortunes that the two funds have enjoyed since I've held the ASI Global Real Estate Share fund. While the UK version gained a big boost from the UK election result it has been on an upward trajectory for some months. I have decided to switch part of my ASI Global Real Estate Share exposure to its UK bedfellow. The reason why it was not a wholesale move is that Brexit will still play a huge part in the fortunes of the UK fund and if a no-deal Brexit becomes a possibility the fund's performance will suffer. In the immediate aftermath of the Brexit referendum, the fund fell around 15% before recovering. Its global stablemate didn't suffer such volatility. So, for now, I will keep my exposure to the UK version measured.
My portfolio
My portfolio now looks like this:
| Name | Allocation % (rounded) | Risk | Sector | ISIN Code |
| ASI Emerging Markets Bond | 5 | Low | Global Emerging Markets Bond | GB00B5L9HN22 |
| ASI Global Real Estate Share | 3.5 | High | Property Other | GB00B7MR5W47 |
| BNY Mellon Real Return | 11 | Low | Targeted Absolute Return | GB0001642635 |
| Fidelity European | 7 | Medium | Europe Excluding UK | GB00BFRT3504 |
| Janus Henderson Fixed Interest Monthly Income | 16 | Low | Sterling Strategic Bond | GB0001920486 |
| Jupiter Japan Income | 9 | Medium | Japan | GB00B0HZTZ55 |
| M&G Global Listed Infrastructure | 7 | Medium | Global | GB00BF00R928 |
| Slater Growth | 10 | Medium | UK All Companies | GB00B0706C66 |
| VT Gravis Clean Energy Income | 14 | Medium | Global | GB00BFN4H792 |
| ASI UK Real Estate Share | 3.5 | High | Property Other | GB00B0XWNN66 |
| Liontrust Sustainable Future Corporate Bond | 5 | Low | Sterling Corporate Bond | GB0030029069 |
| Premier Diversified Growth | 9 | Medium | Mixed Investment 40-85% Shares | GB00B8BJV423 |
My Portfolio asset mix
My portfolio asset mix now looks like this (the previous asset mix is in brackets) with approximately 60% invested in equities:
-
- UK Equities 17% (11%)
- North American Equities 11% (13%)
- Global Fixed Interest 17% (19%)
- Japanese Equities 9% (10%)
- European Equities 11% (13%)
- UK Fixed Interest 4% (0%)
- Cash 2% (2%)
- Alternative Investment Strategies 13% (11%) (including absolute return)
- Emerging Market Fixed Interest 4% (9%)
- Commodities and energy 5% (5%)
- Property 7% - half which is in UK equities (7%)
Damien's higher risk and low risk portfolios
Using the logic described in my post: Update to Damien’s alternative risk portfolios I create hypothetical higher and lower risk versions of my portfolio below:
Higher risk
| Fund | Allocation % |
| ASI Global Real Estate Share | 5.6 |
| Fidelity European | 11.1 |
| Jupiter Japan Income | 14.3 |
| M&G Global Listed Infrastructure | 11.1 |
| Slater Growth | 15.9 |
| VT Gravis Clean Energy Income | 22.1 |
| ASI UK Real Estate Share | 5.6 |
| Premier Diversified Growth | 14.3 |
Lower risk
| Fund | Allocation % |
| ASI Emerging Markets Bond | 5.4 |
| BNY Mellon Real Return | 11.8 |
| Fidelity European | 7.4 |
| Janus Henderson Fixed Interest Monthly Income | 17.2 |
| Jupiter Japan Income | 9.7 |
| M&G Global Listed Infrastructure | 7.5 |
| Slater Growth | 10.8 |
| VT Gravis Clean Energy Income | 15.1 |
| Liontrust Sustainable Future Corporate Bond | 5.4 |
| Premier Diversified Growth | 9.7 |

£200 Pension Cashback Offer
Make a qualifying deposit or transfer a pension to our partner Interactive Investor.
- Deposit or transfer a pension of at least £20k and you could earn £200 cashback
- Terms and Fees apply, Capital at risk
- New & Existing customers opening a SIPP
- Offer ends 31st July 2026
Before starting your transfer, check you won't lose any valuable benefits (such as guaranteed annuity rates or a lower protected pension age) and find out what exit fees you might have to pay
