

The background to my portfolio
Back in March 2015 I decided to invest £50,000 of my own money using 80-20 Investor. The purpose was twofold, firstly to show how you can use 80-20 Investor to invest and outperform the market with only a few minutes effort every now and then. Secondly, no other investment commentator, journalist or research provider invests their own money for fear of failing. This is a sorry state of affairs and is precisely why I committed to openly running my own portfolio for 80-20 Investor members to see.
Since then I have periodically changed my portfolio using the fund suggestions provided by the 80-20 Investor algorithm and associated research. I always disclose the changes at the time they are made.
Performance update
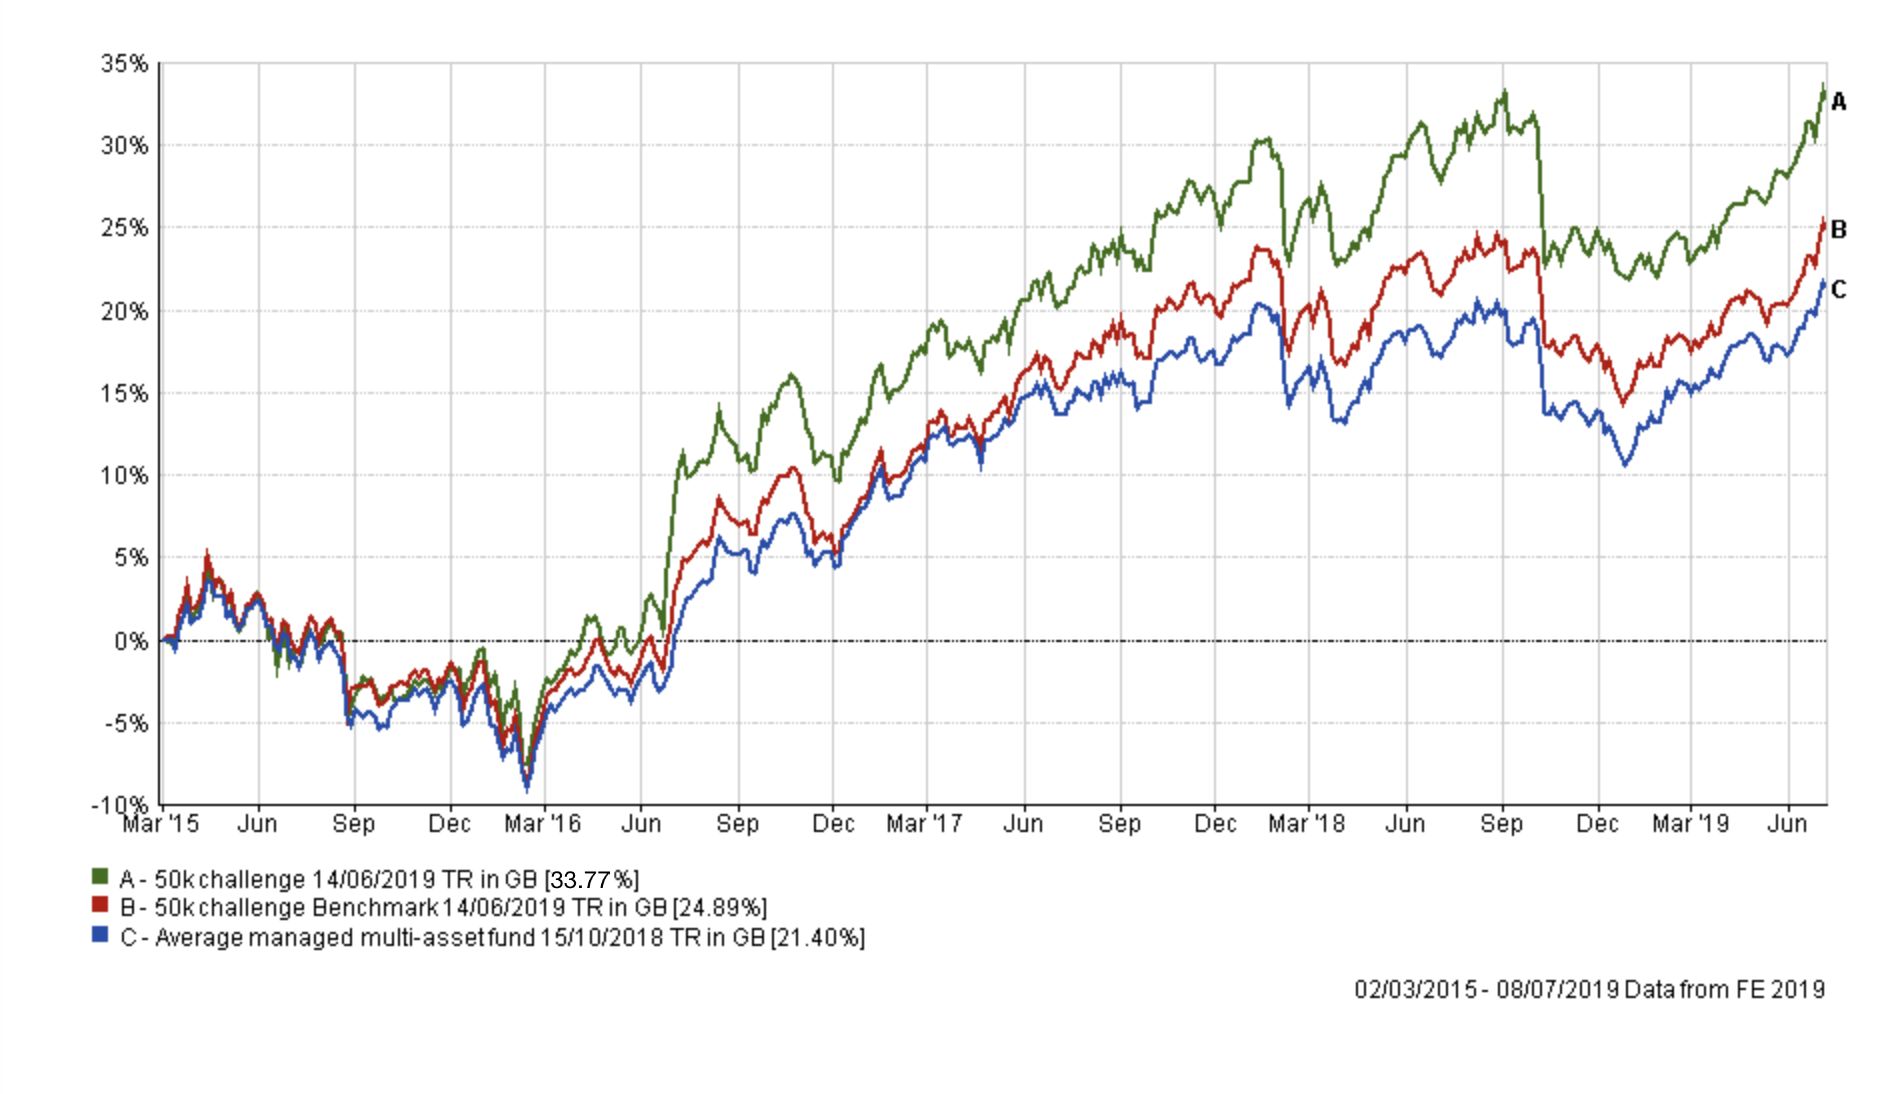
As is usual in my portfolio reviews, the chart below shows how my portfolio has outperformed since I started the challenge in March 2015, four years ago. The green line is the performance of my portfolio while the red line is the benchmark showing the average return achieved by professional fund managers given the same asset mix. To accurately calculate this I have used the average return for each sector in which my portfolio invested. The blue line shows what the average multi-asset fund with comparable equity content achieved. In other words, the red line would show the extra performance added by just the asset mix of my portfolio (where I was invested i.e European equities etc) over picking a typical multi-asset fund (the blue line). While the green line (which is my actual performance) shows the impact of being in the right funds at the right time, as identified by the 80-20 Investor algorithm.
In my portfolio review last month I wrote that...
With equity markets still volatile, the trend is always prone to change. In fact equity markets rallied strongly during the first week of June, driven by the hope that the US Federal Reserve would cut interest rates, but stocks have since taken a pause for breath. If equity markets rally suddenly from here, in an aggressive fashion, then of course my portfolio's more cautious positioning, with only around 43% equity exposure, will temper its performance relative to those funds with large equity exposures. However, as I discussed last time, it's sensible to be aware of the downside risks. So to avoid emotional decisions during turbulent markets I will continue to apply the 80-20 Investor process that has fared well to date.
Well, equity markets did continue to rally throughout June but so did bond markets. That meant that my portfolio's performance wasn't in fact tempered and it certainly held up relative to funds with higher equity exposure. As you can see in the chart above my portfolio's outperformance over its benchmarks was maintained and the portfolio hit a new all-time high in terms of profit. So overall I remain really pleased with how my portfolio has performed in recent months.
As ever, the table below shows my portfolio's current allocation, with those funds in green still in the BOTB while those in yellow are not in the BOTB but remain in the BFBS list. Meanwhile, any funds in red have dropped out of both shortlists.
| Fund | Allocation % | Risk | Sector | ISIN Code |
| BlackRock European Absolute Alpha | 10 | Low | Targeted Absolute Return | GB00B4Y62W78 |
| BMO Pacific Equity | 3 | High | Asia Pacific Excluding Japan | GB0033143115 |
| Fidelity Global Enhanced Income | 5 | Medium | Global Equity Income | GB00BD1NLJ41 |
| Fidelity Global Property | 12 | High | Property Other | GB00B7K2NZ09 |
| JPM Emerging Markets Income | 6 | High | Global Emerging Markets | GB00B56DF680 |
| VT Seneca Diversified Income | 10 | Medium | Mixed Investment 20-60% Shares | GB00B7JTF560 |
| M&G Global Listed Infrastructure | 13 | Medium | Global | GB00BF00R928 |
| HSBC UK Gilt Index | 9 | Low | UK Gilts | GB00B4581C50 |
| Janus Henderson Fixed Interest Monthly Income | 10 | Low | Sterling Strategic Bond | GB0001920486 |
| BNY Mellon Real Return (formerly Newton Real Return) | 9 | Low | Targeted Absolute Return | GB0001642635 |
| Aberdeen Emerging Markets Bond | 7 | Medium | Global Emerging Markets Bond | GB00B5L9HN22 |
| Liontrust Sustainable Future Cautious Managed | 6 | Medium | Mixed Investment 40-85% Shares | GB00BMN90304 |
With equity markets rallying strongly it's not surprising that some of the funds in my portfolio have fallen from the BOTB and BFBS lists. That is not to say that they are suddenly bad funds, but there are other better opportunities emerging.
If we work through each of the funds coloured red in turn...
JPM Emerging Markets Income - last time this was the only fund within my portfolio that was earmarked for removal. I cut my exposure in half at the time and this month I will complete its removal from my portfolio. In order to maintain some exposure to emerging markets, loosely in line with that of the BOTB, I will make a like for like switch for another EM fund. Ironically the fund I will replace it with is its stablemate which is more growth orientated (see below).
Liontrust Sustainable Future Cautious Managed - it's too soon to make a decision on this fund as I've only held it for a few weeks. Despite it falling out of the BOTB it is still up 3% in the time it's been in the portfolio, in line with the Mixed Investment 40-85% Shares sector average. For now I am keeping the fund.
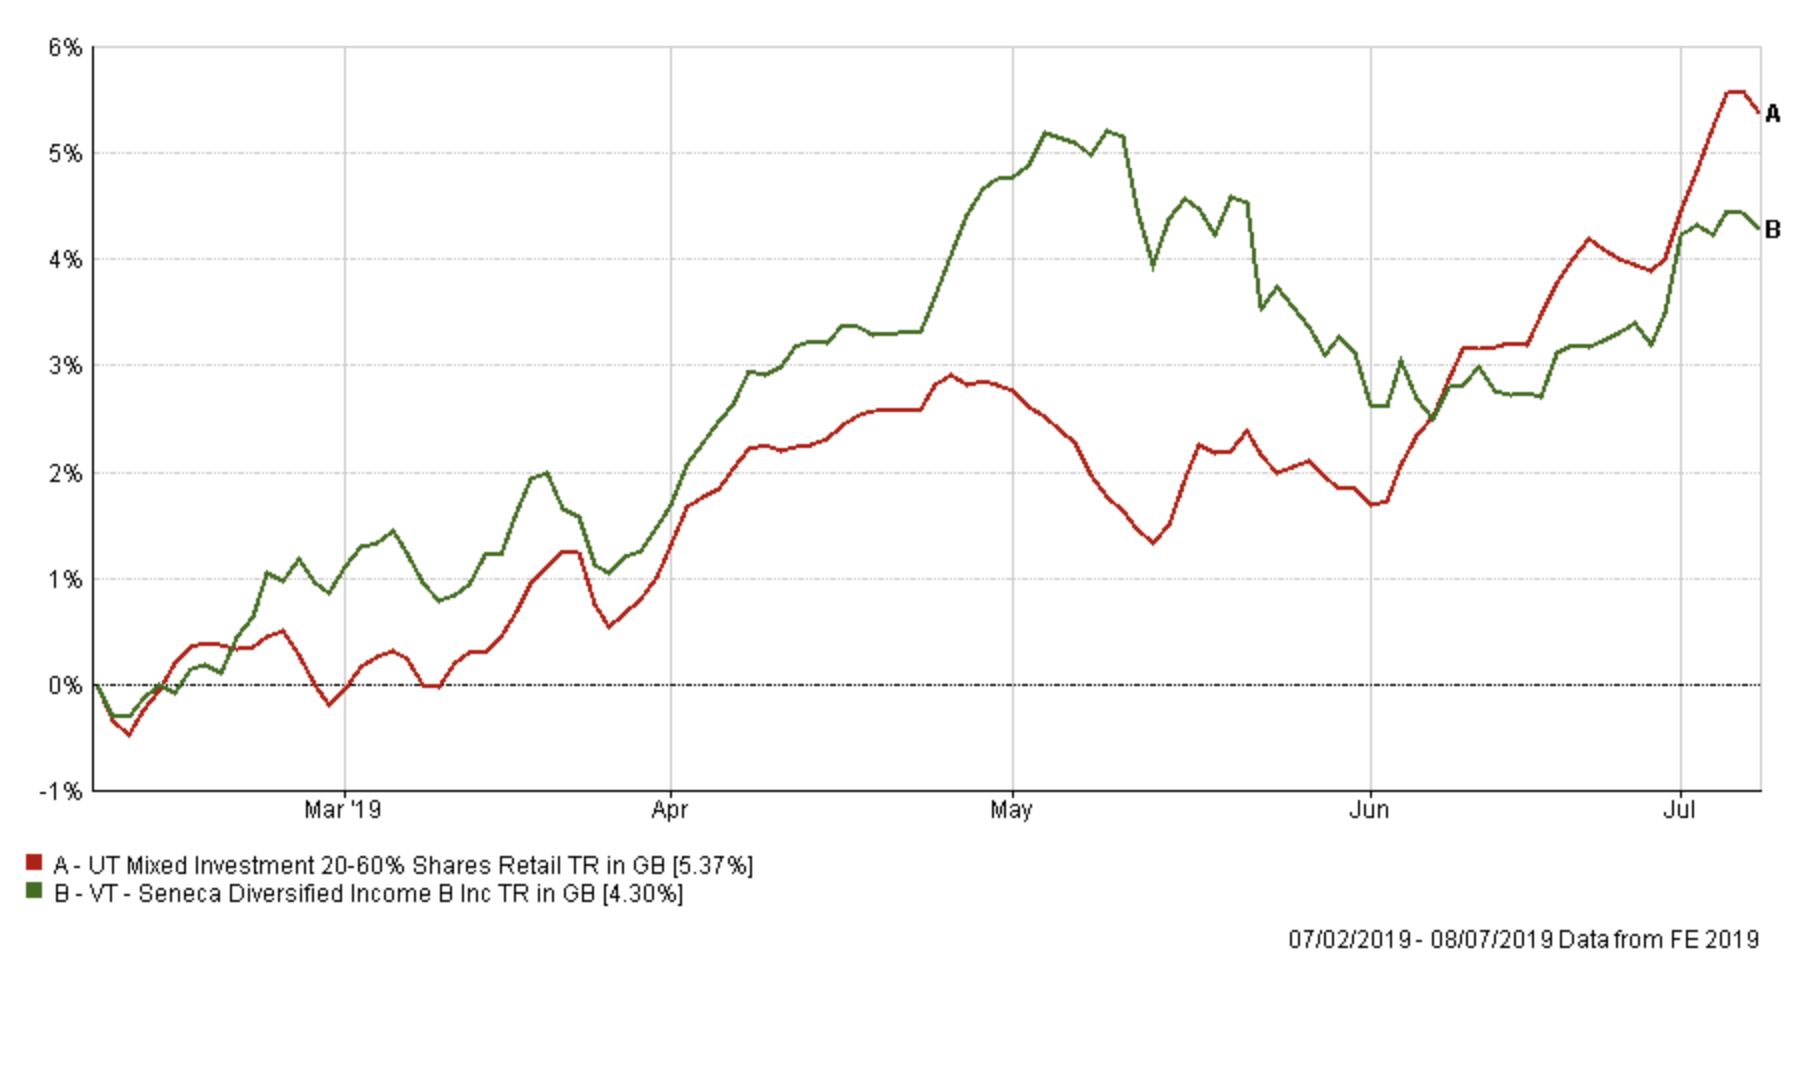
VT Seneca Diversified Income - a fund that has been in my portfolio since the 7th February. As the chart below shows, the fund powered ahead of its peers for three months until we hit May. Since then it's underperformed its peer group substantially and now seems a good time to take profits, with the fund having fallen out of the BOTB and BFBS tables, and reinvest the money.
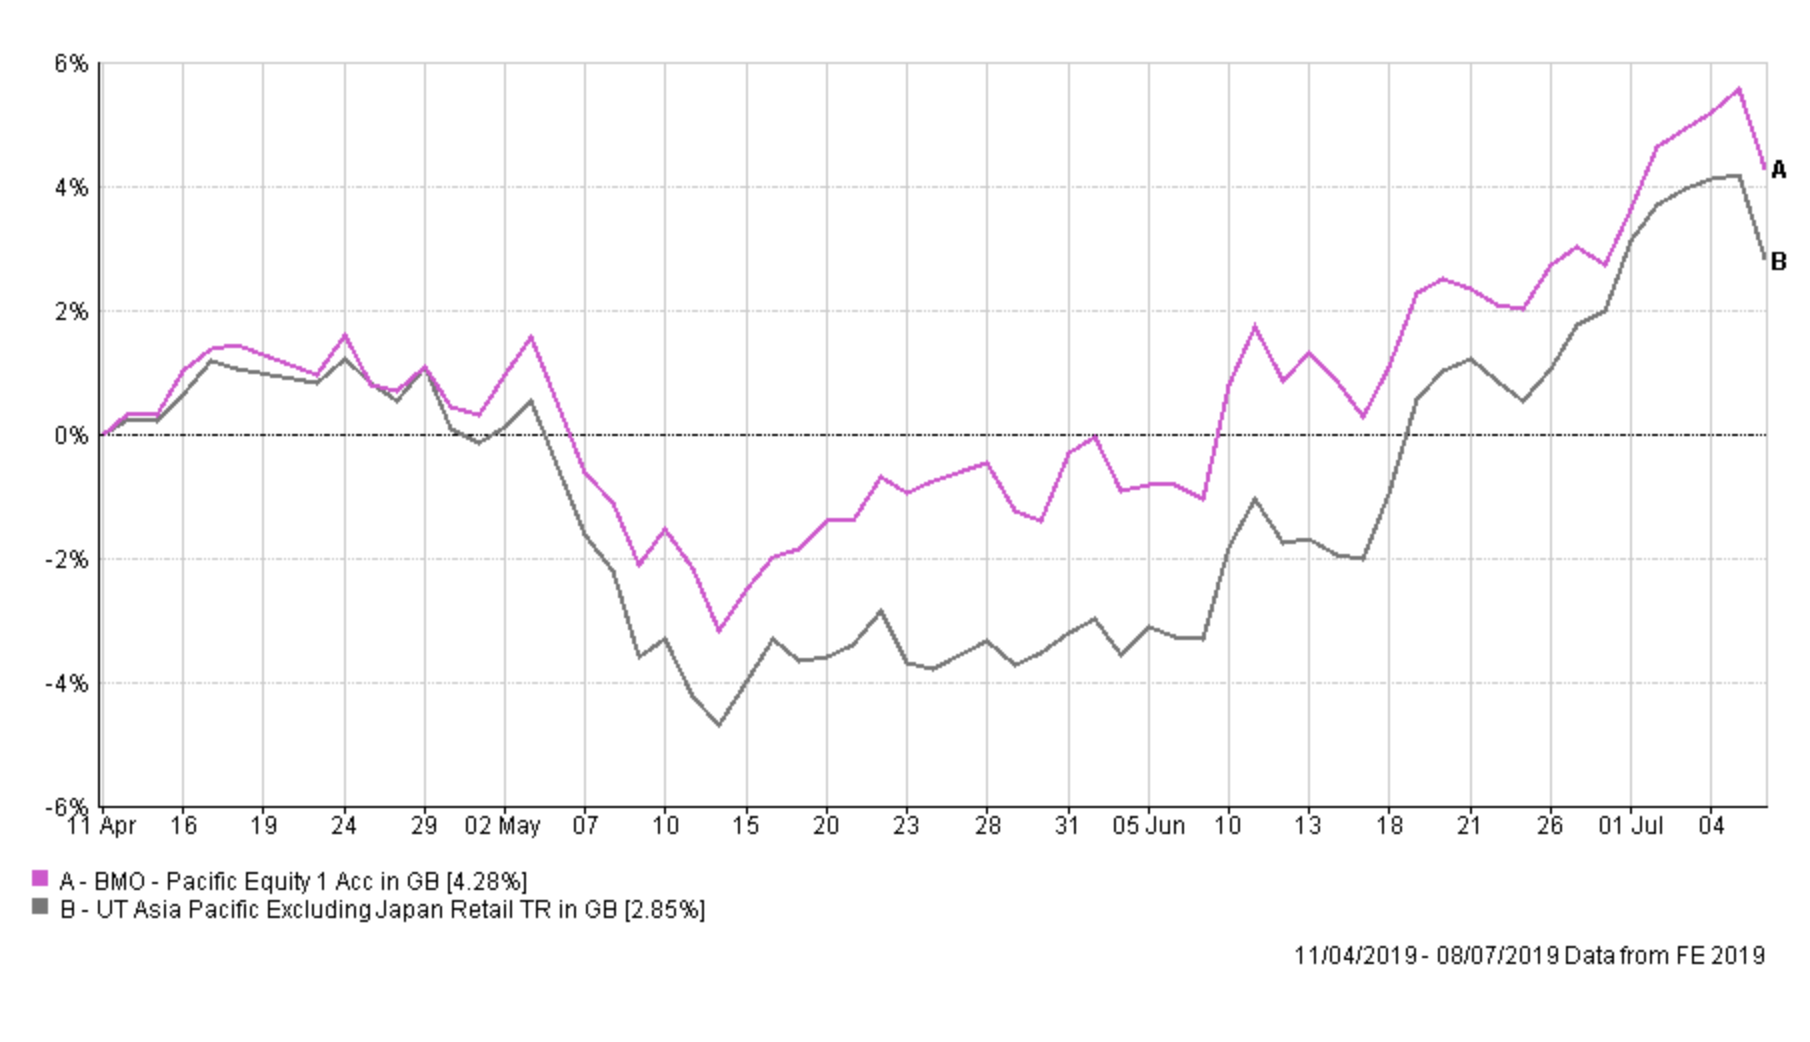
BMO Pacific Equity - the fund has performed well in the three months I've held it thanks to a strong rally in Indian equities. It has also managed to preserve capital when equity markets fell around the globe. It makes up a very small part of my portfolio so I am happy to switch the fund now that it has fallen from the 80-20 investor lists.
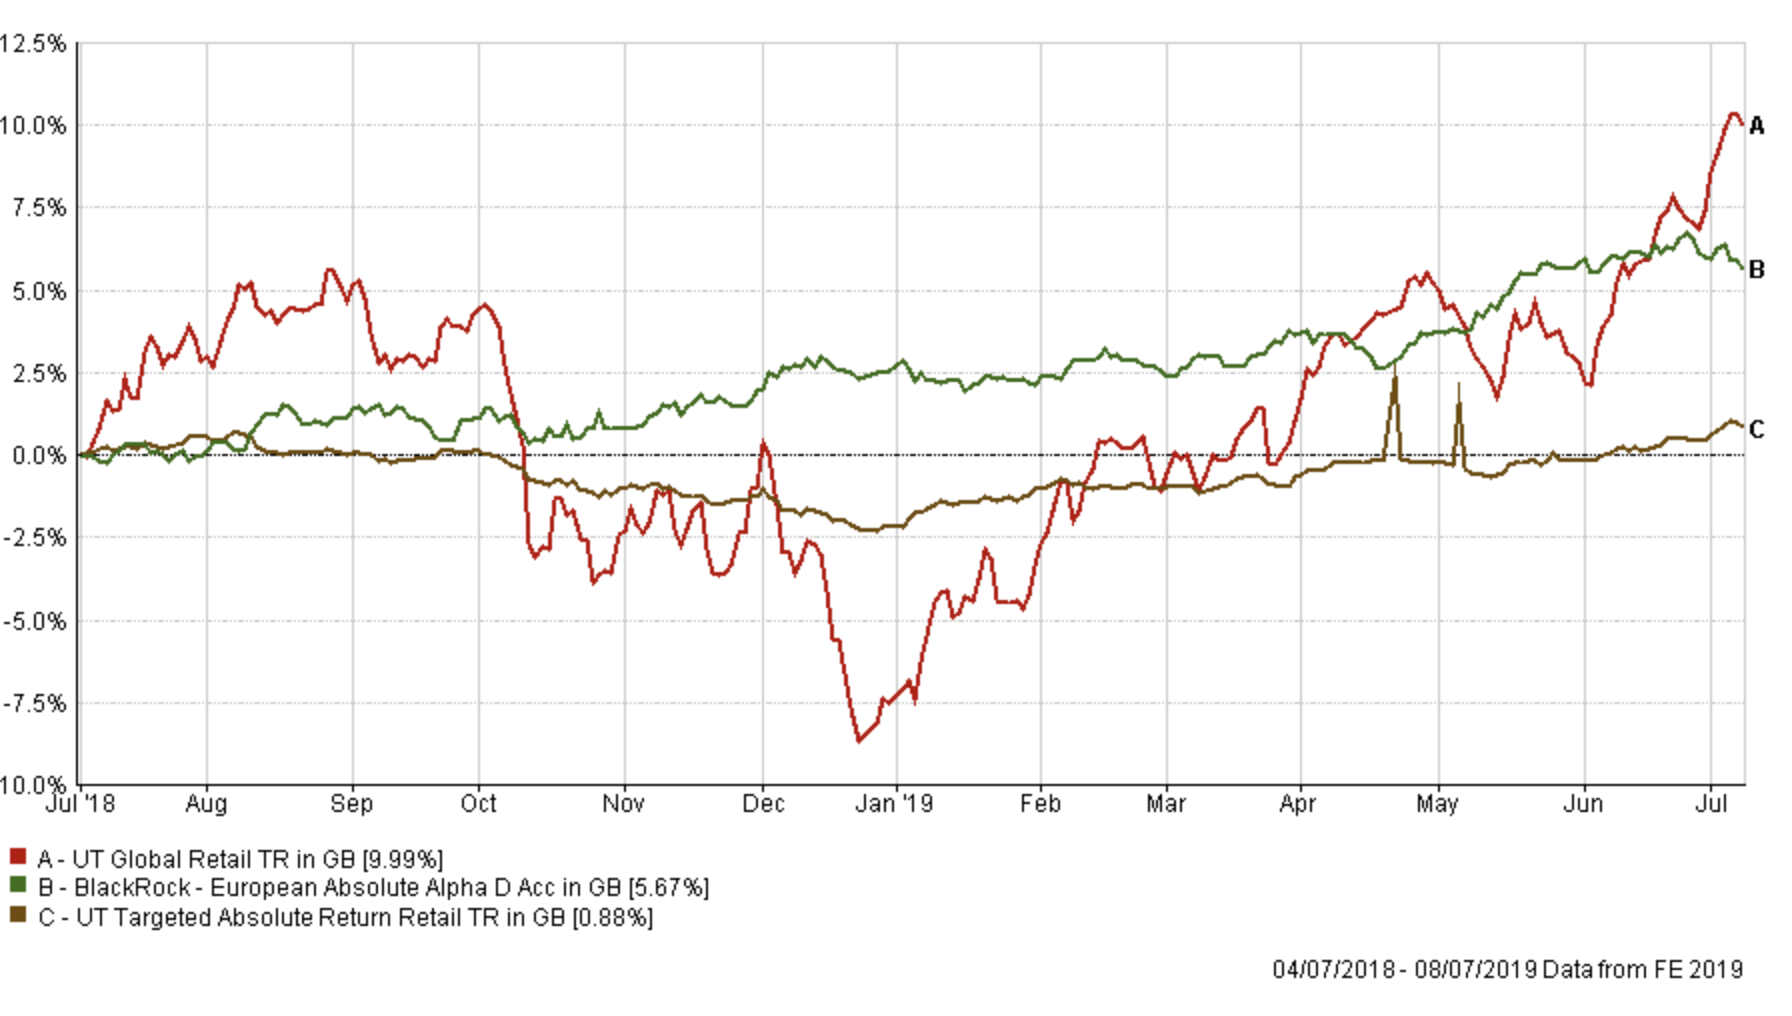
BlackRock European Absolute Alpha - this fund has been an incredible pick for my £50k portfolio over the last year. Ever present and comfortably outperforming its peers and even global equities (until June's rally) as shown in the chart below. I even topped-up the fund last month from the proceeds of a fund sale. However, the fund has finally dropped out of the BOTB and BFBS. It may prove to be a short absence, it also doesn't make it a bad fund, however with bond yields continuing to tumble bond funds have provided a better return for a number of months now.
Fidelity Global Enhanced Income - this fund has been in the portfolio for over 5 months and has performed well as shown in the chart below.
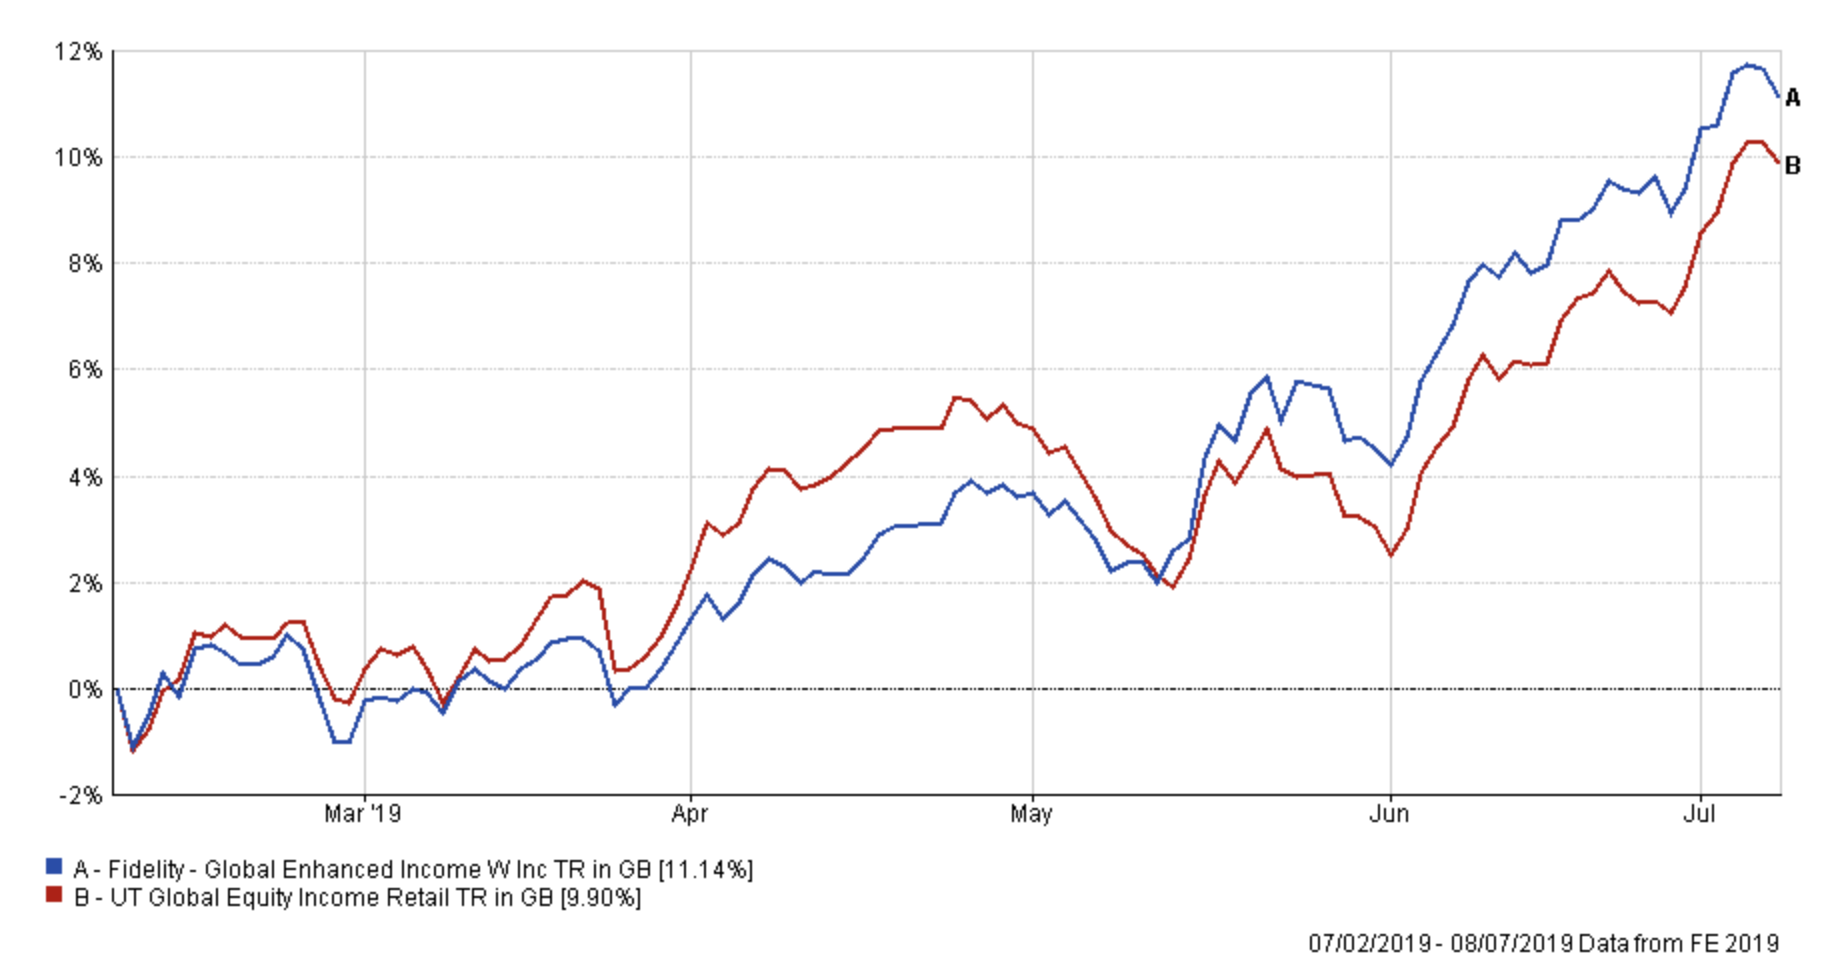
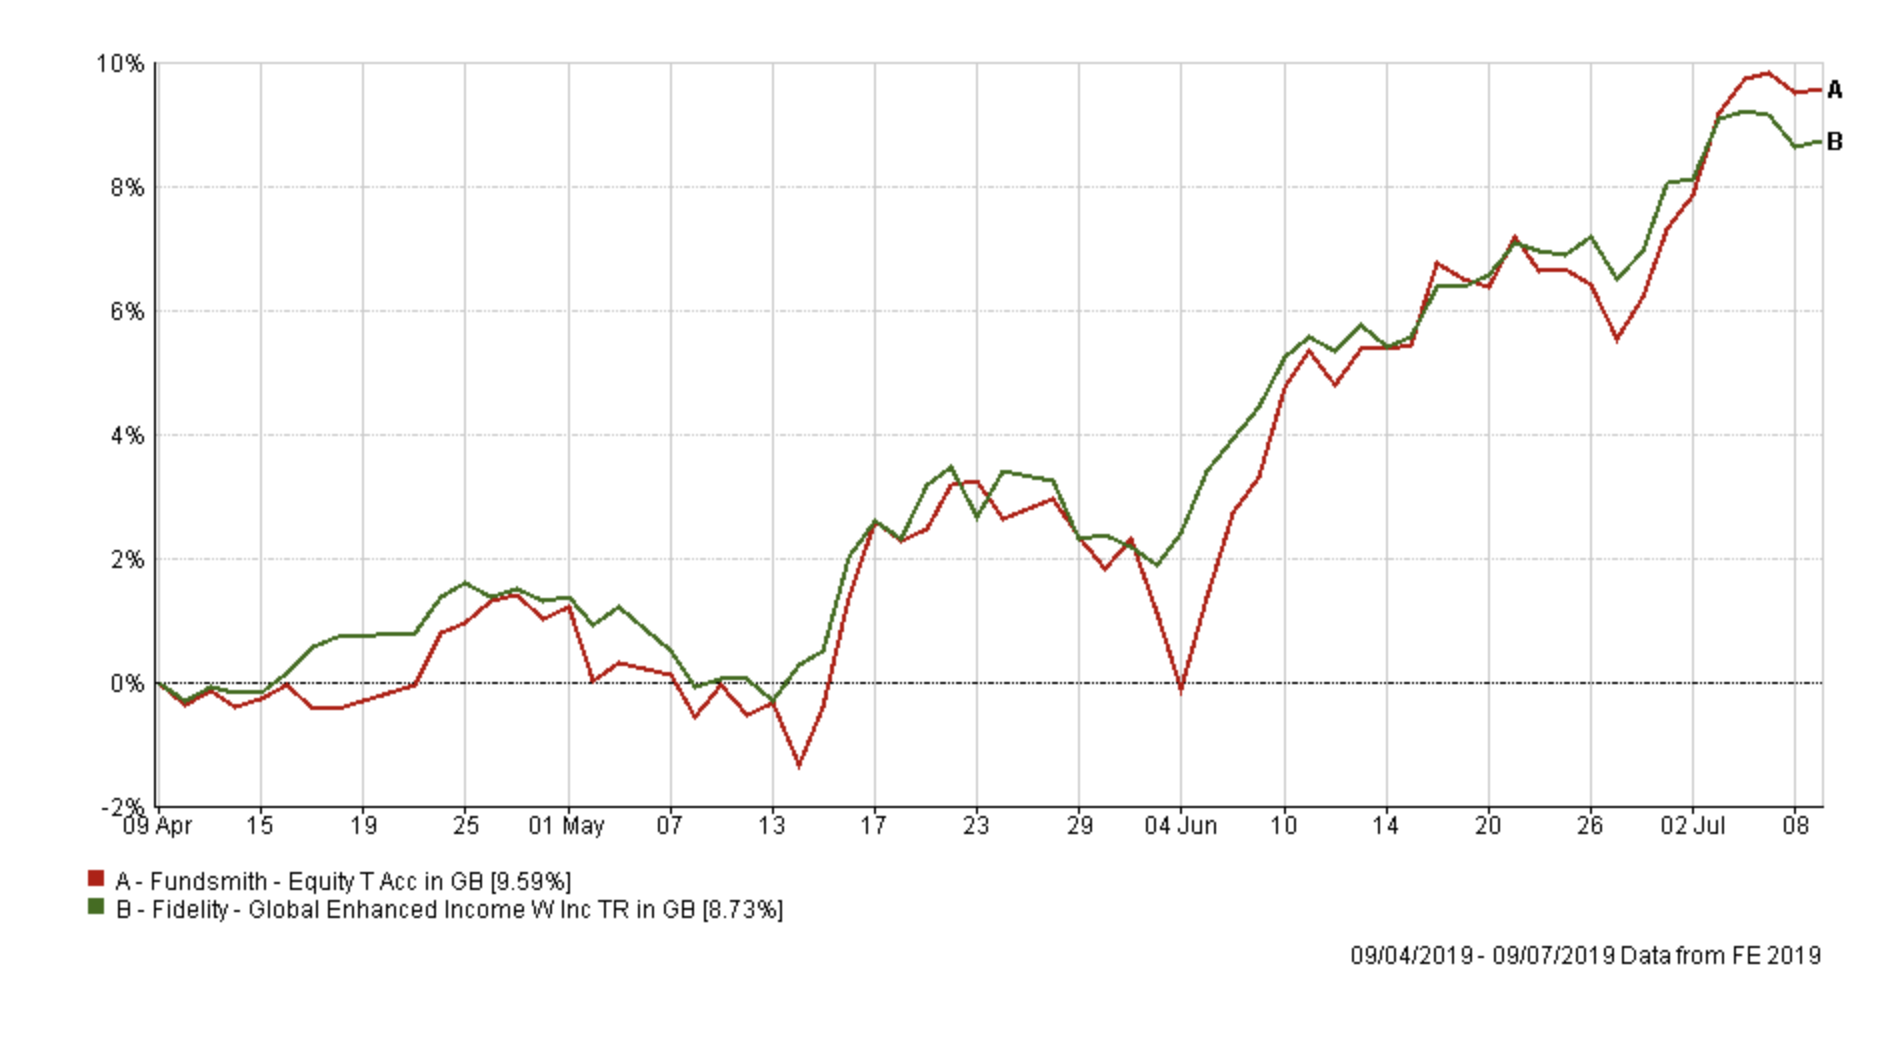
While the fund has dropped out of the BOTB and BFBS lists, the alternatives from the BOTB which I've considered, such as Fundsmith Equity, have performed in line with the Fidelity fund over the last few months, as shown below. As such I am in less of a hurry to change this fund but will review things next time. In addition, the fund is only a small holding and by leaving it in my portfolio for now it minimises the number of switches I'm making on this occasion, hopefully without hampering the portfolio's performance.
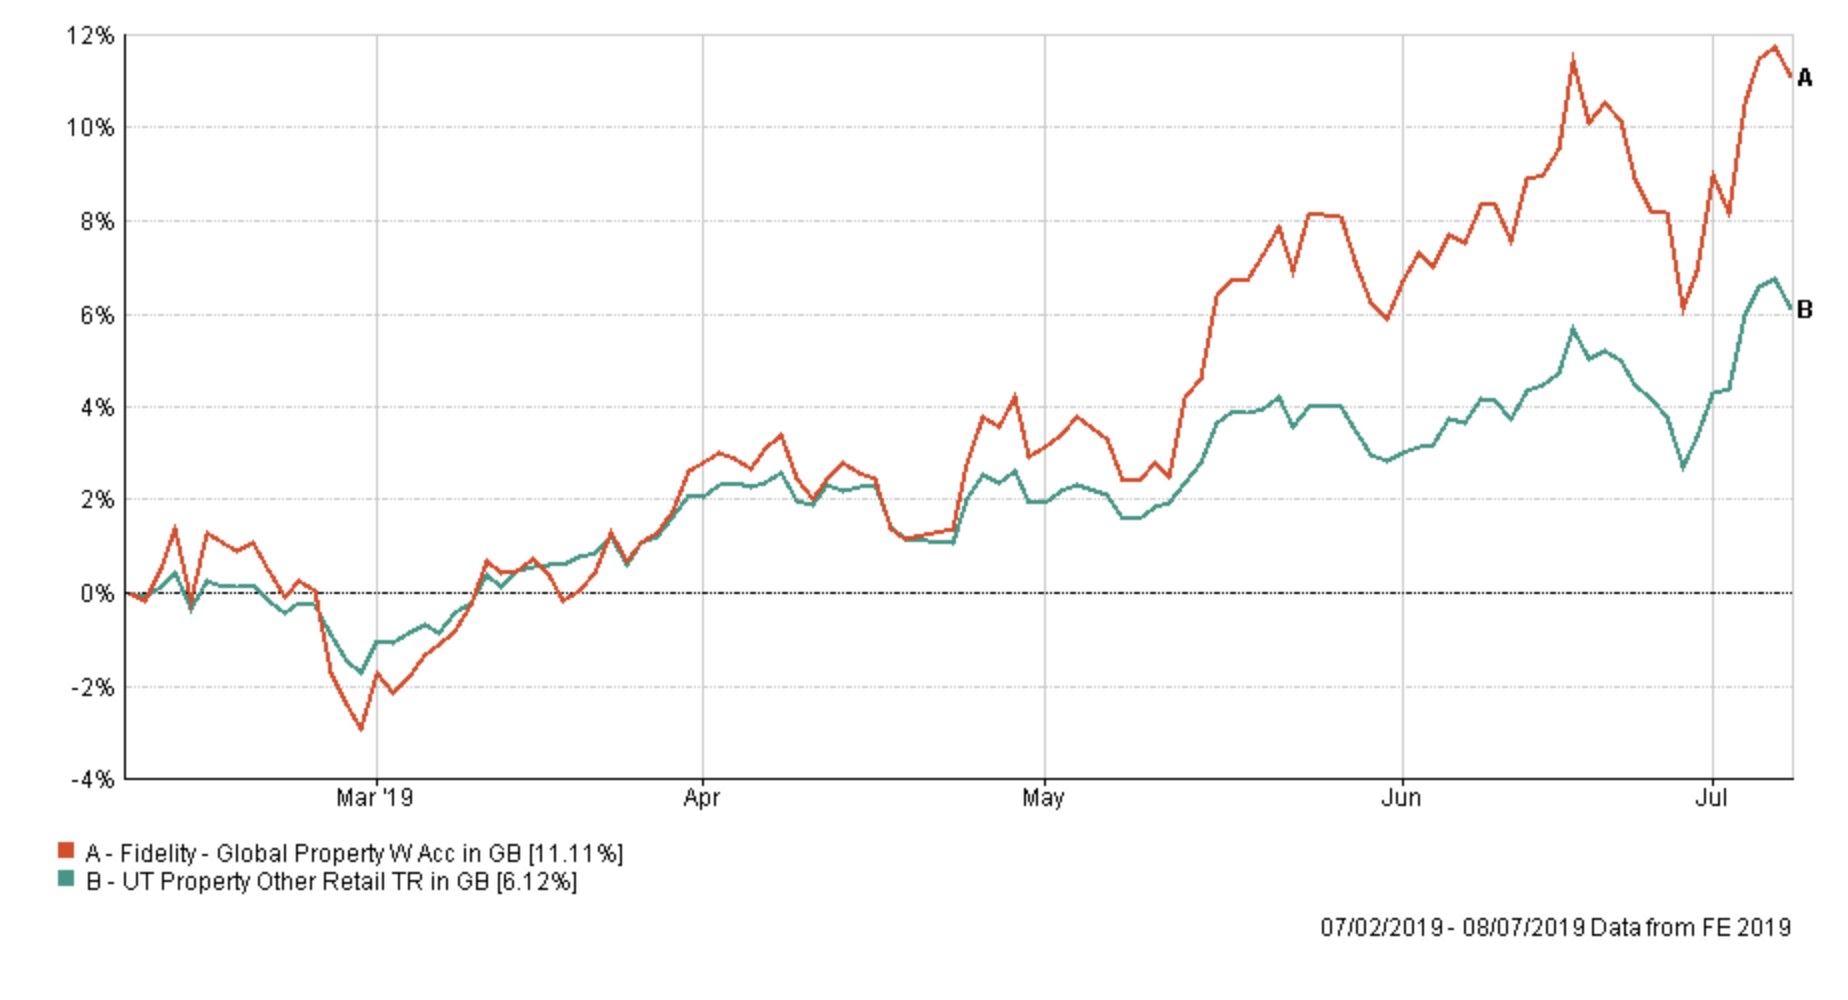
With regards to the other funds within my portfolio, I plan to leave them be for now. Interestingly the BOTB's exposure to both gilts and property shares has reduced. Both of these parts of my portfolio have performed well since I've held them, particularly Fidelity Global Property (see chart below) but I will slightly reduce my gilt exposure to lock in some recent profits. In addition, the HSBC gilt fund has performed in line with its sector so is not setting the world alight.
Therefore I have decided to make the following fund changes:
Fund changes
- Sell 1/3 HSBC UK Gilt Index and invest 100% into TB Evenlode Global Income
- Sell 100% BlackRock European Absolute Alpha and invest 25% into Aberdeen Emerging Markets Bond, 25% into BNY Mellon Real Return and 50% into Fundsmith Equity
- Sell 100% VT Seneca Diversified Income and invest 100% into TB Evenlode Global Income
- Sell 100% BMO Pacific Equity and invest 100% into Aberdeen European Equity
- Sell 100% JPM Emerging Markets Income and invest 100% into JPM Emerging Markets
Overall the switches will increase my equity exposure, principally to the US, Europe and the UK at the expense of the alternative strategies within Blackrock European Absolute Alpha but also at the expense of some of my gilt exposure. The replacement funds all are in the BOTB and BFBS tables and are a mix of growth and income-focused funds. The latter should hopefully help preserve capital and reduce volatility in the next market sell-off.
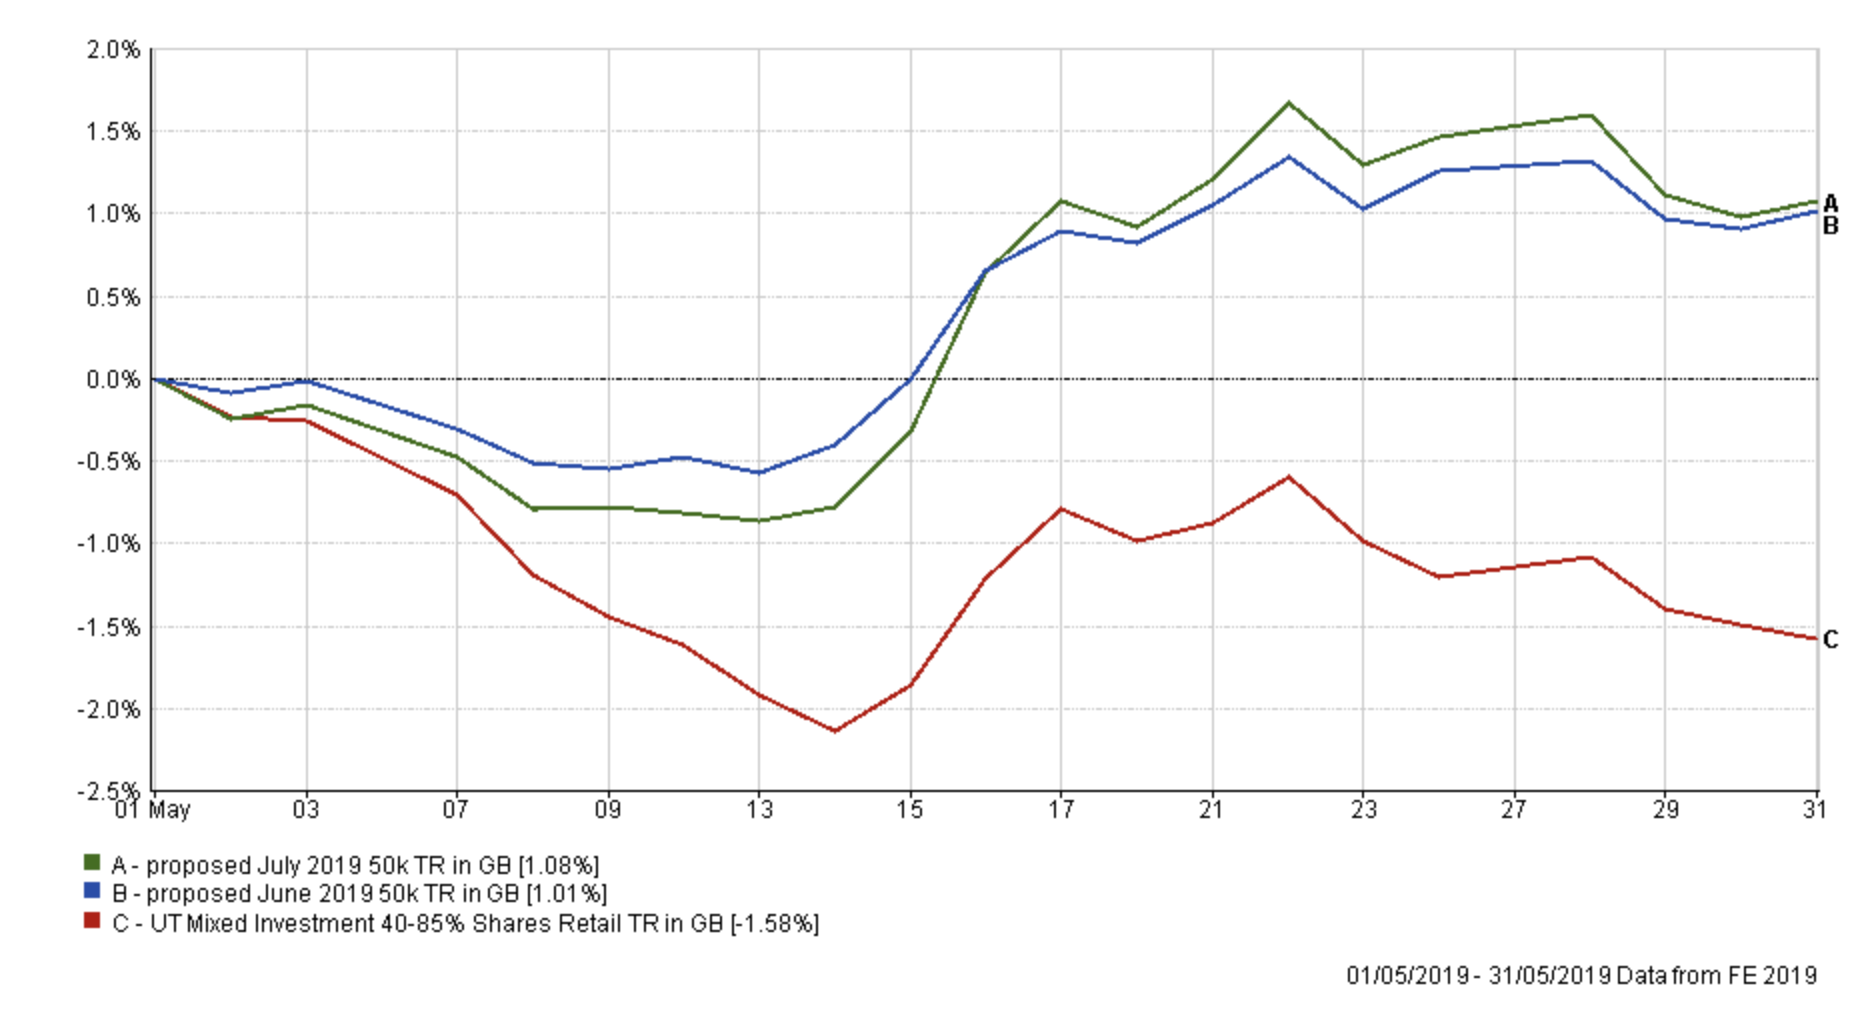
As my portfolio's equity exposure has risen to 62% up from 44% inevitably the risk profile of my portfolio has increased. Only time will tell if this proves a profitable move. However, having backtested the new portfolio (green line) versus the old portfolio (blue line) to see how it would have performed during the sell-off in May 2019, you can see that it would have still held up versus a typical managed fund.
The switches only impact 32% of my portfolio and with almost half of that being from low-risk funds it should help minimises the impact of investment markets moving against me. My portfolio has not significantly changed since the update in February so this update marks something of a refresh.
My portfolio
My new portfolio now looks like this:
| Fund | Allocation % | Risk | Sector | ISIN Code |
| Fidelity Global Enhanced Income | 5 | Medium | Global Equity Income | GB00BD1NLJ41 |
| Fidelity Global Property | 12 | High | Property Other | GB00B7K2NZ09 |
| M&G Global Listed Infrastructure | 14 | Medium | Global | GB00BF00R928 |
| HSBC UK Gilt Index | 6 | Low | UK Gilts | GB00B4581C50 |
| Janus Henderson Fixed Interest Monthly Income | 10 | Low | Sterling Strategic Bond | GB0001920486 |
| BNY Mellon Real Return (formerly Newton Real Return) | 11 | Low | Targeted Absolute Return | GB0001642635 |
| Aberdeen Emerging Markets Bond | 9.5 | Low | Global Emerging Markets Bond | GB00B5L9HN22 |
| Liontrust Sustainable Future Cautious Managed | 6 | Medium | Mixed Investment 40-85% Shares | GB00BMN90304 |
| Aberdeen European Equity | 3 | High | Europe Excluding UK | GB00B0LG6P37 |
| Fundsmith Equity | 5 | High | Global | GB00B4Q5X527 |
| JPM Emerging Markets | 6 | High | Global Emerging Markets | GB0030881550 |
| TB Evenlode Global Income | 12.5 | Medium | Global Equity Income | GB00BF1QMV61 |
My asset mix
This means my asset mix is as follows (previous asset mix is in brackets):
-
- UK Equities 9% (7%)
- North American Equities 18% (10%)
- Global Fixed Interest 9% (12%)
- Japanese Equities 0% (0%)
- Other International Equities 0% (0%)
- Emerging market equities 5% (6%)
- European Equities 13% (6%)
- UK Fixed Interest 0% (0%)
- Cash 4% (5%)
- Alternative Investment Strategies 9% (23%) (including absolute return)
- Emerging Market Fixed Interest 10% (7%)
- Gilts 6% (9%)
- Asian equities 5% (3%)
- Property 12% (12%) - most of which is equities in the US.
Damien's higher risk and low risk portfolios
Using the logic described in my post: Damien’s Higher Risk Portfolio I created higher and lower risk versions of my portfolio by popular demand.
Higher risk
| Fund | Allocation |
| Fidelity Global Enhanced Income | 8 |
| Fidelity Global Property | 19 |
| M&G Global Listed Infrastructure | 22 |
| Liontrust Sustainable Future Cautious Managed | 10 |
| Aberdeen European Equity | 5 |
| Fundsmith Equity | 8 |
| JPM Emerging Markets | 9 |
| TB Evenlode Global Income | 19 |
Lower risk
| Fund | Allocation |
| Fidelity Global Enhanced Income | 7 |
| M&G Global Listed Infrastructure | 19 |
| HSBC UK Gilt Index | 8 |
| Janus Henderson Fixed Interest Monthly Income | 14 |
| BNY Mellon Real Return (formerly Newton Real Return) | 15 |
| Aberdeen Emerging Markets Bond | 13 |
| Liontrust Sustainable Future Cautious Managed | 8 |
| TB Evenlode Global Income | 16 |

£200 Pension Cashback Offer
Make a qualifying deposit or transfer a pension to our partner Interactive Investor.
- Deposit or transfer a pension of at least £20k and you could earn £200 cashback
- Terms and Fees apply, Capital at risk
- New & Existing customers opening a SIPP
- Offer ends 31st July 2026
Before starting your transfer, check you won't lose any valuable benefits (such as guaranteed annuity rates or a lower protected pension age) and find out what exit fees you might have to pay
