

The background to my portfolio
Back in March 2015 I decided to invest £50,000 of my own money using 80-20 Investor. The purpose was twofold, firstly to show how you can use 80-20 Investor to invest and outperform the market with only a few minutes effort every now and then. Secondly, no other investment commentator, journalist or research provider invests their own money for fear of failing. This is a sorry state of affairs and is precisely why I committed to openly running my own portfolio for 80-20 Investor members to see.
Since then I have periodically changed my portfolio using the fund suggestions provided by the 80-20 Investor algorithm and associated research. I always disclose the changes at the time they are made.
Performance update
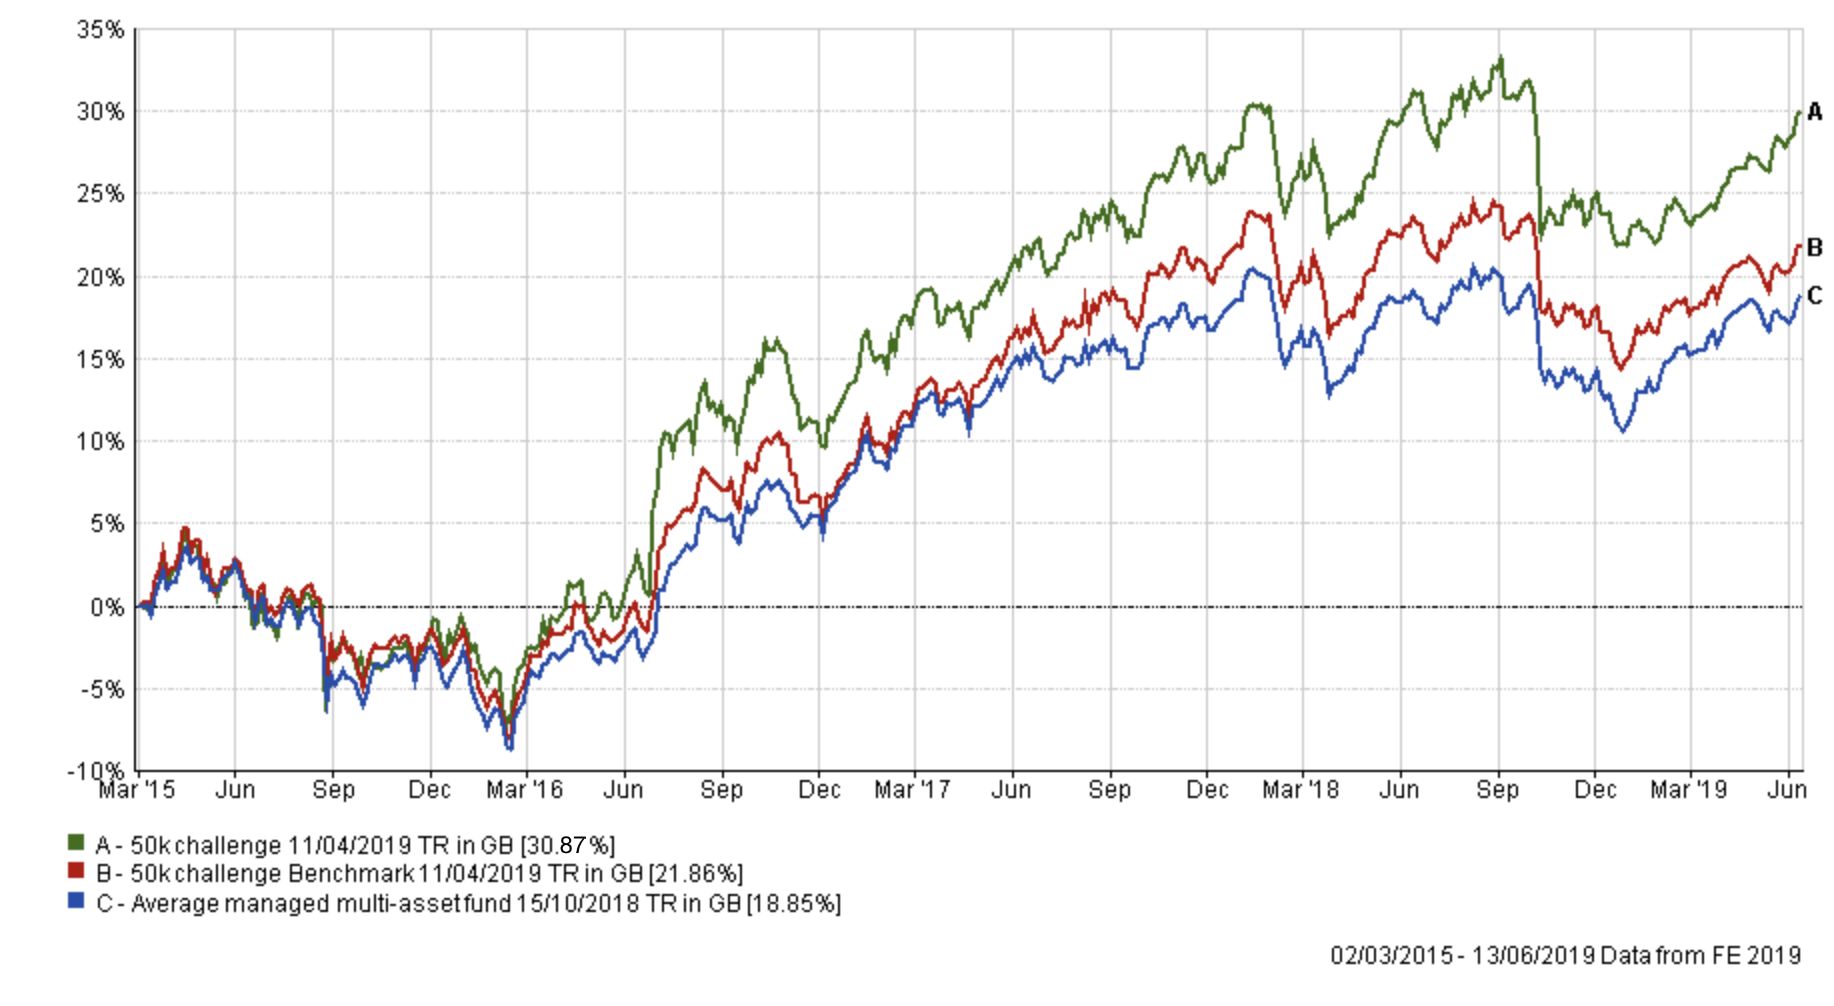
As is usual in my portfolio reviews, the chart below shows how my portfolio has outperformed since I started the challenge in March 2015, four years ago. The green line is the performance of my portfolio while the red line is the benchmark showing the average return achieved by professional fund managers given the same asset mix. To accurately calculate this I have used the average return for each sector in which my portfolio invested. The blue line shows what the average multi-asset fund with comparable equity content achieved. In other words, the red line would show the extra performance added by just the asset mix of my portfolio (where I was invested i.e European equities etc) over picking a typical multi-asset fund (the blue line). While the green line (which is my actual performance) shows the impact of being in the right funds at the right time, as identified by the 80-20 Investor algorithm.
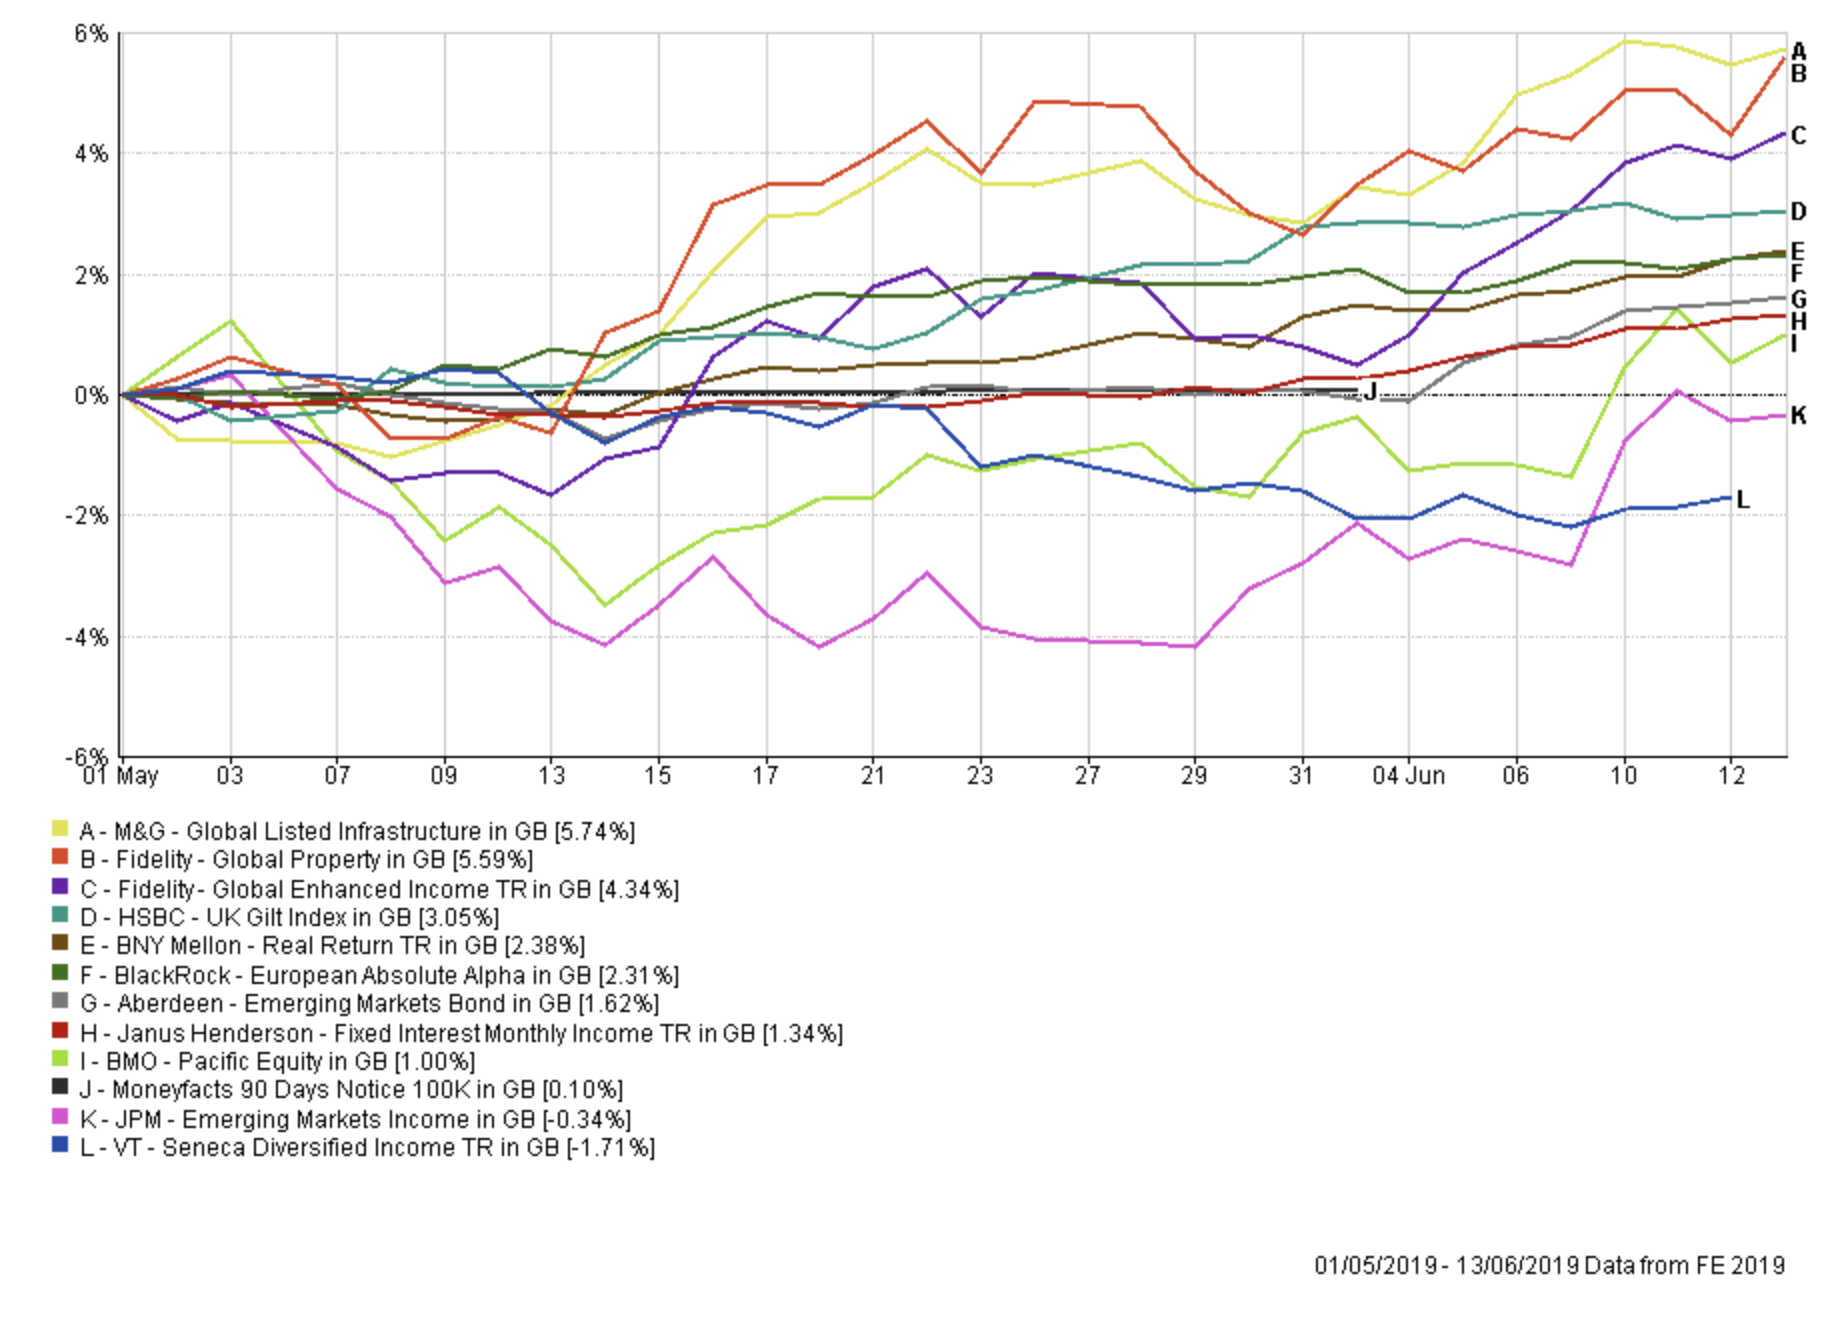
During my last portfolio review, I talked about how the power of process pays off in turbulent markets. As May progressed my portfolio continued to outperform with bond markets rallying strongly while bond proxies such as shares in REITs and utilities also gained. This explains the strong May performance of the Fidelity Global Property, M&G Global Listed Infrastructure and HSBC UK Gilt funds within my £50k portfolio, as shown in the chart below. Following the trend rather than headlines can be uncomfortable but it is usually far more profitable in the long term. It's the reason why my portfolio was up 0.78% in May despite the market sell-off, outperforming all 400 funds from across the Mixed Investment 40-85% Shares and Mixed Investment 20-60% Shares sectors. In fact, only 18 funds even made a profit in May.
With equity markets still volatile, the trend is always prone to change. In fact equity markets rallied strongly during the first week of June, driven by the hope that the US Federal Reserve would cut interest rates, but stocks have since taken a pause for breath. If equity markets rally suddenly from here, in an aggressive fashion, then of course my portfolio's more cautious positioning, with only around 43% equity exposure, will temper its performance relative to those funds with large equity exposures. However, as I discussed last time, it's sensible to be aware of the downside risks. So to avoid emotional decisions during turbulent markets I will continue to apply the 80-20 Investor process that has fared well to date.
So applying the process as usual, the table below shows my portfolio's current allocation, with those funds in green still in the BOTB while those in yellow are not in the BOTB but remain in the BFBS list. Meanwhile, any funds in red have dropped out of both shortlists.
| Fund | Allocation % | Risk | Sector | ISIN Code |
| BlackRock European Absolute Alpha | 8 | Low | Targeted Absolute Return | GB00B4Y62W78 |
| BMO Pacific Equity | 3 | High | Asia Pacific Excluding Japan | GB0033143115 |
| Fidelity Global Enhanced Income | 5 | Medium | Global Equity Income | GB00BD1NLJ41 |
| Fidelity Global Property | 11 | High | Property Other | GB00B7K2NZ09 |
| JPM Emerging Markets Income | 12 | High | Global Emerging Markets | GB00B56DF680 |
| VT Seneca Diversified Income | 10 | Low | Mixed Investment 20-60% Shares R | GB00B7JTF560 |
| M&G Global Listed Infrastructure | 13 | Medium | Global | GB00BF00R928 |
| HSBC UK Gilt Index | 7 | Low | UK Gilts | GB00B4581C50 |
| Janus Henderson Fixed Interest Monthly Income | 10 | Low | Sterling Strategic Bond | GB0001920486 |
| BNY Mellon Real Return (formerly Newton Real Return) | 7 | Low | Targeted Absolute Return | GB0001642635 |
| Aberdeen Emerging Markets Bond | 7 | Medium | Global Emerging Markets Bond | GB00B5L9HN22 |
| Cash | 7 | Low | N/A | N/A |
If you look at the table above you can see that only one fund isn't in the BFBS or the BOTB lists, namely the JPM Emerging Markets Income fund. The fund dropped out of the 80-20 Investor lists in April and has been on my watch list ever since. Last month the fund received a stay of execution because it had continued to perform well despite the omission. Furthermore, the BOTB asset mix which I loosely base my portfolio on still maintained an emerging market equity exposure which was only marginally higher than my own £50k portfolio once you took into account my holding in the JPM Emerging Markets Income fund. With equity market volatility spiking I decided to keep the fund within my portfolio last month.
But the Trump trade war tantrum throughout May continued to hurt emerging market equities. Emerging market equities were also hurt by the strengthening dollar. A strong dollar tends to be bad for emerging market assets as I explained in my research article 'Funds for a strong dollar'.
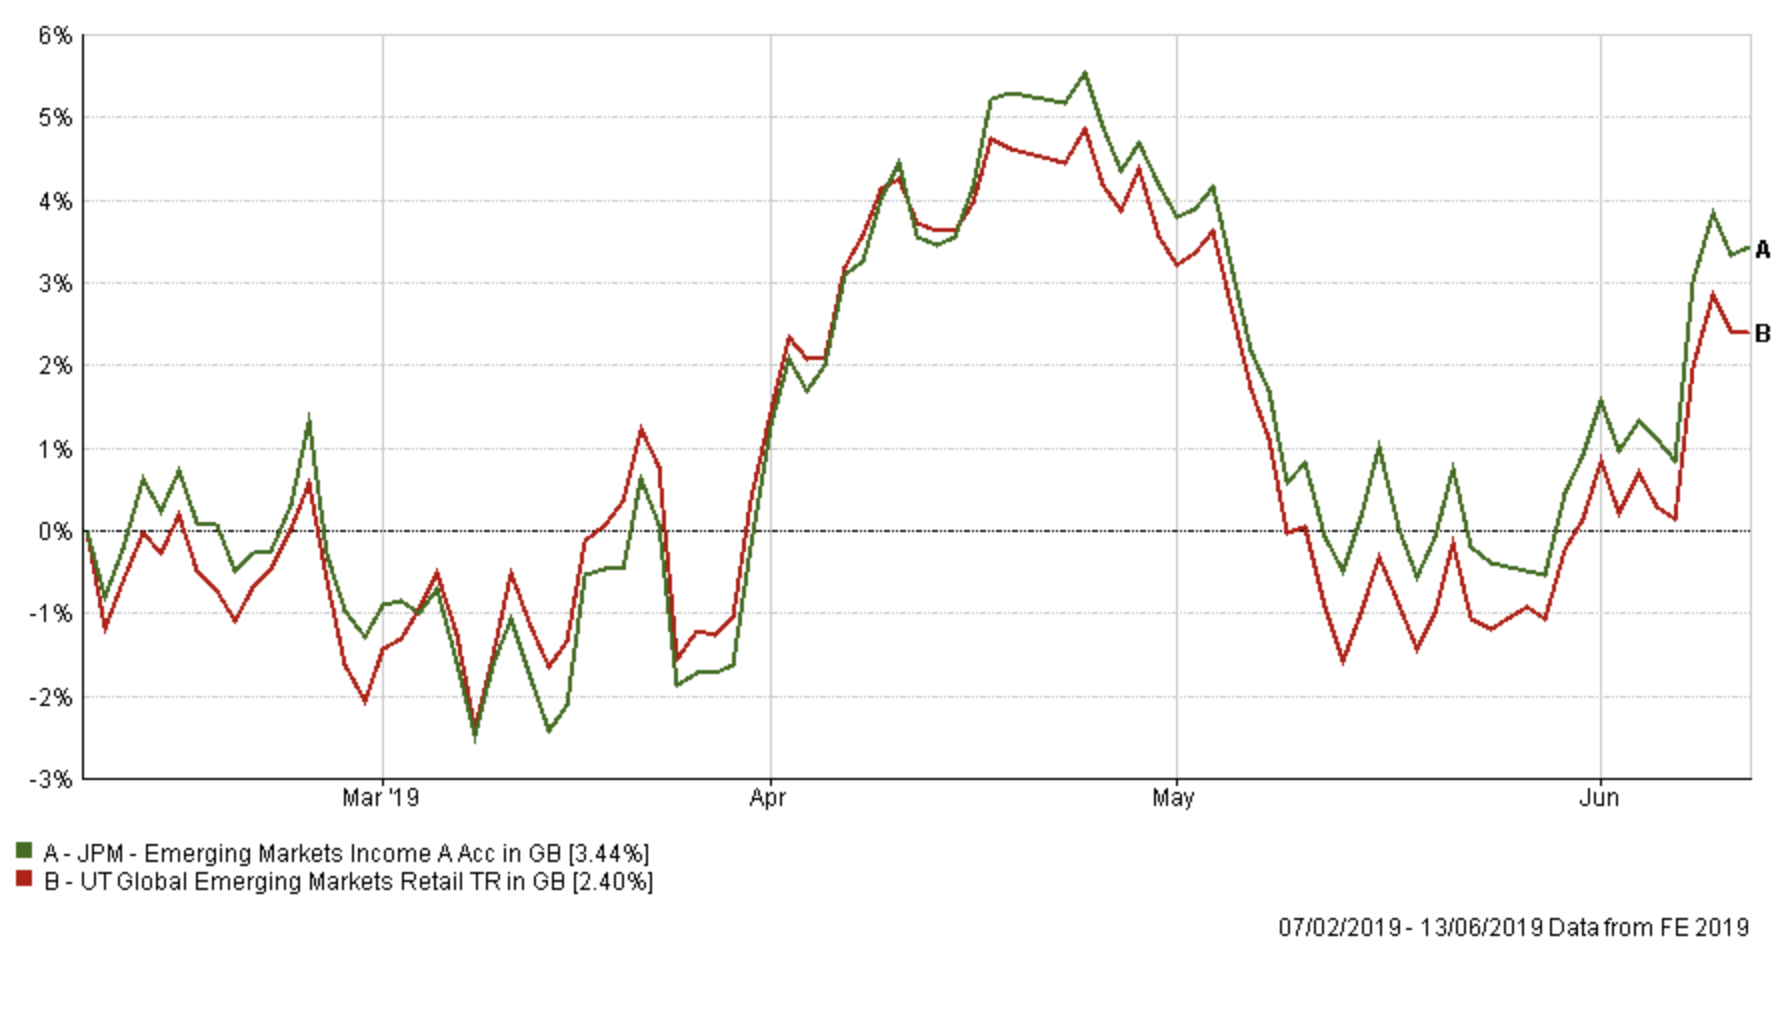
In recent weeks there has been some respite, with the dollar weakening after the US Federal Reserve suggested it may be open to the idea of cutting interest rates. This subsequently buoyed emerging market equities giving the JPM fund a boost. The chart below shows the performance of the JPM fund, versus its sector average, since I've held it. Its performance has been good, outperforming its sector average, but not startling. To the right-hand side you can see how the performance jumped when the dollar tumbled.
Overall there is not much to not like about my portfolio right now, especially given how it outperformed during May. However, the BOTB has since removed all exposure to emerging market equities as the sector's momentum has started to stall. Given that the JPM fund was already on my watch list I plan to slowly drip out of the fund, rather than do anything too drastic given the heightened volatility equity markets are still experiencing. In addition, I plan to invest the last of my cash holding given the attractive investment opportunities that exist in the low-risk area. The low-risk area of my portfolio performed particularly well in May when equity markets tumbled. Bond funds, in particular, have performed better than cash all year (something that wasn’t true at the end of 2018) as investors remain concerned over the possibility of a global recession. Therefore I have decided to make the following fund changes:
Fund changes
- Sell 50% of JPM Emerging Markets Income and put 33% into HSBC UK Gilt Index, 33% into BNY Mellon Real Return (formerly Newton Real Return) and 34% into BlackRock European Absolute Alpha.
- 100% of my cash holding into Liontrust Sustainable Future Cautious Managed.
The two switches will reduce my emerging market equity exposure while putting my cash to work in a cautious managed portfolio. In doing so it increases my UK and US equity exposure slightly without increasing my overall equity exposure overall (which sits around 43%). It also doubles down on the low-risk funds that have performed the best in the current market turmoil (as evidenced in the chart earlier). I chose the Liontrust Sustainable Future Cautious Managed fund as its broad-based equity and bond mix compliments my portfolio without changing the overall equity-to-bond ratio within the portfolio significantly. It is also a fund that has performed well and is currently in the BOTB and BFBS tables.
From a risk perspective, I am replacing the highest and lowest risk holdings in my portfolio with a balance of medium and low-risk holdings, which means the overall risk makeup of my portfolio doesn't change that much.
The switches only impact 13% of my portfolio and with half of that being from cash it minimises the impact of investment markets moving against me. Hence why I am happy to make them. Overall the fund switches are a case of pruning rather than tearing up a portfolio that is clearly performing well at present.
My portfolio
My new portfolio now looks like this:
| Fund | Allocation % | Risk | Sector | ISIN Code |
| BlackRock European Absolute Alpha | 10 | Low | Targeted Absolute Return | GB00B4Y62W78 |
| BMO Pacific Equity | 3 | High | Asia Pacific Excluding Japan | GB0033143115 |
| Fidelity Global Enhanced Income | 5 | Medium | Global Equity Income | GB00BD1NLJ41 |
| Fidelity Global Property | 12 | High | Property Other | GB00B7K2NZ09 |
| JPM Emerging Markets Income | 6 | High | Global Emerging Markets | GB00B56DF680 |
| VT Seneca Diversified Income | 10 | Medium | Mixed Investment 20-60% Shares | GB00B7JTF560 |
| M&G Global Listed Infrastructure | 13 | Medium | Global | GB00BF00R928 |
| HSBC UK Gilt Index | 9 | Low | UK Gilts | GB00B4581C50 |
| Janus Henderson Fixed Interest Monthly Income | 10 | Low | Sterling Strategic Bond | GB0001920486 |
| BNY Mellon Real Return (formerly Newton Real Return) | 9 | Low | Targeted Absolute Return | GB0001642635 |
| Aberdeen Emerging Markets Bond | 7 | Medium | Global Emerging Markets Bond | GB00B5L9HN22 |
| Liontrust Sustainable Future Cautious Managed | 6 | Medium | Mixed Investment 40-85% Shares | GB00BMN90304 |
My asset mix
This means my asset mix is as follows (previous asset mix is in brackets):
-
- UK Equities 7% (5%)
- North American Equities 10% (9%)
- Global Fixed Interest 12% (11%)
- Japanese Equities 0% (0%)
- Other International Equities 0% (0%)
- Emerging market equities 6% (11%)
- European Equities 6% (4%)
- UK Fixed Interest 0% (0%)
- Cash 5% (10%)
- Alternative Investment Strategies 23% (22%) (including absolute return)
- Emerging Market Fixed Interest 7% (7%)
- Gilts 9% (7%)
- Asian equities 3% (3%)
- Property 12% (11%) - most of which is equities in the US.
Damien's higher risk and low risk portfolios
Using the logic described in my post: Damien’s Higher Risk Portfolio I created higher and lower risk versions of my portfolio by popular demand.
Higher risk
| Fund | Allocation |
| Fidelity Global Property | 19 |
| M&G Global Listed Infrastructure | 21 |
| JPM Emerging Markets Income | 10 |
| Fidelity Global Enhanced Income | 8 |
| BMO Pacific Equity | 5 |
| Aberdeen Emerging Markets Bond | 11 |
| Liontrust Sustainable Future Cautious Managed | 10 |
| VT Seneca Diversified Income | 16 |
Lower risk
| Fund | Allocation |
| BlackRock European Absolute Alpha | 13 |
| BNY Mellon Real Return (formerly Newton Real Return) | 11 |
| M&G Global Listed Infrastructure | 16 |
| VT Seneca Diversified Income | 13 |
| Fidelity Global Enhanced Income | 6 |
| HSBC UK Gilt Index | 11 |
| Janus Henderson Fixed Interest Monthly Income | 13 |
| Aberdeen Emerging Markets Bond | 9 |
| Liontrust Sustainable Future Cautious Managed | 8 |

£200 Pension Cashback Offer
Make a qualifying deposit or transfer a pension to our partner Interactive Investor.
- Deposit or transfer a pension of at least £20k and you could earn £200 cashback
- Terms and Fees apply, Capital at risk
- New & Existing customers opening a SIPP
- Offer ends 31st July 2026
Before starting your transfer, check you won't lose any valuable benefits (such as guaranteed annuity rates or a lower protected pension age) and find out what exit fees you might have to pay
