

The background to my portfolio
Back in March 2015 I decided to invest £50,000 of my own money using 80-20 Investor. The purpose was twofold, firstly to show how you can use 80-20 Investor to invest and outperform the market with only a few minutes effort every now and then. Secondly, no other investment commentator, journalist or research provider invests their own money for fear of failing. This is a sorry state of affairs and is precisely why I committed to openly running my own portfolio for 80-20 Investor members to see.
Since then I have periodically changed my portfolio using the fund suggestions provided by the 80-20 Investor algorithm and associated research. I always disclose the changes at the time they are made.
Performance update
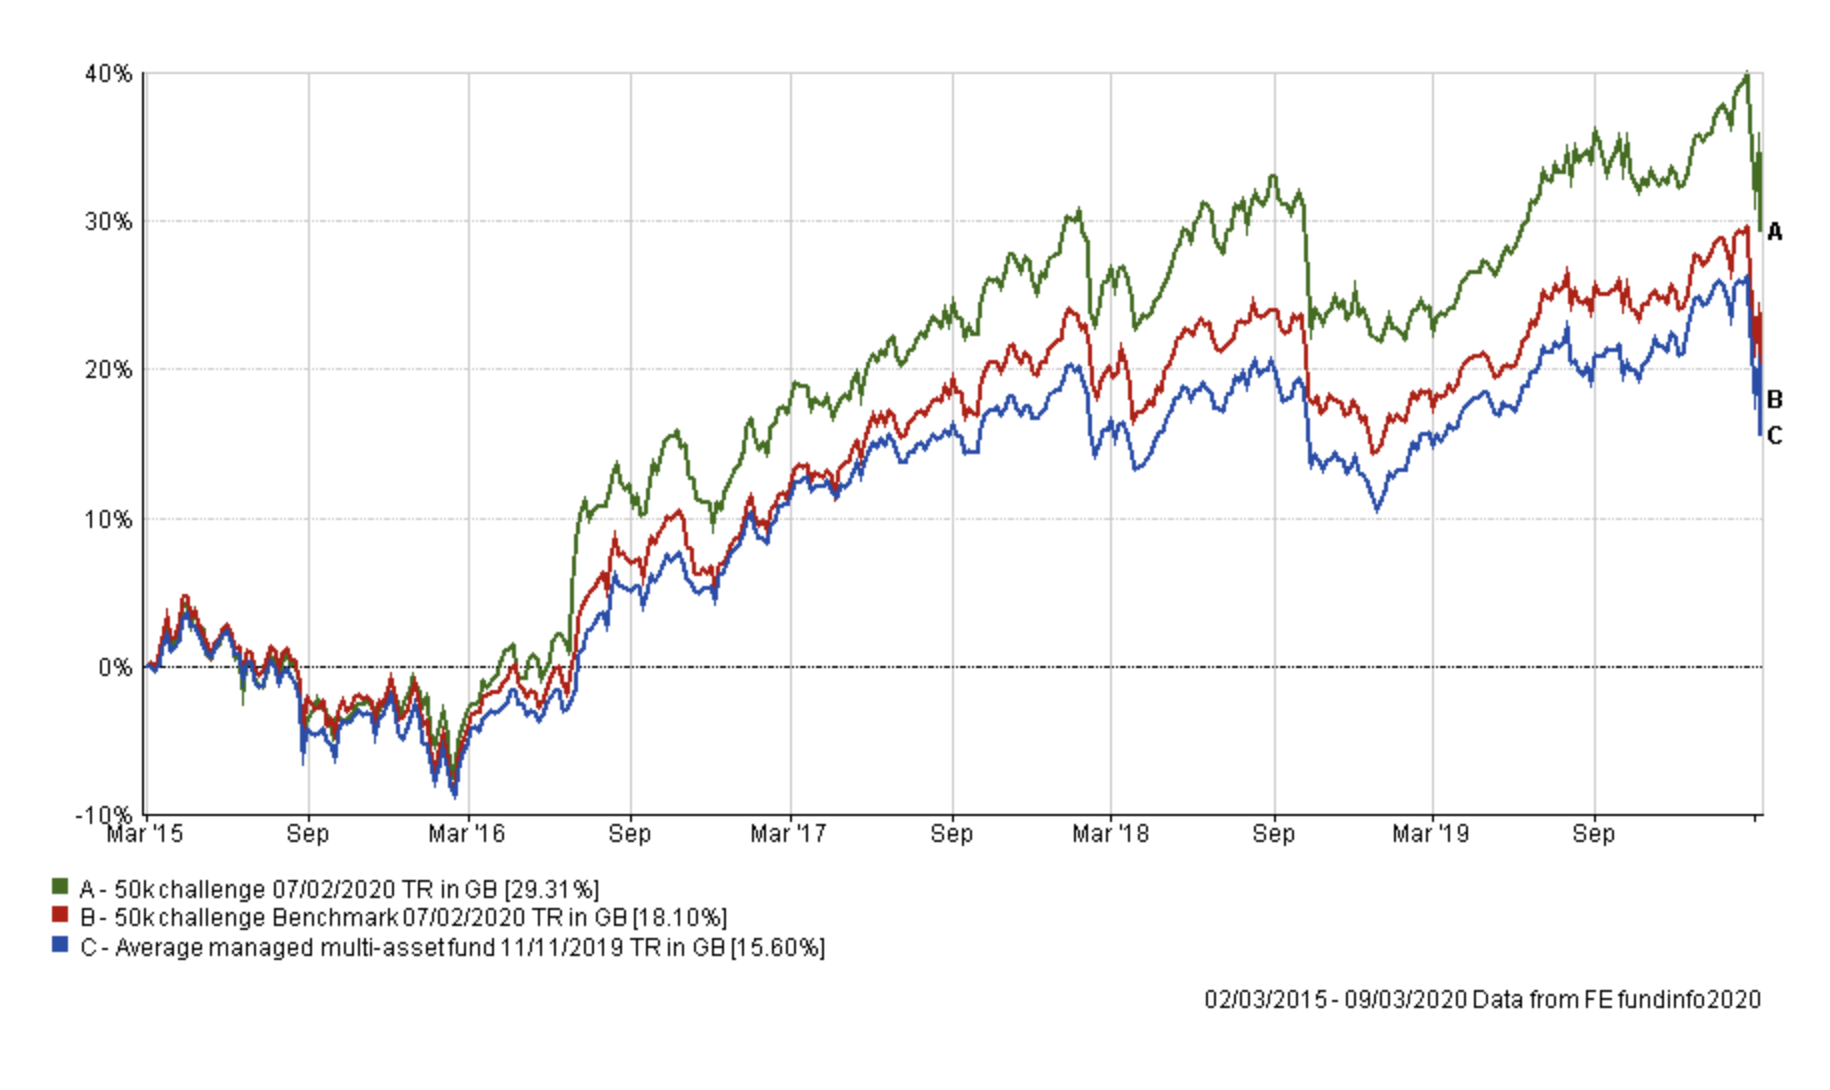
As is usual in my portfolio reviews, the chart below shows how my portfolio has outperformed since I started the challenge in March 2015, which is five years ago. The green line is the performance of my portfolio while the red line is the benchmark showing the average return achieved by professional fund managers given the same asset mix. To accurately calculate this I have used the average return for each sector in which my portfolio invested. The blue line shows what the average multi-asset fund with comparable equity content achieved. In other words, the red line would show the extra performance added by just the asset mix of my portfolio (where I was invested i.e European equities etc) over picking a typical multi-asset fund (the blue line). While the green line (which is my actual performance) shows the impact of being in the right funds at the right time, as identified by the 80-20 Investor algorithm.
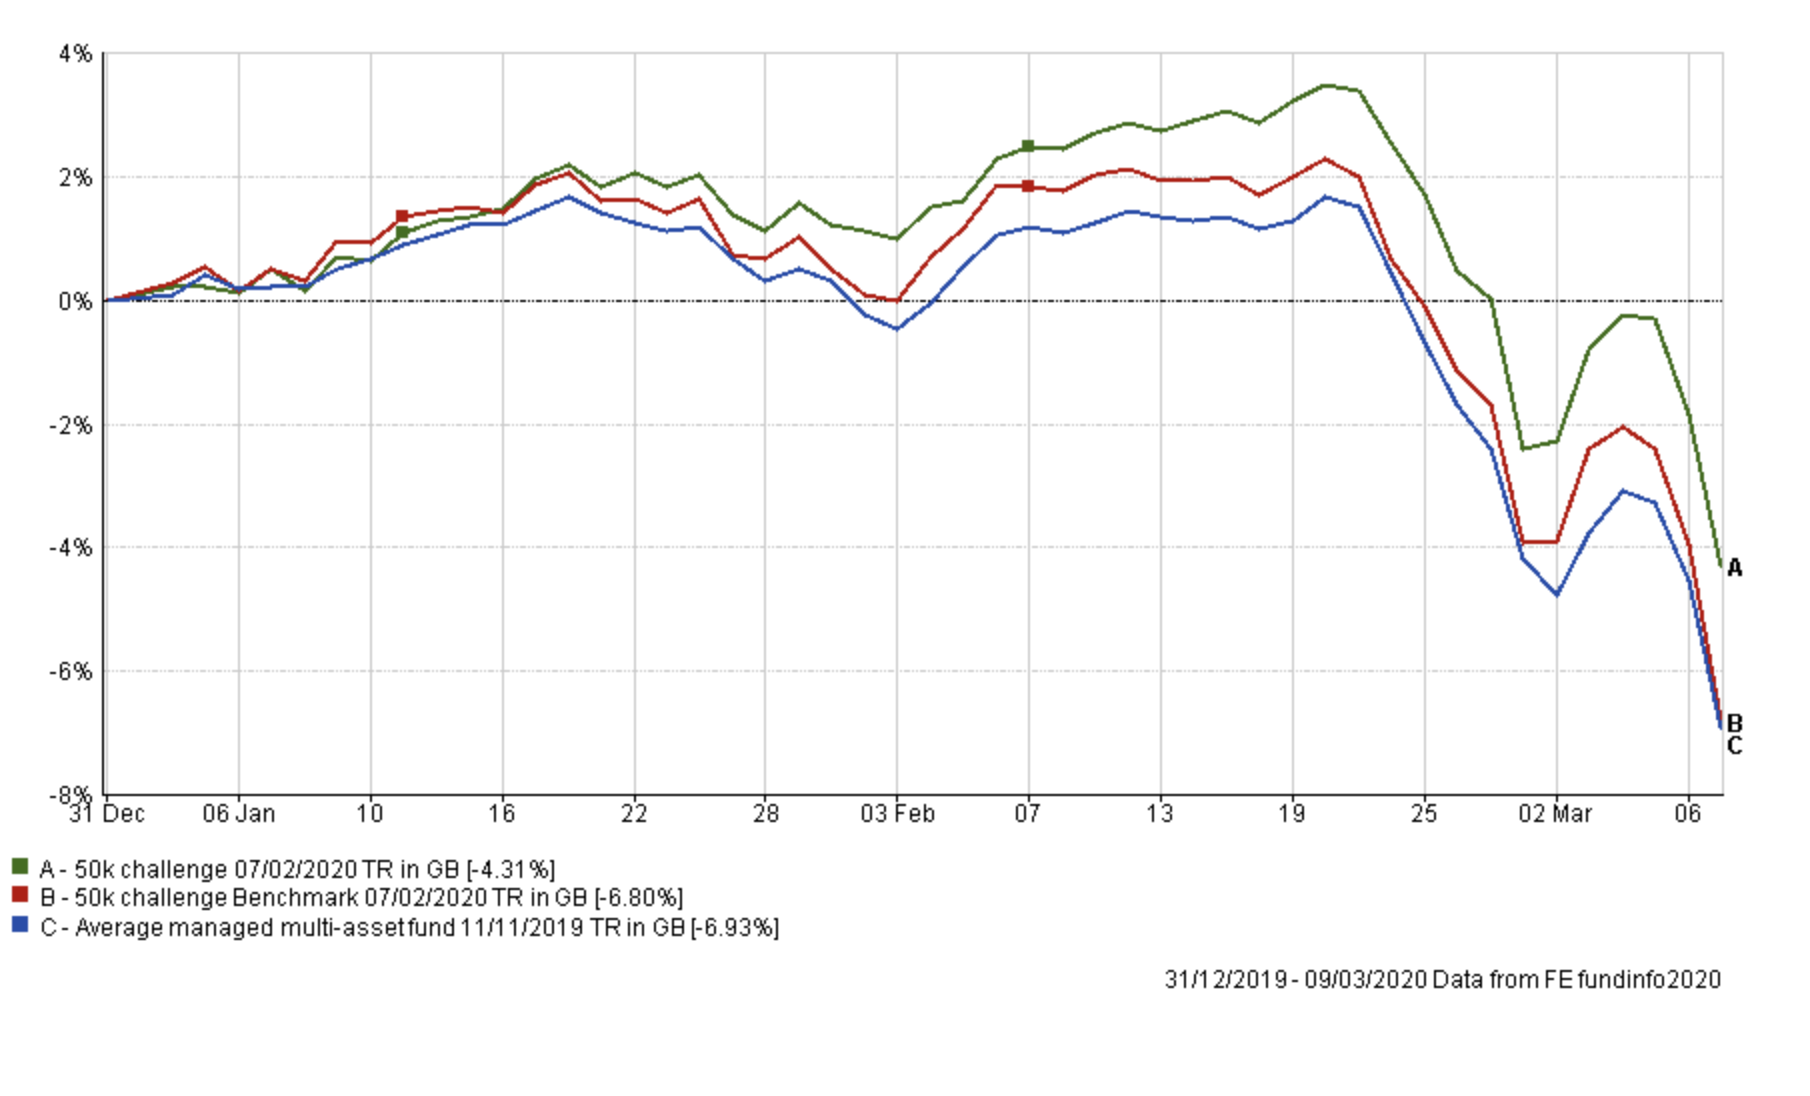
Last month I made a number of changes to my portfolio to reduce my European and Japanese equity exposure in favour of bonds and UK equities. If you look at the year to date performance of my portfolio versus its benchmarks, reducing my equity exposure has paid off.
Obviously I am pleased with this given how the coronavirus has knocked equity markets for six and concerns over a global recession have regained prominence. By comparison, over the same period, Vanguard LifeStrategy 60% Equity fund fell -7.27%. I only mention the Vanguard fund, not because I think it is a valid comparison but because in previous Chatterbox's I was questioned by some members about its performance against my portfolio's performance. I stressed the difference between the two's equity allocations but also the importance of risk management to the 80-20 Investor process. The difference in returns illustrates my point.
As shown above, my portfolio sits on a loss year to date of 4.31%, outperforming 91% of funds within the Mixed Investment 40-85% Share sector (where the average return has been -8.28% year to date). Don't forget that my loss of 4.31% year to date includes the worst week since the financial crisis as well as the worst individual day for stock markets 2008, which was yesterday when stock markets tumbled more than 7%. Of course, within my portfolio there has been a range of returns as shown below:
| Fund | Year to date performance % |
| Liontrust Sustainable Future Corporate Bond | 1.67 |
| VT Gravis Clean Energy Income | 0.8 |
| Janus Henderson Fixed Interest Monthly Income | 0.55 |
| ASI Emerging Markets Bond | -1.59 |
| BNY Mellon Real Return | -2.3 |
| ASI Global Real Estate Share | -5.32 |
| M&G Global Listed Infrastructure | -6.13 |
| Premier Diversified Growth | -7.65 |
| ASI UK Real Estate Share | -7.84 |
| Fidelity European | -10.97 |
| Jupiter Japan Income | -13.1 |
| Slater Growth | -14.03 |
To give this some context, the table below shows the price moves of key stock market indices year to date. My portfolio's defensive focus (of utilities and REITs) has helped it outperform its professionally managed peers so far, but obviously funds with equity exposure have still lost money (and that includes REITs and Utilities). For example with the FTSE 100 down over 20% year to date the -7.84% loss by the ASI UK Real Estate Share fund looks good in comparison. In market conditions such as these, it's about trying to limit your losses.
| Index | Year to date performance % |
| MSCI AC Asia ex Japan | -9.39 |
| MSCI Emerging Markets | -11.79 |
| S&P 500 | -14.99 |
| MSCI ACWI | -15.29 |
| Nikkei 225 | -16.73 |
| FTSE Eurofirst 300 | -18.49 |
| FTSE 100 | -20.9 |
You can also see that the Jupiter Japan Income fund and the Slater Growth fund have been the biggest underperformers in my portfolio, reflecting the moves in the Nikkei 225 and FTSE 100, although not exactly mirroring them, fortunately.
Focusing back on the 80-20 Investor process, the table below shows which funds within my portfolio are in the current BOTB or BFBS tables and which are not. Those funds in green are still in the BOTB while those in yellow are not in the BOTB but remain in the BFBS list. Meanwhile, any funds in red have dropped out of both shortlists.
| Name | Allocation % (rounded) | Risk | Sector | ISIN Code |
| ASI Emerging Markets Bond | 5 | Low | Global Emerging Markets Bond | GB00B5L9HN22 |
| ASI Global Real Estate Share | 3.5 | High | Property Other | GB00B7MR5W47 |
| BNY Mellon Real Return | 11 | Low | Targeted Absolute Return | GB0001642635 |
| Fidelity European | 5 | Medium | Europe Excluding UK | GB00BFRT3504 |
| Janus Henderson Fixed Interest Monthly Income | 16 | Low | Sterling Strategic Bond | GB0001920486 |
| Jupiter Japan Income | 6 | Medium | Japan | GB00B0HZTZ55 |
| M&G Global Listed Infrastructure | 7 | Medium | Global | GB00BF00R928 |
| Slater Growth | 10 | Medium | UK All Companies | GB00B0706C66 |
| VT Gravis Clean Energy Income | 14 | Medium | Global | GB00BFN4H792 |
| ASI UK Real Estate Share | 5.5 | High | Property Other | GB00B0XWNN66 |
| Liontrust Sustainable Future Corporate Bond | 8 | Low | Sterling Corporate Bond | GB0030029069 |
| Premier Diversified Growth | 9 | Medium | Mixed Investment 40-85% Shares | GB00B8BJV423 |
As you can see, a number of funds have fallen out of the 80-20 Investor tables and are marked in red. Interestingly the asset mix of the BOTB has moved to almost exactly mirror the asset mix of my £50k portfolio. The only difference is that the new BOTB does not have any Japanese equity exposure, instead favouring UK gilts. Given how volatile equity markets are right now (the FTSE was down 8% at one point yesterday) then it would be unwise to make any wholesale changes to funds with equity exposure. Indeed, with the VIX (the market fear gauge) closing at 54 yesterday it means that the expected average daily move for the US stock market is currently 3% (up or down) and the average monthly move is 20%. A 3% daily move is something that usually happens less than once a year. This level of the VIX now suggests it could be the typical daily move, at least in the short term. The point is that markets could easily move against you when trading unit trusts.
In any event, given the performance of my portfolio so far during this sell-off, there is no need to panic. For now my portfolio is weathering the oil price shock (the price of oil fell 30% yesterday) which has been causing havoc with professionally managed multi-asset funds. As I mentioned, the BOTB introduced UK Gilt exposure back in February. In hindsight, I should have done the same thing. Ordinarily, I would now probably look to reduce my Japanese equity exposure further in favour of UK Gilts, much in the same way that the BOTB has done over time. However, the extreme equity market volatility means that it would probably be ill-advised to tamper with the equity content of the portfolio.
If you look at the performance of my low-risk holdings since the market sell-off which started mid-February, it's been a little disappointing
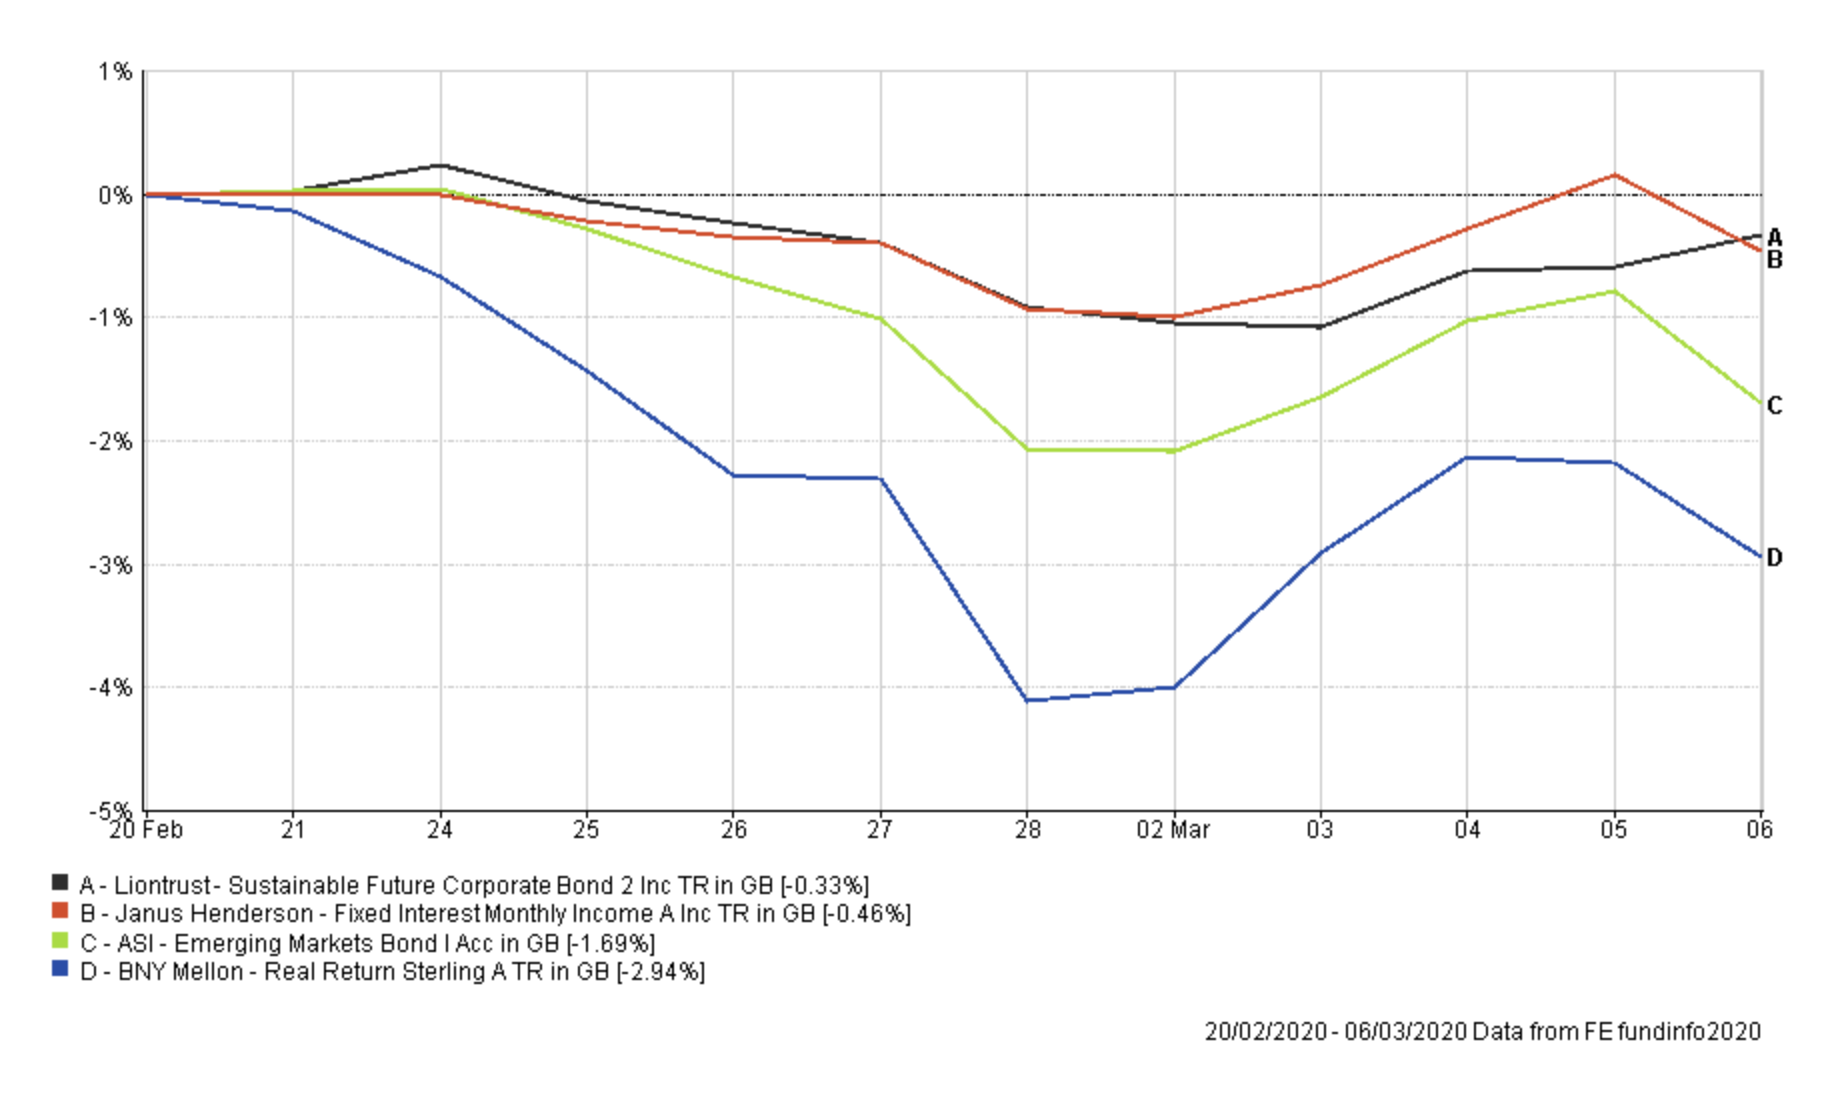
Contrast that with the Royal London UK Government Bond fund from this month's BOTB which is up 4.07% as at 6th March. The Janus Henderson fund makes up 17% of my portfolio but has been out of the BOTB and BFBS tables for some time. Ideally, I would like to have seen the fund make a positive contribution during the market sell-off given its dominance in my portfolio, but the recent poor performance of high-yielding corporate bonds (as recession fears increase) has hampered the fund's performance.
So I have decided to reduce my exposure to the Janus fund in favour of some UK gilt exposure, just to diversify my fixed income holdings. Of course, this does increase the portfolio's overall risk dynamic as UK gilt funds are usually medium or high risk, as opposed to low risk like those funds shown in the chart above.
Fund switch
33.3% out of the Janus Henderson Fixed Interest Monthly Income and 100% into Royal London UK Government Bond
The reason why I favoured the Royal London fund over other gilt funds within the BOTB or BFBS tables is its smaller Max weekly fall figure. By altering my bond exposure rather than my equity exposure, in order to introduce UK gilts into my portfolio, I limit the chance that the market can move against me. As you can see from the chart above the Janus fund has largely flatlined of late and isn't very volatile. Interestingly the overall impact on my portfolio will not be too dissimilar to if I had reduced my Japanese equity holdings slightly in favour of UK gilts. The asset mix would have been different but the backtested performance over recent months is approximately the same.
My portfolio now looks like this:
| Name | Allocation % (rounded) | Risk | Sector | ISIN Code |
| ASI Emerging Markets Bond | 5 | Low | Global Emerging Markets Bond | GB00B5L9HN22 |
| ASI Global Real Estate Share | 3.5 | High | Property Other |
GB00B7MR5W47
|
| BNY Mellon Real Return | 11.5 | Low | Targeted Absolute Return | GB0001642635 |
| Fidelity European | 4.5 | Medium | Europe Excluding UK | GB00BFRT3504 |
| Janus Henderson Fixed Interest Monthly Income | 11 | Low | Sterling Strategic Bond | GB0001920486 |
| Jupiter Japan Income | 5.5 | High | Japan | GB00B0HZTZ55 |
| M&G Global Listed Infrastructure | 7 | Medium | Global | GB00BF00R928 |
| Slater Growth | 9 | Medium | UK All Companies | GB00B0706C66 |
| VT Gravis Clean Energy Income | 14.5 | Medium | Global | GB00BFN4H792 |
| ASI UK Real Estate Share | 5.5 | High | Property Other |
GB00B0XWNN66
|
| Liontrust Sustainable Future Corporate Bond | 8 | Low | Sterling Corporate Bond | GB0030029069 |
| Premier Diversified Growth | 9 | Medium | Mixed Investment 40-85% Shares | GB00B8BJV423 |
| Royal London UK Government Bond | 6 | Medium | UK Gilts | GB00B881TW52 |
My Portfolio asset mix
My portfolio asset mix is as shown below (the previous asset mix is in brackets) with approximately 57% invested in equities:
-
- UK Equities 17% (17%)
- North American Equities 11% (11%)
- Global Fixed Interest 15% (17%)
- Japanese Equities 5% (6%)
- European Equities 9% (9%)
- UK Fixed Interest 6% (6%)
- UK Gilt 5% (0%)
- Cash 0% (4%)
- Alternative Investment Strategies 13% (12%) (including absolute return)
- Emerging Market Fixed Interest 4% (4%)
- Commodities and energy 6% (5%)
- Property 9% (9%)
Damien's higher risk and lower risk portfolios
Using the logic described in my post: Update to Damien’s alternative risk portfolios I created hypothetical higher and lower risk versions of my portfolio below:
Higher risk
| Fund | Allocation % |
| ASI Global Real Estate Share | 5 |
| Fidelity European | 7 |
| Jupiter Japan Income | 9 |
| M&G Global Listed Infrastructure | 11 |
| Slater Growth | 14 |
| VT Gravis Clean Energy Income | 22 |
| ASI UK Real Estate Share | 9 |
| Premier Diversified Growth | 14 |
| Royal London UK Government Bond | 9 |
Lower risk
| Fund | Allocation % |
| ASI Emerging Markets Bond | 6 |
| BNY Mellon Real Return | 13 |
| Fidelity European | 5 |
| Janus Henderson Fixed Interest Monthly Income | 13 |
| M&G Global Listed Infrastructure | 8 |
| Slater Growth | 11 |
| VT Gravis Clean Energy Income | 17 |
| Liontrust Sustainable Future Corporate Bond | 9 |
| Premier Diversified Growth | 11 |
| Royal London UK Government Bond | 7 |

£200 Pension Cashback Offer
Make a qualifying deposit or transfer a pension to our partner Interactive Investor.
- Deposit or transfer a pension of at least £20k and you could earn £200 cashback
- Terms and Fees apply, Capital at risk
- New & Existing customers opening a SIPP
- Offer ends 31st July 2026
Before starting your transfer, check you won't lose any valuable benefits (such as guaranteed annuity rates or a lower protected pension age) and find out what exit fees you might have to pay
