

The background to my portfolio
Back in March 2015 I decided to invest £50,000 of my own money using 80-20 Investor. The purpose was twofold, firstly to show how you can use 80-20 Investor to invest and outperform the market with only a few minutes effort every now and then. Secondly, no other investment commentator, journalist or research provider invests their own money for fear of failing. This is a sorry state of affairs and is precisely why I committed to openly running my own portfolio for 80-20 Investor members to see.
Since then I have periodically changed my portfolio using the fund suggestions provided by the 80-20 Investor algorithm and associated research. I always disclose the changes at the time they are made.
Performance update
As is usual in my portfolio reviews, the chart below shows how my portfolio has outperformed since I started the challenge in March 2015, four years ago. The green line is the performance of my portfolio while the red line is the benchmark showing the average return achieved by professional fund managers given the same asset mix. To accurately calculate this I have used the average return for each sector in which my portfolio invested. The blue line shows what the average multi-asset fund with comparable equity content achieved. In other words, the red line would show the extra performance added by just the asset mix of my portfolio (where I was invested i.e European equities etc) over picking a typical multi-asset fund (the blue line). While the green line (which is my actual performance) shows the impact of being in the right funds at the right time, as identified by the 80-20 Investor algorithm.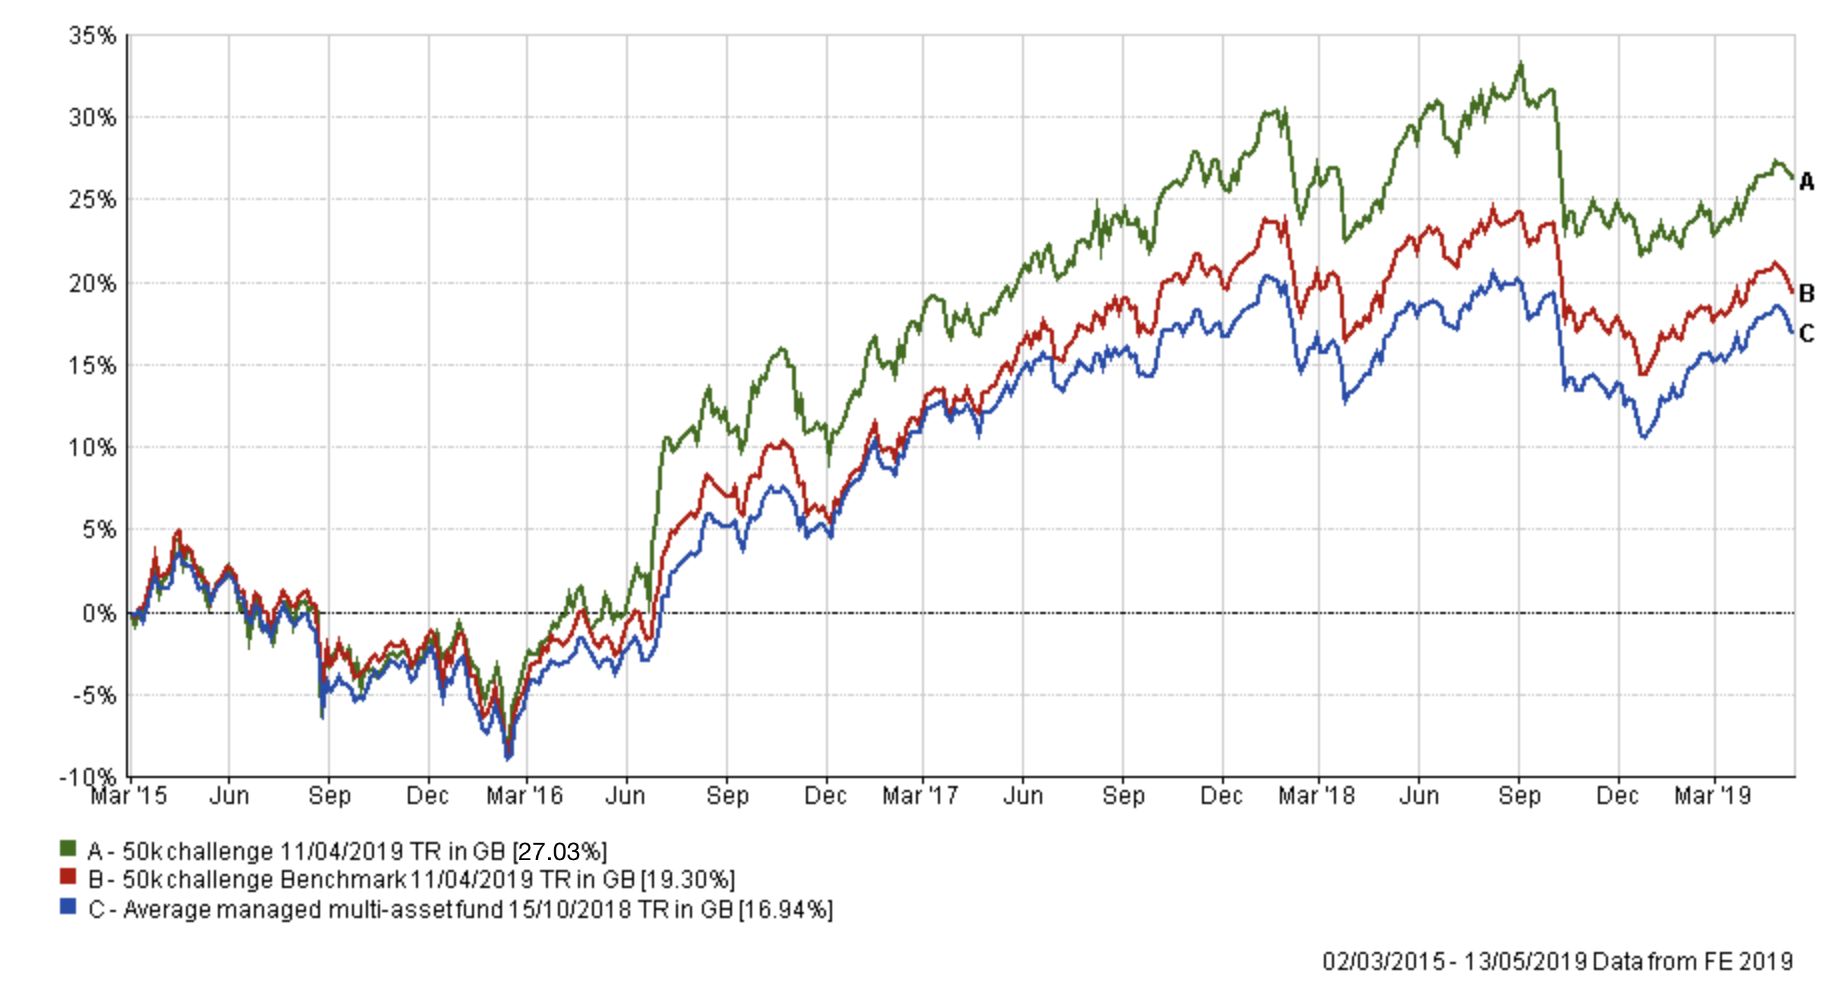
The last two weeks have brilliantly demonstrated the power of sticking to an investment process. Almost every investment commentator out there whether in print or on TV was banging the bullish drum right up until the end of April. Seemingly, 'the sky's the limit' was their sole view. The equity bulls who had been licking their wounds at the bottom of the market on 24th December were now singing from the rafters about how clever they were and that they had predicted a historic rebound back towards all-time highs (even though they actually didn't). Meanwhile, the bears who had been gloating back in December had either gone back into hiding, changed their tune or distanced themselves completely from their previous bearish predictions.
All of this noise is to the detriment of DIY investors who end up not knowing who to believe and just end up chasing their tails and losing money. I described in last week's newsletter, Donald Trump broadsided the market on 5th May by suddenly escalating the US-China trade war, which caught those chasing the rally out as equities then slumped. Since then the S&P 500, for example, has fallen over 4% in a matter of days and we've seen even bigger pullbacks in other global equity markets.
If you look at the chart above, you will see that my portfolio has extended its lead over its benchmarks by almost 2%, as a result. While my portfolio has made a profit since my last review, despite the market sell-off, the benchmarks have both lost money while the FTSE 100, just to give some context, has fallen -3.37%.
The first four months of 2019 have produced one of the best new year equity rallies on record and it's been an uncomfortable period to remain erring on the side of caution, as my portfolio has. The temptation is to break from the process and chase returns. If stock markets continue to new highs then, of course the 80-20 Investor algorithm's BOTB shortlist will eventually reflect this. Longtime 80-20 Investor members will know that I tend to use the asset allocation of the BOTB as a basis for my £50k portfolio to produce a medium risk portfolio that is well diversified. As that is my aim for this portfolio I will continue to stick with the process despite where the commentators claim the market is going. Ultimately no one knows whether the market will head higher or sink. Plenty of 80-20 Investor members want to take more risk as they appreciate the risk/return dynamics and many have enjoyed the equity rally so far this year. Of course, with that comes greater risk. But they are still applying a process of selecting funds and not just blindly listening to bullish investment commentators.
The chart below shows my portfolio's return versus that of the average professionally managed fund within the Mixed Investment 40-85% Shares sector and the Mixed Investment 20-60% Shares sector. You can see that at the December low my portfolio was hammering the professionals. In fact at that point, my portfolio was outperforming 90% of the funds within the aforementioned sectors over the entire 3 and a half year period, which was a result of the 80-20 Investor process and applying the brakes after the initial market sell-off.
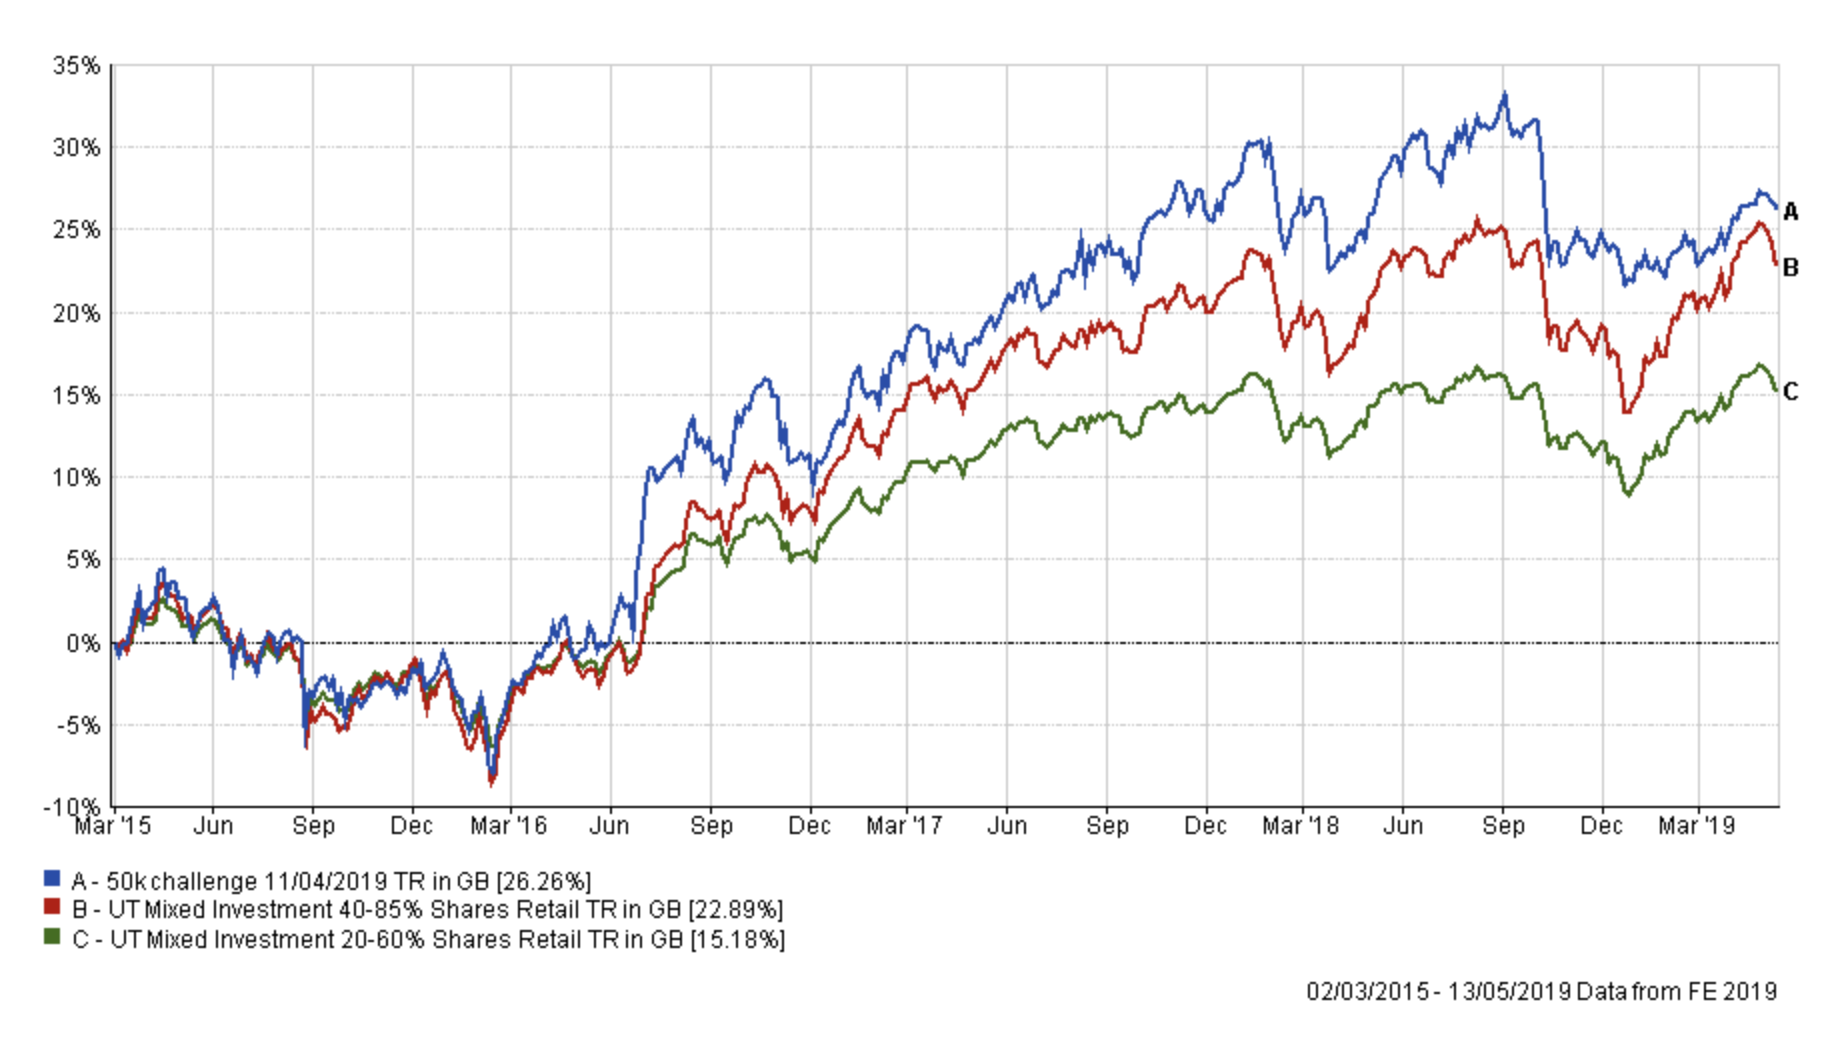
Of course there is an argument that once I'd applied the brakes that a comparison with the Mixed 40-85% sector was no longer valid as I had less than 40% equity exposure at times. That remained the case at the start of the year, as equity markets rebounded. Eventually, my portfolio increased its equity exposure to nearer 40%, but still well below the 85% level of most funds within the Mixed Investment 40-85% Shares sector. For that reason, I have also included the Mixed Investment 20-60% Shares sector in the chart (the green line) because my portfolio currently lies between the two in terms of its equity exposure. Of all three portfolios shown I know which I'd rather own right now.
Interestingly the table below shows how each of the funds within my portfolio has performed since the Trump trade tantrum in absolute terms and where they rank within their sectors over that period. So for example, the BMO Pacific Equity fund lost -3.68% but is ranked 8th out of the 52 funds within the same sector over that period. The overall theme is that defensives have outperformed alongside fixed income (gilts) and utilities (to which M&G Global Listed Infrastructure has significant exposure).
| Name | Sector | Total return during Trump tantrum | Rank | Total funds in sector |
| Newton Real Return | Targeted Absolute Return Retail | -0.11 | 28 | 71 |
| LF Seneca Diversified Income | Mixed Investment 20-60% Shares Retail | -0.67 | 35 | 182 |
| BMO Pacific Equity | Asia Pacific Excluding Japan Retail | -3.68 | 8 | 52 |
| Aberdeen Emerging Markets Bond | Global Emerging Markets Bond Retail | -0.29 | 11 | 12 |
| Fidelity Global Enhanced Income | Global Equity Income Retail | -1.51 | 7 | 46 |
| JPM Emerging Markets Income | Global Emerging Markets Retail | -4.06 | 12 | 47 |
| M&G Global Listed Infrastructure | Global Retail | 0.62 | 1 | 194 |
| Fidelity Global Property | Property Other Retail | -1.24 | 18 | 19 |
| Janus Henderson Fixed Interest Monthly Income | Sterling Strategic Bond Retail | -0.14 | 41 | 72 |
| HSBC UK Gilt Index | UK Gilts Retail | 0.56 | 17 | 26 |
| BlackRock European Absolute Alpha | Targeted Absolute Return | 0.7 | 4 | 85 |
Right now I can not predict with absolute certainty whether the market is about to bounce higher or continue to fall. The market may resume its uptrend or even hit all-time highs but as I've been discussing in recent months it's sensible to be aware of the downside risks. So to avoid emotional decisions during turbulent markets I will continue to apply a process (also read my article 'The power of process in turbulent markets').
So applying the process as usual, the table below shows my portfolio's current allocation, with those funds in green still in the BOTB while those in yellow are not in the BOTB but remain in the BFBS list. Meanwhile, any funds in red have dropped out of both shortlists.
| Fund | Allocation % | Risk | Sector | ISIN Code |
| BlackRock European Absolute Alpha | 8 | Low | Targeted Absolute Return | GB00B4Y62W78 |
| BMO Pacific Equity | 3 | High | Asia Pacific Excluding Japan | GB0033143115 |
| Fidelity Global Enhanced Income | 5 | Medium | Global Equity Income | GB00BD1NLJ41 |
| Fidelity Global Property | 11 | High | Property Other | GB00B7K2NZ09 |
| JPM Emerging Markets Income | 12 | High | Global Emerging Markets | GB00B56DF680 |
| LF Seneca Diversified Income | 10 | Low | Mixed Investment 20-60% Shares R | GB00B7JTF560 |
| M&G Global Listed Infrastructure | 13 | Medium | Global | GB00BF00R928 |
| HSBC UK Gilt Index | 7 | Low | UK Gilts | GB00B4581C50 |
| Janus Henderson Fixed Interest Monthly Income | 10 | Low | Sterling Strategic Bond | GB0001920486 |
| Newton Real Return | 7 | Low | Targeted Absolute Return | GB0001642635 |
| Aberdeen Emerging Markets Bond | 7 | Medium | Global Emerging Markets Bond | GB00B5L9HN22 |
| Cash | 7 | Low | N/A | N/A |
Last month I made a number of fund changes. You will recall that JPM Emerging Markets Income was given a stay of execution as it has performed strongly in the month leading up to the last review. Its performance has remained strong, especially if you look at its performance rank, in the earlier chart, since the Trump tantrum. Emerging markets (EM) are likely to come under increasing pressure if the trade war escalates and for now the fund's more defensive nature (income funds tend to be more defensive than their non-income peers) stands it in better stead. Almost exactly the same could be said for the BMO fund which unusually favours Indian equities over Chinese equities which has sheltered the fund, so far, from the worst of the trade war backlash the latter market has endured.
The rise in market angst has seen a number of funds that had either just slipped out of the BFBS lists return. It means that aside from the two funds mentioned there is no desperate need to alter my portfolio right now. In addition, the asset mix of my portfolio still remains broadly in line with that of the BOTB, albeit with marginally less equity exposure.
In any event, market volatility is also at levels not seen since the start of the year which means that the market could easily move against me during any potential fund switches. Right now there is no way to gauge whether the US-China trade war will escalate or be resolved but, as the charts above have shown, my portfolio is well positioned to weather any storm. For now at least, it's time do nothing to see how the market trend develops.
My portfolio
My portfolio remains:
| Fund | Allocation % | Risk | Sector | ISIN Code |
| BlackRock European Absolute Alpha | 8 | Low | Targeted Absolute Return | GB00B4Y62W78 |
| BMO Pacific Equity | 3 | High | Asia Pacific Excluding Japan | GB0033143115 |
| Fidelity Global Enhanced Income | 5 | Medium | Global Equity Income | GB00BD1NLJ41 |
| Fidelity Global Property | 11 | High | Property Other | GB00B7K2NZ09 |
| JPM Emerging Markets Income | 12 | High | Global Emerging Markets | GB00B56DF680 |
| LF Seneca Diversified Income | 10 | Low | Mixed Investment 20-60% Shares R | GB00B7JTF560 |
| M&G Global Listed Infrastructure | 13 | Medium | Global | GB00BF00R928 |
| HSBC UK Gilt Index | 7 | Low | UK Gilts | GB00B4581C50 |
| Janus Henderson Fixed Interest Monthly Income | 10 | Low | Sterling Strategic Bond | GB0001920486 |
| Newton Real Return | 7 | Low | Targeted Absolute Return | GB0001642635 |
| Aberdeen Emerging Markets Bond | 7 | Medium | Global Emerging Markets Bond | GB00B5L9HN22 |
| Cash | 7 | Low | N/A | N/A |
My asset mix
This means my asset mix is as follows (previous asset mix is in brackets):
-
- UK Equities 5% (9%)
- North American Equities 9% (6%)
- Global Fixed Interest 11% (25%)
- Japanese Equities 0% (0%)
- Other International Equities 0% (2%)
- Emerging market equities 11% (11%)
- European Equities 4% (3%)
- UK Fixed Interest 0% (0%)
- Cash 10% (13%)
- Alternative Investment Strategies 22% (20%) (including absolute return)
- Emerging Market Fixed Interest 7% (0%)
- Gilts 7% (0%)
- Asian equities 3% (0%)
- Property 11% (11%) - most of which is equities in the US.
Damien's higher risk and low risk portfolios
Using the logic described in my post New: Damien’s Higher Risk Portfolio I had created higher and lower risk versions of my portfolio by popular demand. However, after the October 2018 sell-off I temporarily stopped producing them for the reasons explained in October's Chatterbox. But now the timing is appropriate to bring them back
Higher risk
| Fund | Allocation |
| Fidelity Global Property | 22 |
| M&G Global Listed Infrastructure | 25 |
| JPM Emerging Markets Income | 23 |
| Fidelity Global Enhanced Income | 10 |
| BMO Pacific Equity | 6 |
| Aberdeen Emerging Markets Bond | 14 |
Lower risk
| Fund | Allocation |
| BlackRock European Absolute Alpha | 11 |
| Cash | 9 |
| Newton Real Return | 9 |
| M&G Global Listed Infrastructure | 18 |
| LF Seneca Diversified Income | 14 |
| Fidelity Global Enhanced Income | 7 |
| HSBC UK Gilt Index | 9 |
| Janus Henderson Fixed Interest Monthly Income | 14 |
| Aberdeen Emerging Markets Bond | 9 |

£200 Pension Cashback Offer
Make a qualifying deposit or transfer a pension to our partner Interactive Investor.
- Deposit or transfer a pension of at least £20k and you could earn £200 cashback
- Terms and Fees apply, Capital at risk
- New & Existing customers opening a SIPP
- Offer ends 31st July 2026
Before starting your transfer, check you won't lose any valuable benefits (such as guaranteed annuity rates or a lower protected pension age) and find out what exit fees you might have to pay
