

The background to my portfolio
Back in March 2015 I decided to invest £50,000 of my own money using 80-20 Investor. The purpose was twofold, firstly to show how you can use 80-20 Investor to invest and outperform the market with only a few minutes effort every now and then. Secondly, no other investment commentator, journalist or research provider invests their own money for fear of failing. This is a sorry state of affairs and is precisely why I committed to openly running my own portfolio for 80-20 Investor members to see.
Since then I have periodically changed my portfolio using the fund suggestions provided by the 80-20 Investor algorithm and associated research. I always disclose the changes at the time they are made.
Performance update
As is usual in my portfolio reviews, the chart below shows how my portfolio has outperformed since I started the challenge in March 2015, four and a half years ago. The green line is the performance of my portfolio while the red line is the benchmark showing the average return achieved by professional fund managers given the same asset mix. To accurately calculate this I have used the average return for each sector in which my portfolio invested. The blue line shows what the average multi-asset fund with comparable equity content achieved. In other words, the red line would show the extra performance added by just the asset mix of my portfolio (where I was invested i.e European equities etc) over picking a typical multi-asset fund (the blue line). While the green line (which is my actual performance) shows the impact of being in the right funds at the right time, as identified by the 80-20 Investor algorithm.
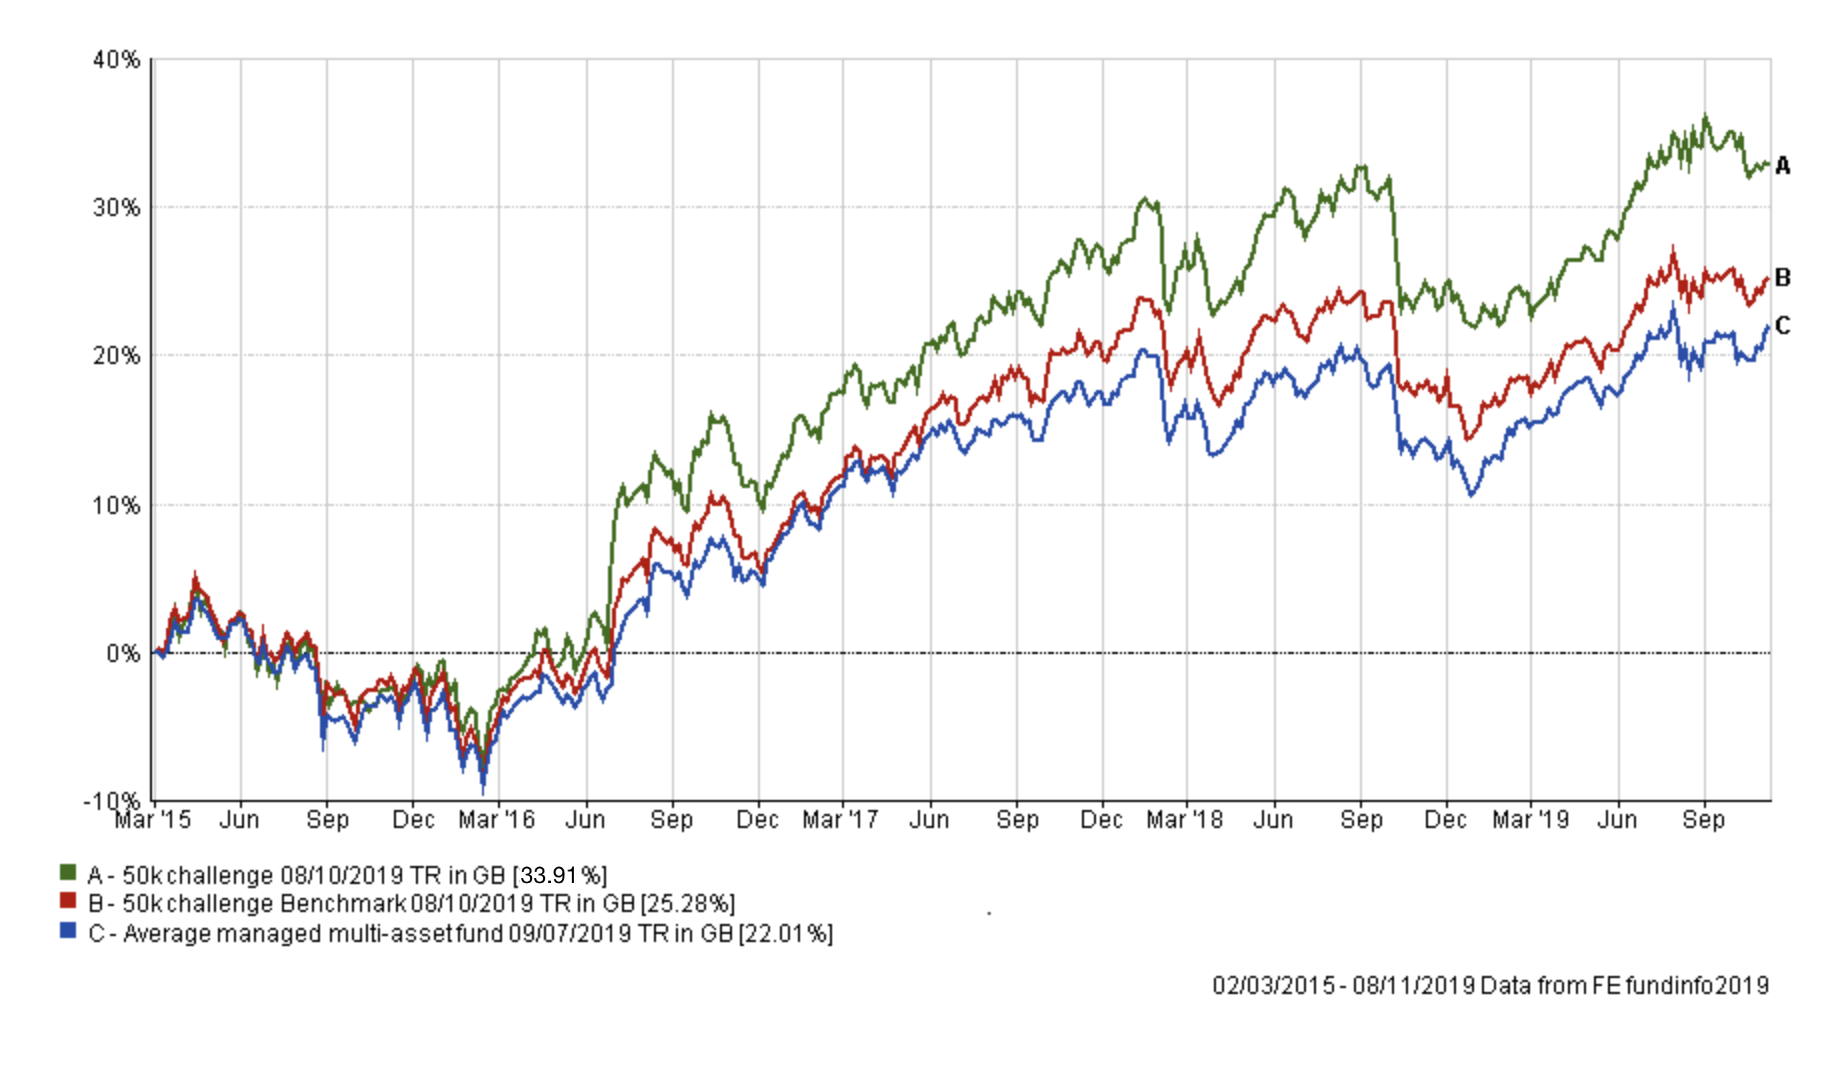
There were a couple of important lines from my portfolio review last month that are worth reminding ourselves of. They were...
"For now the market narrative is once again driving my portfolio higher. This may change again. It pays to be humble as the market has a habit of doing what you least expect or want it to."
Although it might not be abundantly clear from the chart above, if we focus just on the performance of my portfolio since the last review (almost exactly a month ago) markets did indeed move against me. The chart below shows the performance of my portfolio versus my benchmarks over the last month:
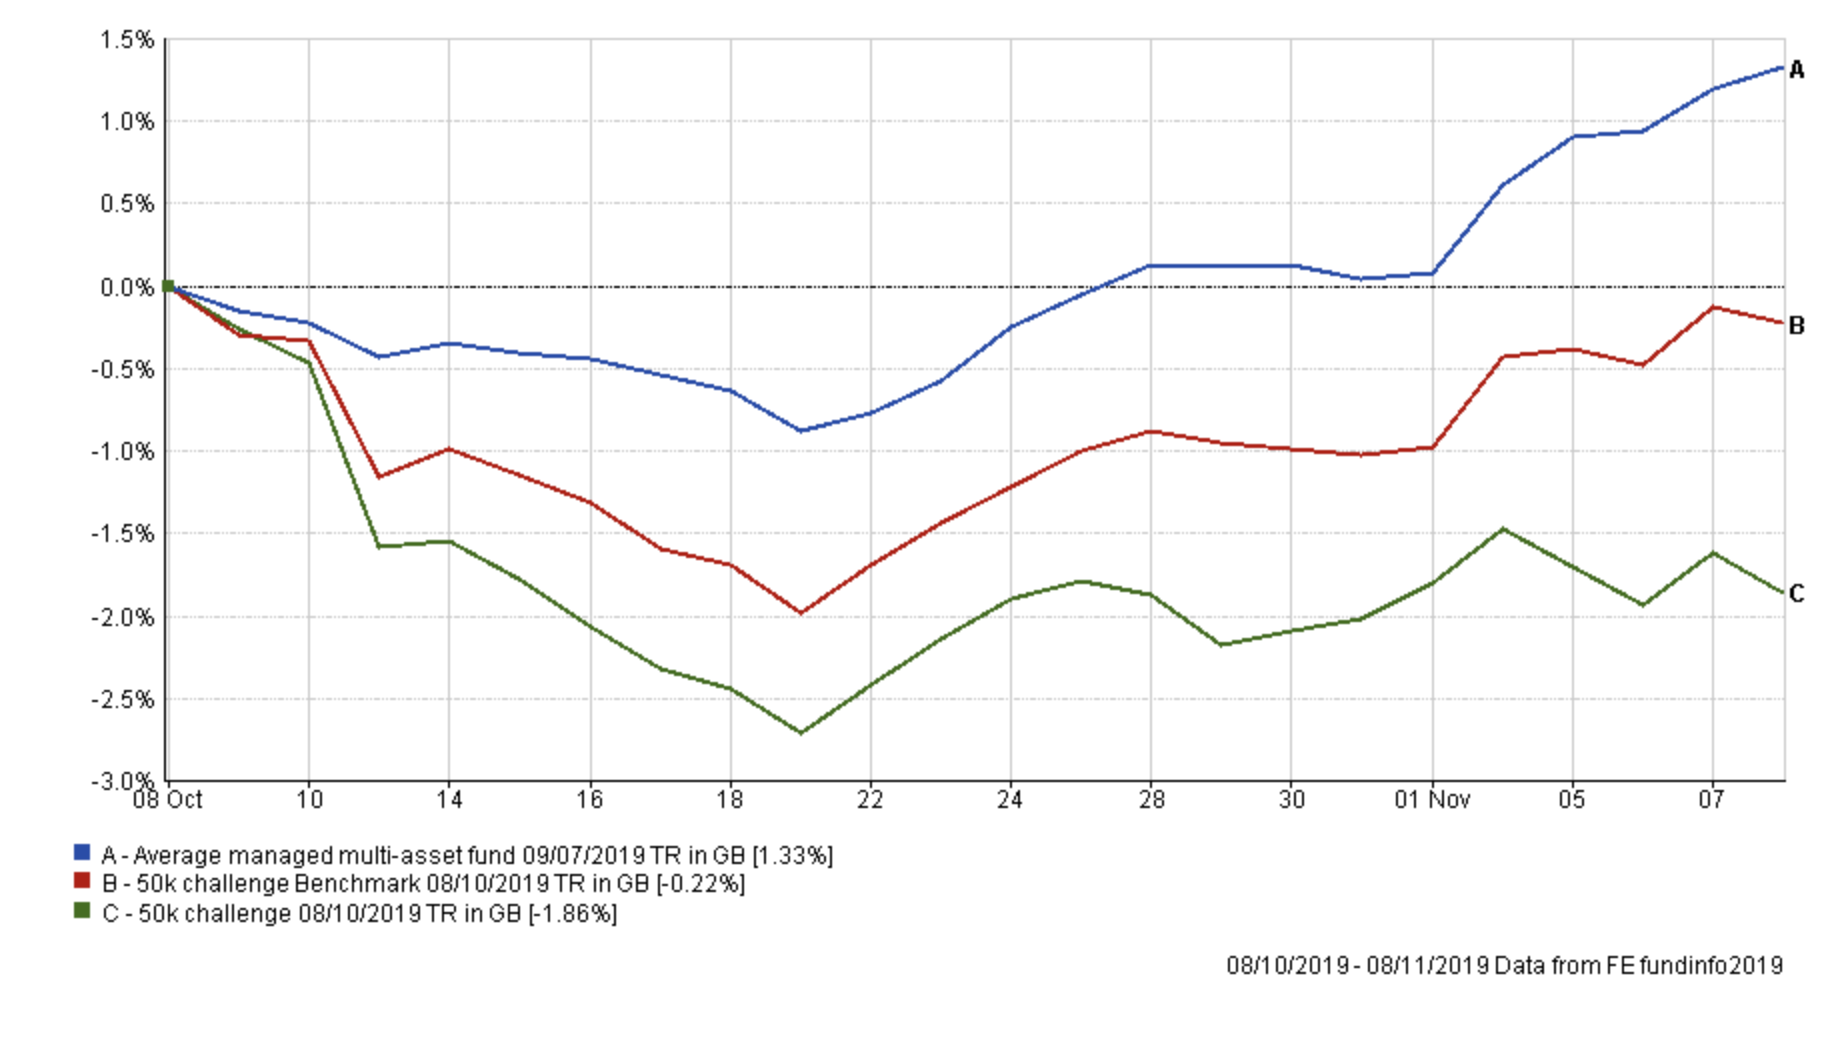
The key takeaway is that my portfolio fell between 9th October and the 21st October, more so compared to its benchmarks, when the pound rallied 5% against the dollar and 4% against the euro. Then if you look at the first week of November my portfolio flatlined while the other benchmarks rose. During this period optimism surrounding a possible US-China trade deal rose rapidly causing REITs and utilities to underperform. I explain the impact of this on my portfolio in more detail later in the section titled 'fund switches'.
Of course, my portfolio has benefited greatly from its asset mix over the course of the summer. If you recall my portfolio avoided the two key stock market falls in May and August (and actually made money when professionally managed portfolios mostly didn't) due to its exposure to gilts, REITs and utilities. However, over the last two months the momentum of funds within my portfolio exposed to these assets/sectors has started to slow. It is by no means disastrous but there are signs that the economic cycle may be moving on and the assets that benefit could be in a state of flux.
The point is that my portfolio's asset mix (global overseas exposure and gilts) meant that the portfolio struggled when the pound rallied while the individual funds themselves (with exposure to defensive US equity sectors) started to drag on the portfolio's performance. So it's timely that I am reviewing my portfolio now.
If we apply the process as usual, the table below shows my portfolio's current allocation, with those funds in green still in the BOTB while those in yellow are not in the BOTB but remain in the BFBS list. Meanwhile, any funds in red have dropped out of both shortlists.
| Fund | Allocation % | Risk | Sector | ISIN Code |
| Fidelity Global Enhanced Income | 5 | Medium | Global Equity Income | GB00BD1NLJ41 |
| Fidelity Global Property | 12 | High | Property Other | GB00B7K2NZ09 |
| M&G Global Listed Infrastructure | 14 | Medium | Global | GB00BF00R928 |
| HSBC UK Gilt Index | 6 | Low | UK Gilts | GB00B4581C50 |
| Janus Henderson Fixed Interest Monthly Income | 10 | Low | Sterling Strategic Bond | GB0001920486 |
| BNY Mellon Real Return | 11 | Low | Targeted Absolute Return | GB0001642635 |
| ASI Emerging Markets Bond | 9.5 | Low | Global Emerging Markets Bond | GB00B5L9HN22 |
| Vanguard LifeStrategy 20% Equity | 6 | Low | Mixed Investment 0-35% Shares | GB00B4NXY349 |
| Jupiter Japan Income | 3 | High | Japan | GB00B0HZTZ55 |
| VT Gravis Clean Energy Income | 11 | Medium | Global | GB00BFN4H792 |
| TB Evenlode Global Income | 12.5 | High | Global Equity Income | GB00BF1QMV61 |
Only one fund has fallen out of the BOTB and BFBS tables altogether, namely the Fidelity Global Property fund. However, there does seem to be signs of transition in momentum, only three funds are green, which is backed up by the latest 80-20 Investor growth heatmap.
There is no need for radical changes in the asset mix so I have tried to follow the BOTB asset mix where possible and keep changes to a minimum. If I compare the asset mix of my portfolio as it currently stands against that of the new BOTB the key differences include:
- I have more exposure to US equities
- I have less exposure to Japanese equities
- I have less exposure to UK equities
- I have less exposure to global fixed interest
- I have more exposure to global property and emerging market debt
I have tried to address all of these however I do maintain a higher emerging market debt exposure. This is because it's been one of the best performing low-risk parts of my portfolio in recent months but it also wasn't impacted by the appreciation of sterling, unlike global bond funds generally. So it remains a good diversifier for now.
Overall the aim of my fund switches is to diversify my portfolio more, take some profits and reduce my exposure to the volatility in the value of the pound. We have no idea which way the pound will move, but as my portfolio stands it would benefit from a falling pound considerably more than a rising one. The latter would, in fact, hamper my portfolio once again. This risk needs to be mitigated slightly, and become more balanced, in the face of the upcoming election and possible Brexit.
Below I have broken down each fund switch in detail with my reasonings.
Fund switches
Fund switch 1
100% out of HSBC UK GILT and 100% into Janus Henderson Fixed Interest Monthly Income.
The chart below shows the performance of the UK Gilt fund (the blue line) since I've held it against global bonds (the green line) and the Janus Henderson fund (the red line).
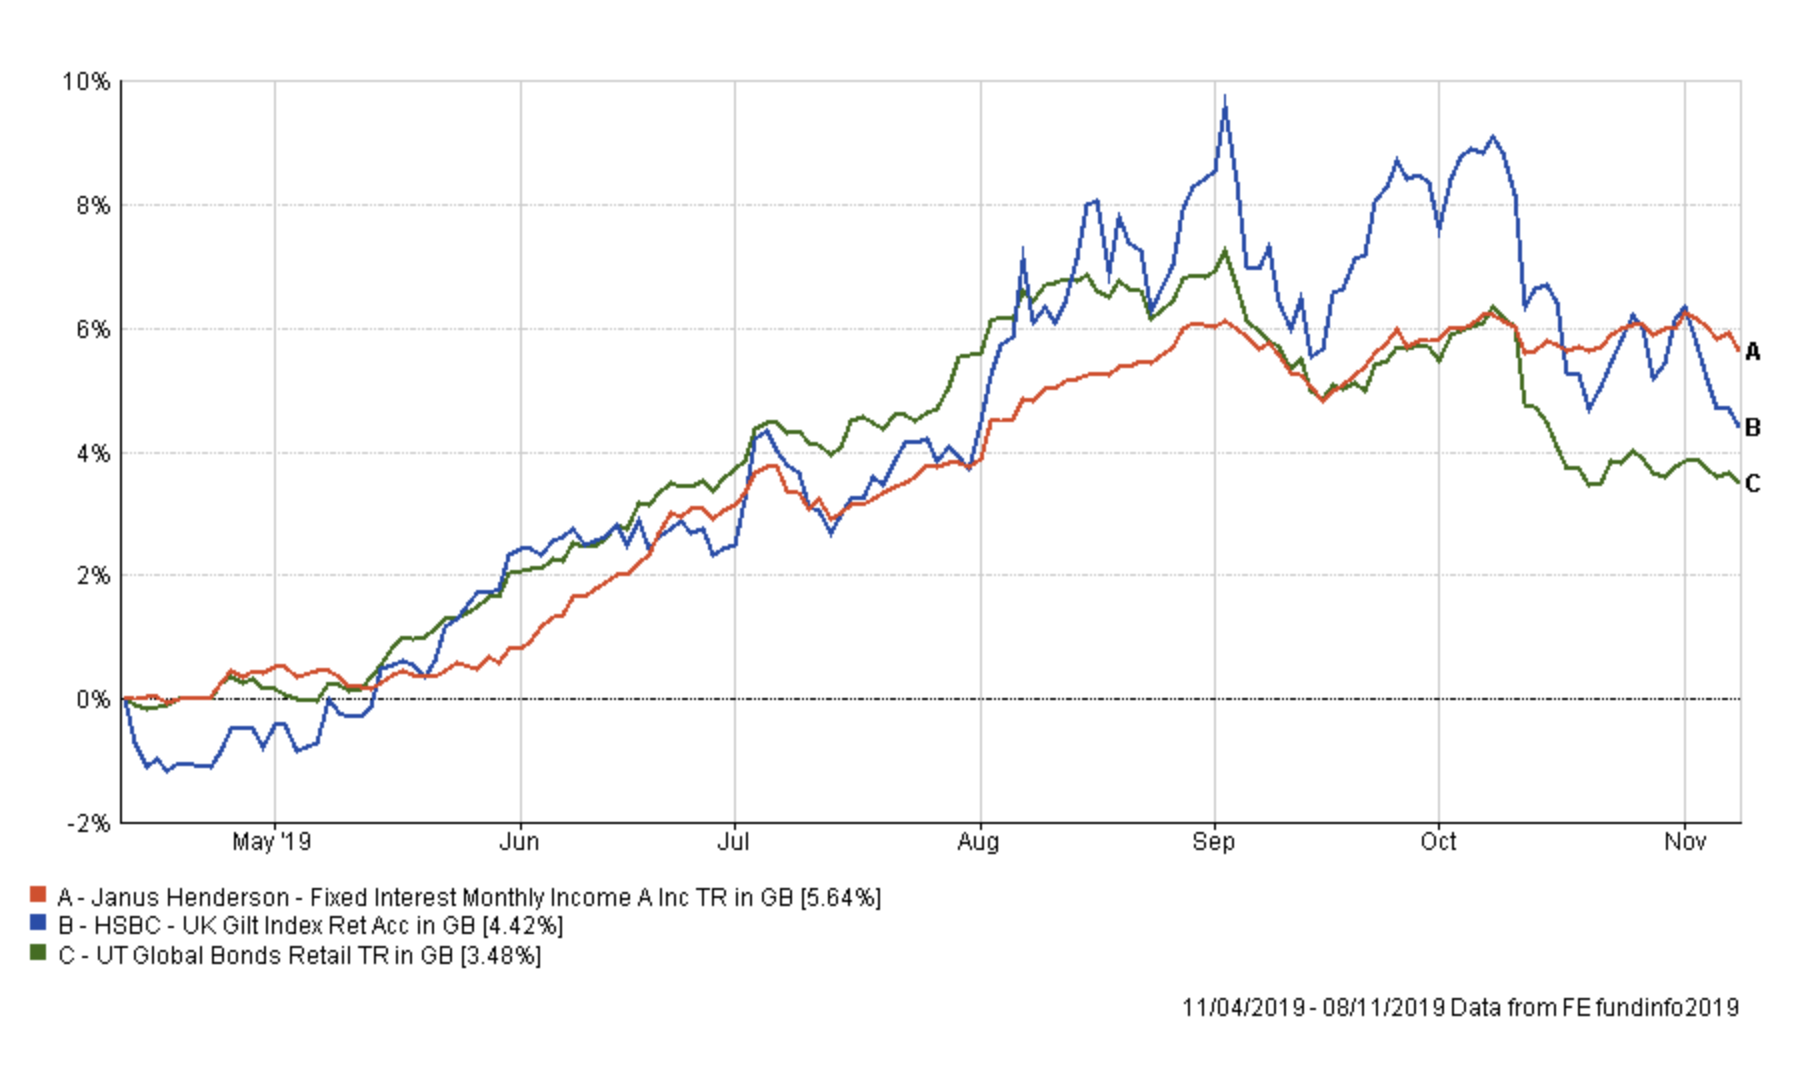
You can see that UK gilts have been a very profitable investment given their relatively low-risk profile and, up until October, they easily outperformed alternatives. However, as mentioned earlier the volatility in the value of the pound rose dramatically in October which is negative for gilts. In addition bond yields globally have risen as the market is pricing-in (hoping for) an imminent conclusion to the US-China trade war. Bond yields are just as likely to reverse course and continue their longer-term trend lower. But for now, I favour the 'boring' Janus Henderson fund. It is no longer in the BOTB but remains in the BFBS and has performed well as a bond fund. The fund also helps reduce my portfolio's overall exposure to the volatility in the value of the pound. Something that will likely prove increasingly important in the coming weeks and months ahead. Sometimes boring is good.
Fund switch 2
50% out of TB Evenlode Global Income and 100% into Jupiter Japan Income
The chart below shows the performance of TB Evenlode Global Income fund over the last six months versus its peer group. The fund experienced a terrible start to October, before recovering, to still outperform its sector average.
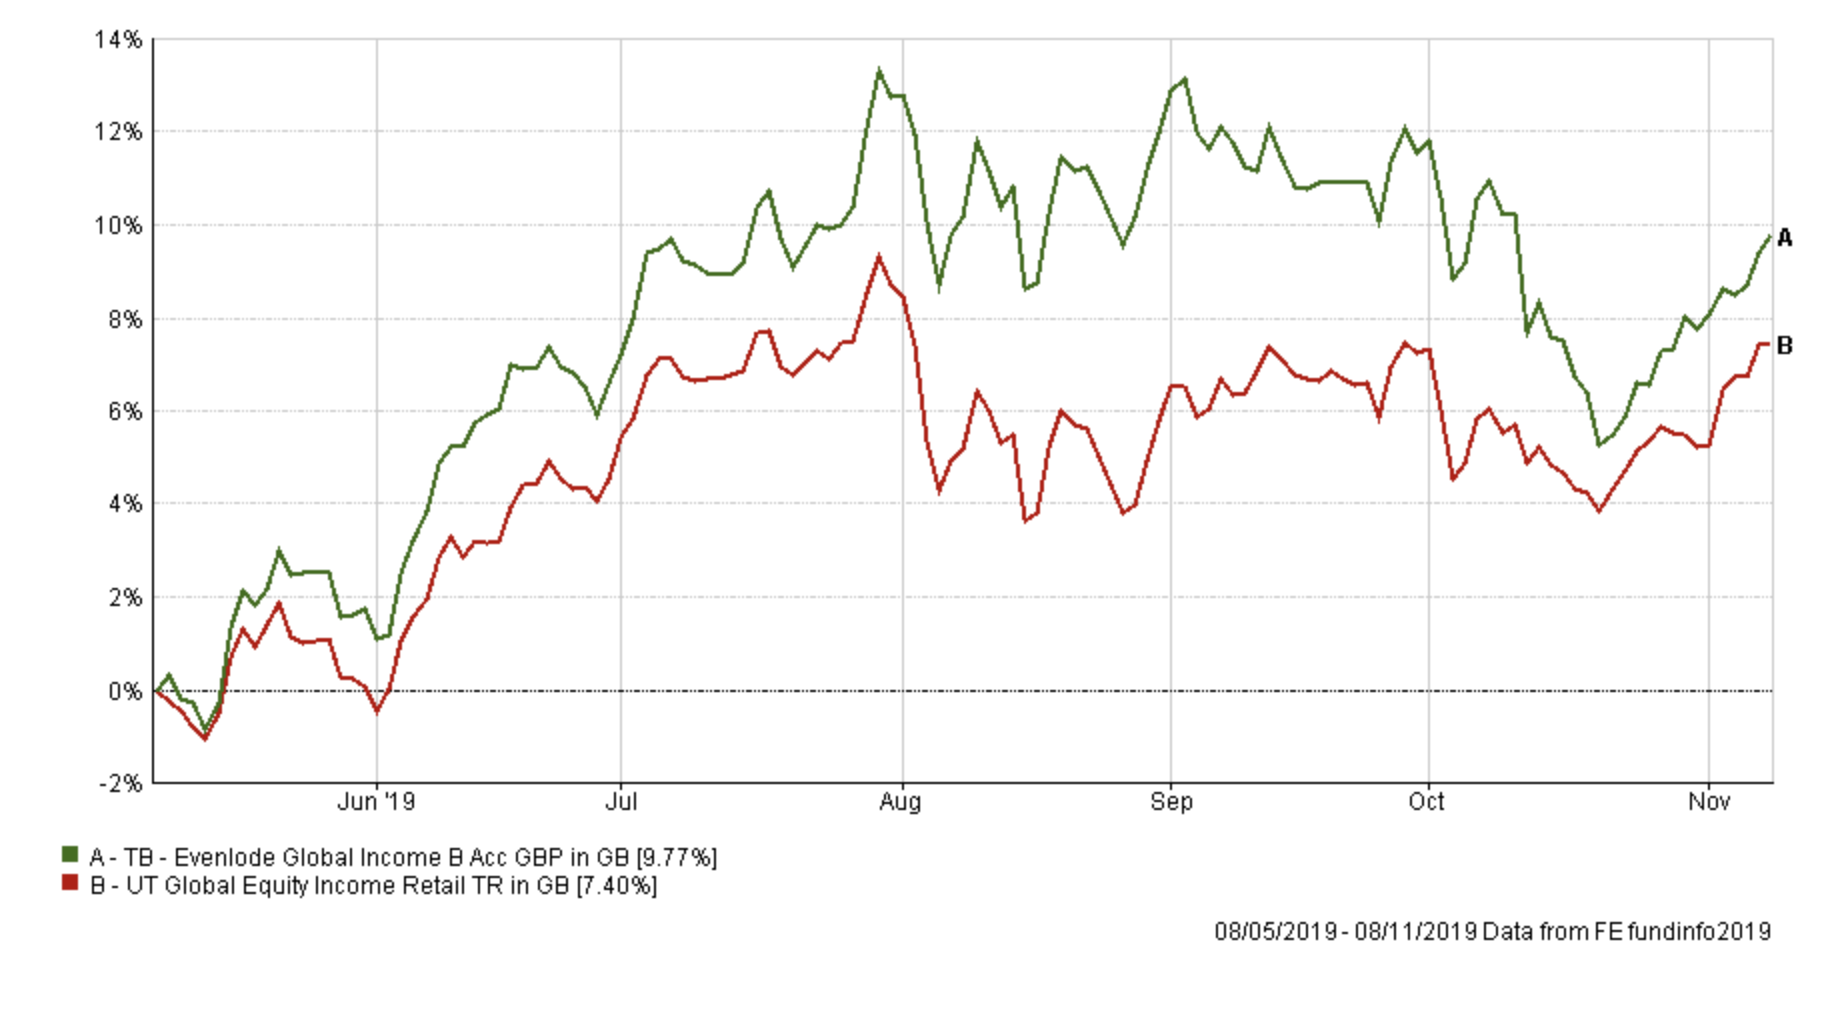
The main contributor to the October fall was the 5% rally in the value of the pound versus the dollar and the euro. Over 70% of the fund's assets are exposed to both currencies, without hedging. The fund remains in the BFBS and isn't suddenly a bad fund but I am keen to diversify my portfolio, particularly the currency exposure. The BOTB has also been steadily reducing its US exposure, partly in favour of more Japanese equity exposure. So the fund switch (into my existing Japanese equity fund) mirrors this.
Fund switch 3
100% out of Fidelity Global Property and 60% into ASI Global Real Estate Share and 40% into Slater Growth
The chart below shows the performance of the Fidelity Global Property fund (green) since I've held it versus the sector average (in red) and the ASI Global Real Estate Share fund (in yellow).
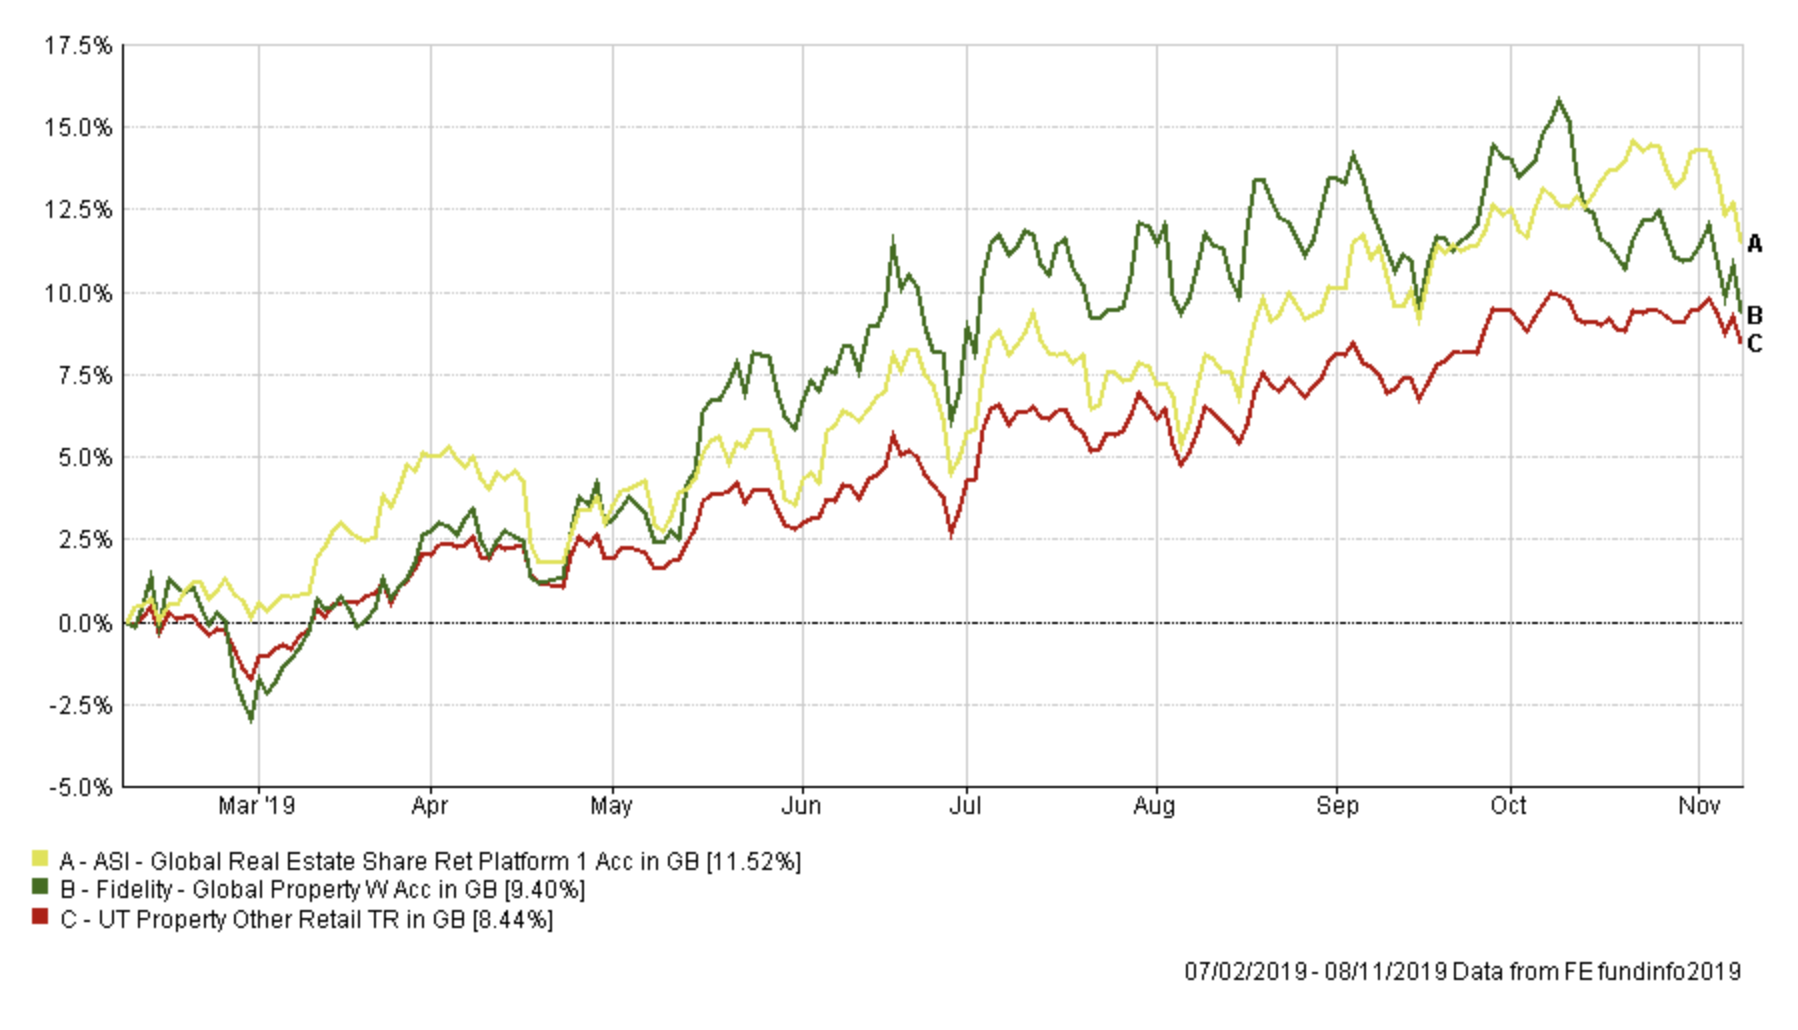
As you can see this has been a very profitable investment for me this year. Investing in Real Estate Investment Trusts (REITs) was not a widely held investment over the summer (in fact you will have seen little press coverage about the opportunity). The fund benefited from a weakening pound versus the dollar but also a deteriorating economic outlook, in a large part thanks to the ongoing US-China trade war. After the October high point when the fund was up over 15% a perfect storm of a 5% rally in the value of the pound followed by a widespread rush into cyclical/value sectors after positive trade war headlines hit the fund.
The fund has since fallen out of the BOTB and BFBS tables (it is the only fund I currently hold that has). However, by replacing it with a combination of ASI Global Real Estate Share and Slater Growth I will reduce my exposure to the GBP/USD exchange rate. Firstly the ASI Global Real Estate Share is currency hedged while the latter fund is a UK focused equity fund with a small-cap bias which means it is not adversely affected by a rally in the value of the pound. The switch will reduce the property exposure of my portfolio to just under that of the BOTB but the REIT sector has had a good run and I think there is nothing wrong with taking some profits.
Meanwhile, the Slater Growth fund is in the BOTB at the moment and was also highlighted as a fund in my Aggressive Winter Fund Portfolio. It's certainly started this winter well but it's still very early days.
Fund switch 4
Switch 50% out of M&G Global Listed Infrastructure and 100% into Fidelity European.
The chart below shows the performance of the M&G fund since I've held it versus its sector average. It has been a brilliant investment (up over 17% in 9 months). As you can see I got in early just before the benefits of holding utilities took hold in May (and over the summer) as Donald Trump escalated the US-China trade war. It was also the reason my portfolio performed so well during August when most fund managers struggled.
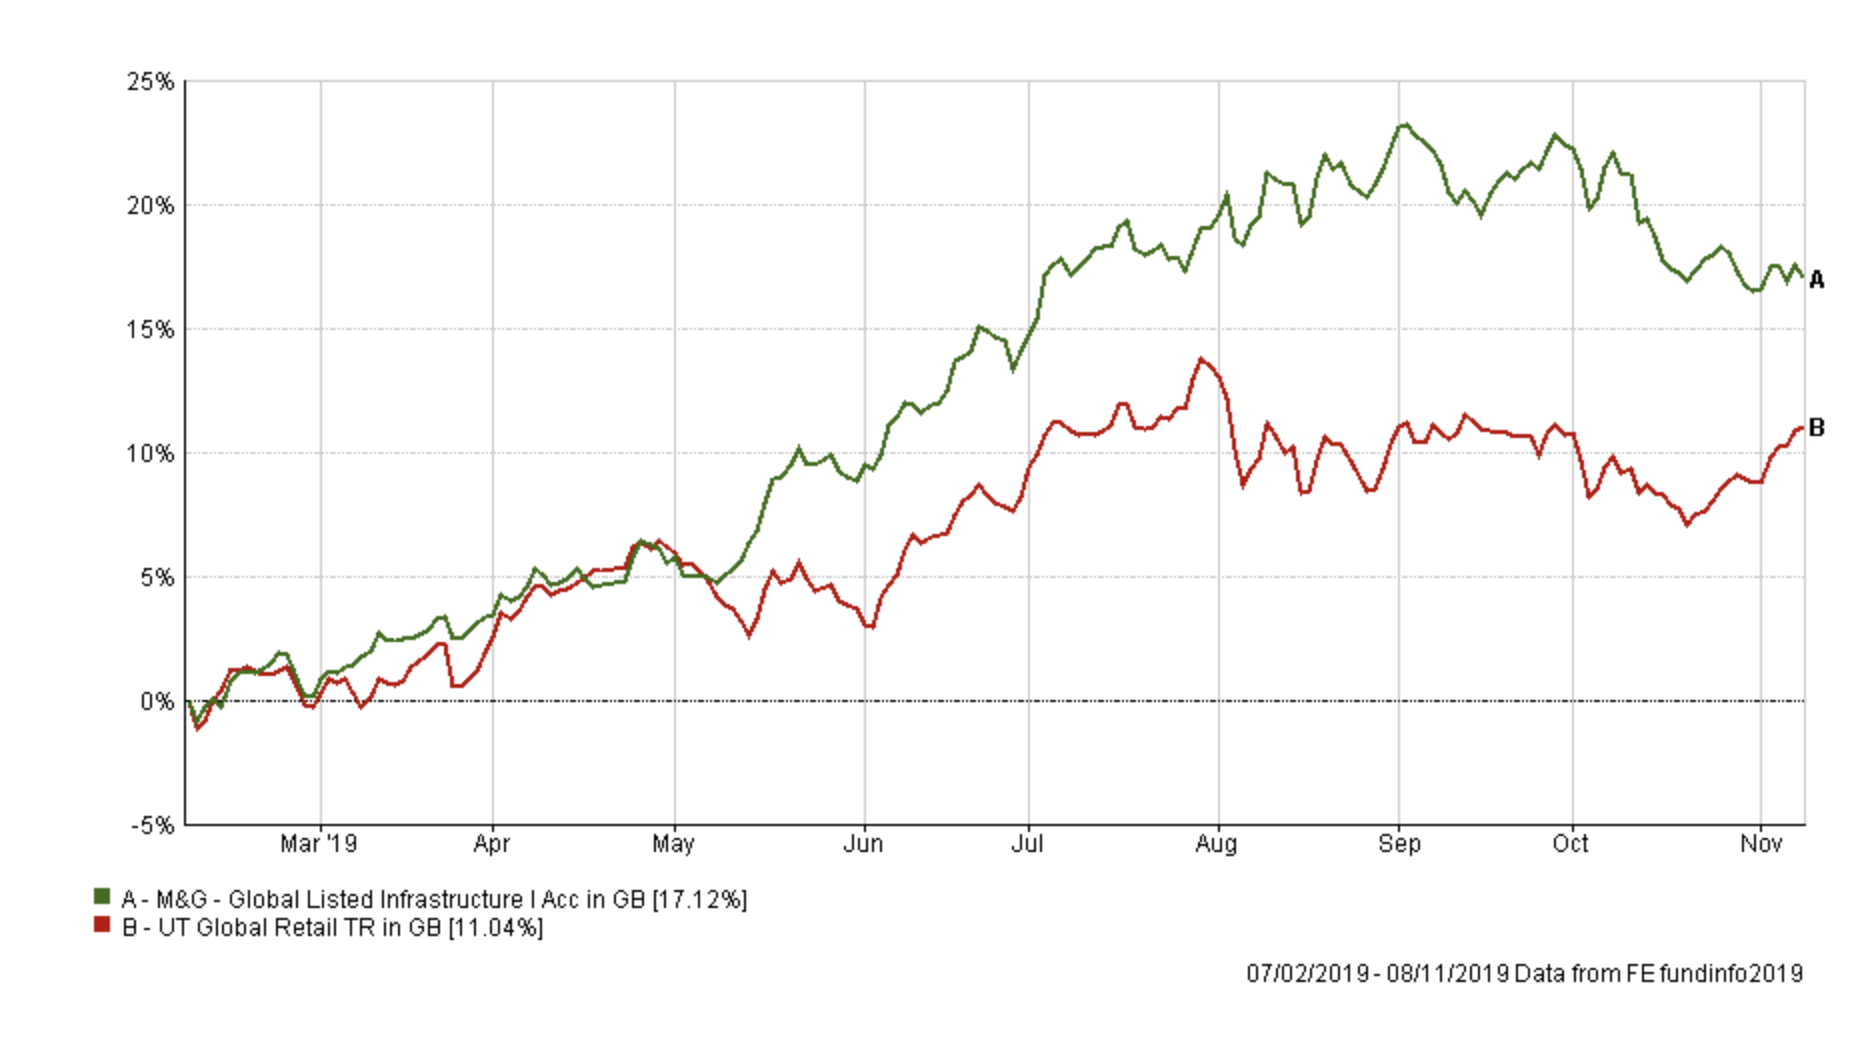
However in the last month the fund has shown some signs of weakness in much the same way as the Fidelity Global Property fund, but to a lesser extent. The fund's exposure to the GBP/USD exchange rate meant it fell 5% when the pound rallied 5% in October. In addition, optimism over a US-China trade deal (which may well prove misplaced) has seen utilities in the US take a breather as investors opt for more cyclical sectors. Of course, the M&G fund is not suddenly a bad fund (it remains in both the BFBS and BOTB) but it formed a significant part of my portfolio 14%, so I thought it sensible to halve my holding and take some profits while at the same time reducing my reliance on the pound falling in value.
I have decided to invest the proceeds into the Fidelity European fund to maintain my European equity exposure and introduce a direct European equity portion to my portfolio. Of course, the fund will have some exposure to the fluctuations in the value of the pound but so far this has proven to be to a lesser extent than the M&G fund.
Overall my portfolio's equity exposure has increased slightly from 55% to nearer 59% (in line with the BOTB) and overall the new funds marginally increase my portfolio's overall risk profile. Once again I've tried to keep fund switches to a minimum but given my desire to start to reduce my currency exposure and bias towards utilities and REITs the switches impact approximately 31% of my portfolio.
My portfolio
My portfolio therefore looks like this:
| Fund | Allocation % | Risk | Sector | ISIN Code |
| Fidelity Global Enhanced Income | 5 | Medium | Global Equity Income | GB00BD1NLJ41 |
| M&G Global Listed Infrastructure | 7 | Medium | Global | GB00BF00R928 |
| Janus Henderson Fixed Interest Monthly Income | 16 | Low | Sterling Strategic Bond | GB0001920486 |
| BNY Mellon Real Return | 11 | Low | Targeted Absolute Return | GB0001642635 |
| ASI Emerging Markets Bond | 10 | Low | Global Emerging Markets Bond | GB00B5L9HN22 |
| Vanguard LifeStrategy 20% Equity | 6 | Low | Mixed Investment 0-35% Shares | GB00B4NXY349 |
| Jupiter Japan Income | 9 | High | Japan | GB00B0HZTZ55 |
| VT Gravis Clean Energy Income | 11 | Medium | Global | GB00BFN4H792 |
| TB Evenlode Global Income | 6 | High | Global Equity Income | GB00BF1QMV61 |
| ASI Global Real Estate Share | 7 | High | Property Other | GB00B7MR5W47 |
| Fidelity European | 7 | Medium | Europe Excluding UK | GB00BFRT3504 |
| Slater Growth | 5 | Medium | UK All Companies | GB00B0706C66 |
My asset mix
This means my asset mix is as follows (the old asset mix is in brackets):
-
- UK Equities 11% (8%)
- North American Equities 13% (18%)
- Global Fixed Interest 19% (13%)
- Japanese Equities 10% (4%)
- Other International Equities 0% (0%)
- Emerging market equities 0% (0%)
- European Equities 13% (10%)
- UK Fixed Interest 0% (0%)
- Cash 2% (5%)
- Alternative Investment Strategies 11% (11%) (including absolute return)
- Emerging Market Fixed Interest 9% (9%)
- Gilts 0% (7%)
- Asian equities 0% (0%)
- Commodities and energy 5% (4%)
- Property 7% (11%) - most of which is equities in the US.
Damien's higher risk and low risk portfolios
Using the logic described in my post: Damien’s Higher Risk Portfolio I created higher and lower risk versions of my portfolio by popular demand.
Higher risk
| Fund | Allocation % |
| Fidelity Global Enhanced Income | 8.77 |
| M&G Global Listed Infrastructure | 12.28 |
| Jupiter Japan Income | 15.79 |
| VT Gravis Clean Energy Income | 19.30 |
| TB Evenlode Global Income | 10.53 |
| ASI Global Real Estate Share | 12.28 |
| Fidelity European | 12.28 |
| Slater Growth | 8.77 |
Lower risk
| Fund | Allocation % |
| Fidelity Global Enhanced Income | 6.41 |
| M&G Global Listed Infrastructure | 8.97 |
| Janus Henderson Fixed Interest Monthly Income | 20.53 |
| BNY Mellon Real Return | 14.10 |
| ASI Emerging Markets Bond | 12.82 |
| Vanguard LifeStrategy 20% Equity | 7.69 |
| VT Gravis Clean Energy Income | 14.10 |
| Fidelity European | 8.97 |
| Slater Growth | 6.41 |

£200 Pension Cashback Offer
Make a qualifying deposit or transfer a pension to our partner Interactive Investor.
- Deposit or transfer a pension of at least £20k and you could earn £200 cashback
- Terms and Fees apply, Capital at risk
- New & Existing customers opening a SIPP
- Offer ends 31st July 2026
Before starting your transfer, check you won't lose any valuable benefits (such as guaranteed annuity rates or a lower protected pension age) and find out what exit fees you might have to pay
