

The background to my portfolio
Back in March 2015 I decided to invest £50,000 of my own money using 80-20 Investor. The purpose was twofold, firstly to show how you can use 80-20 Investor to invest and outperform the market with only a few minutes effort every now and then. Secondly, no other investment commentator, journalist or research provider invests their own money for fear of failing. This is a sorry state of affairs and is precisely why I committed to openly running my own portfolio for 80-20 Investor members to see.
Since then I have periodically changed my portfolio using the fund suggestions provided by the 80-20 Investor algorithm and associated research. I always disclose the changes at the time they are made.
Performance update
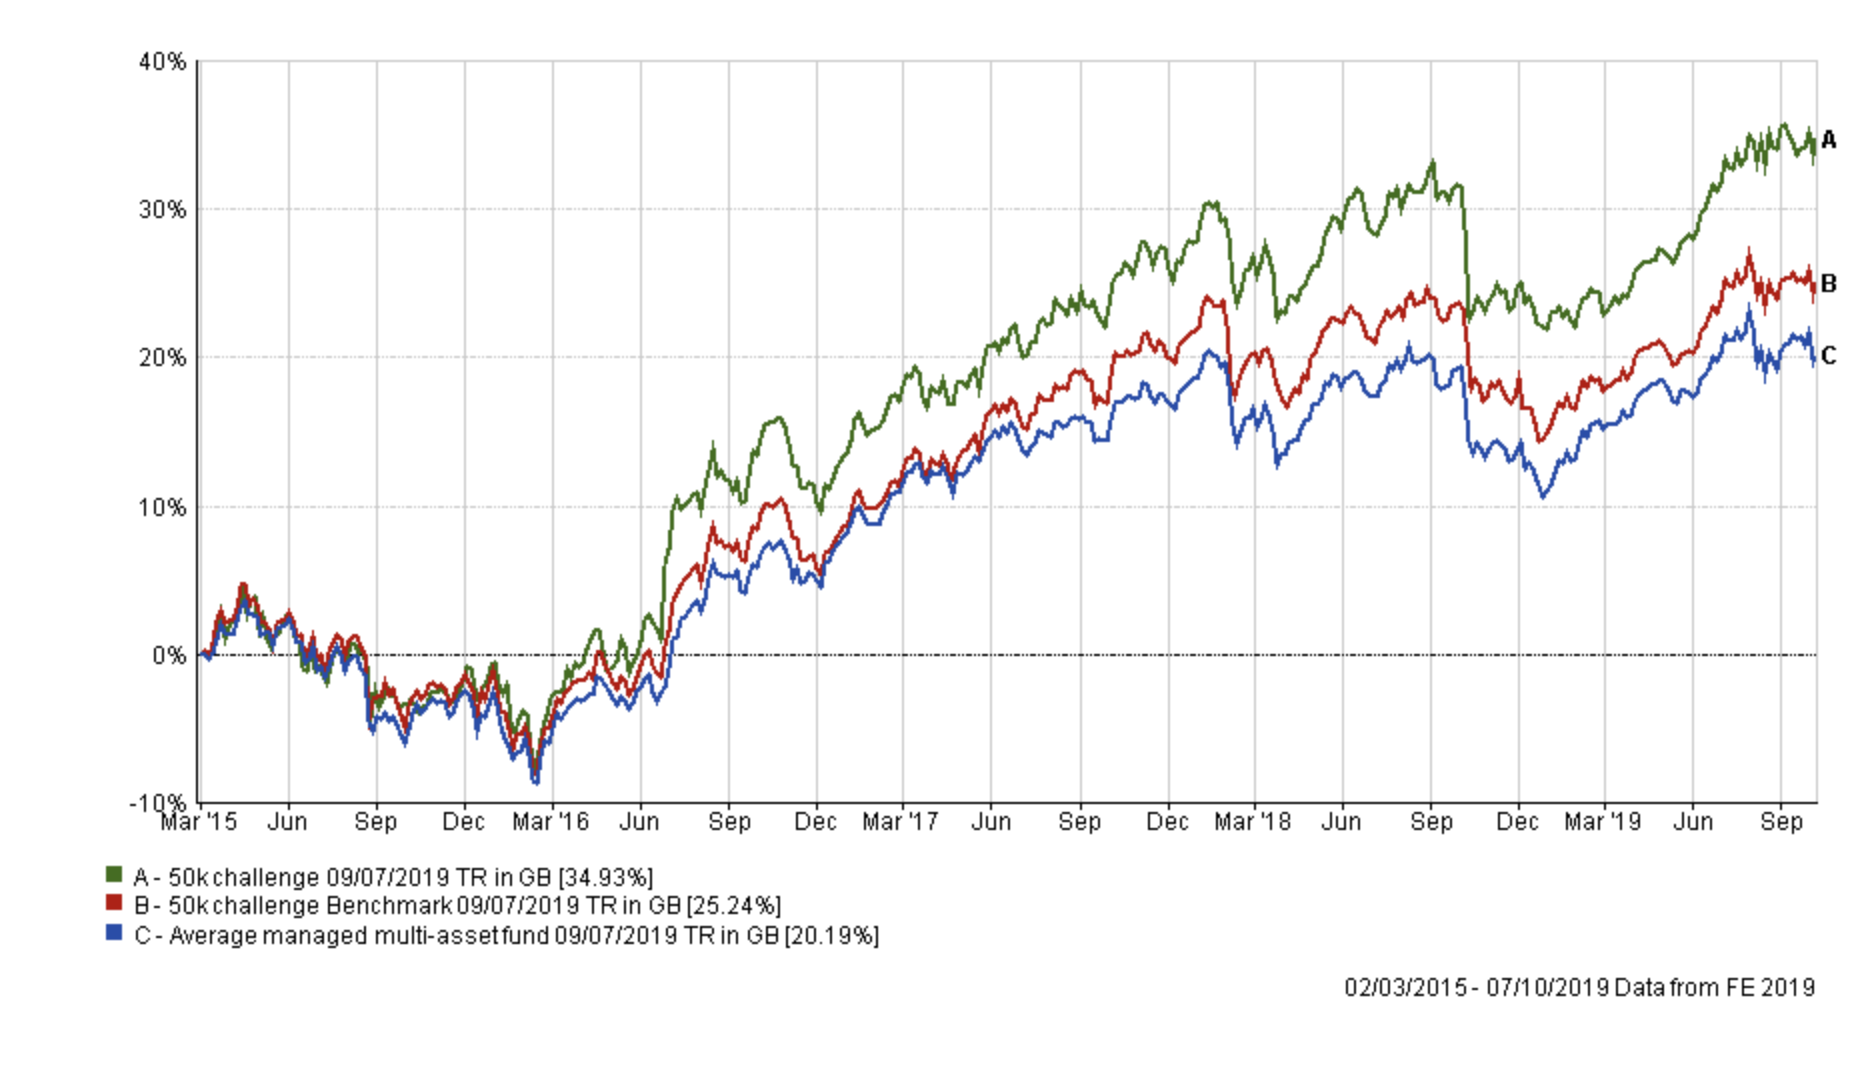
As is usual in my portfolio reviews, the chart below shows how my portfolio has outperformed since I started the challenge in March 2015, four and a half years ago. The green line is the performance of my portfolio while the red line is the benchmark showing the average return achieved by professional fund managers given the same asset mix. To accurately calculate this I have used the average return for each sector in which my portfolio invested. The blue line shows what the average multi-asset fund with comparable equity content achieved. In other words, the red line would show the extra performance added by just the asset mix of my portfolio (where I was invested i.e European equities etc) over picking a typical multi-asset fund (the blue line). While the green line (which is my actual performance) shows the impact of being in the right funds at the right time, as identified by the 80-20 Investor algorithm.
September turned out to be a month full of surprises. As I mentioned in October's monthly newsletter the market narrative turned on its head at the start of September:
"In complete contrast to August, the market began pricing in a far more optimistic outlook for global economic growth. The result was that defensive equity sectors (REITs, utilities and consumer staples) began to underperform more cyclical (and economically sensitive) sectors that had been laggards in recent months. The price of high-quality government bonds, such as treasuries and gilts, tumbled as did the funds that invest in them. Far from being positive for momentum trades, the start of September finally saw value stocks outperform, as shown in the chart below. Investors became gripped by FOMO (the fear of missing out) and rotated into these value sectors as they rallied."
This meant that my portfolio, which has exposure to gilts, REITs and utilities struggled at the start of September and underperformed its benchmarks as shown in the chart below. Ironically, the slump started the day after my last portfolio review, when I wrote that I "appreciate the underlying market drivers could change". It was almost the kiss of death. The slump continued, until the 16th September when the narrative which drove the market in August began reestablishing itself i.e it was positive for RETIs, utilities and defensive sectors/assets.
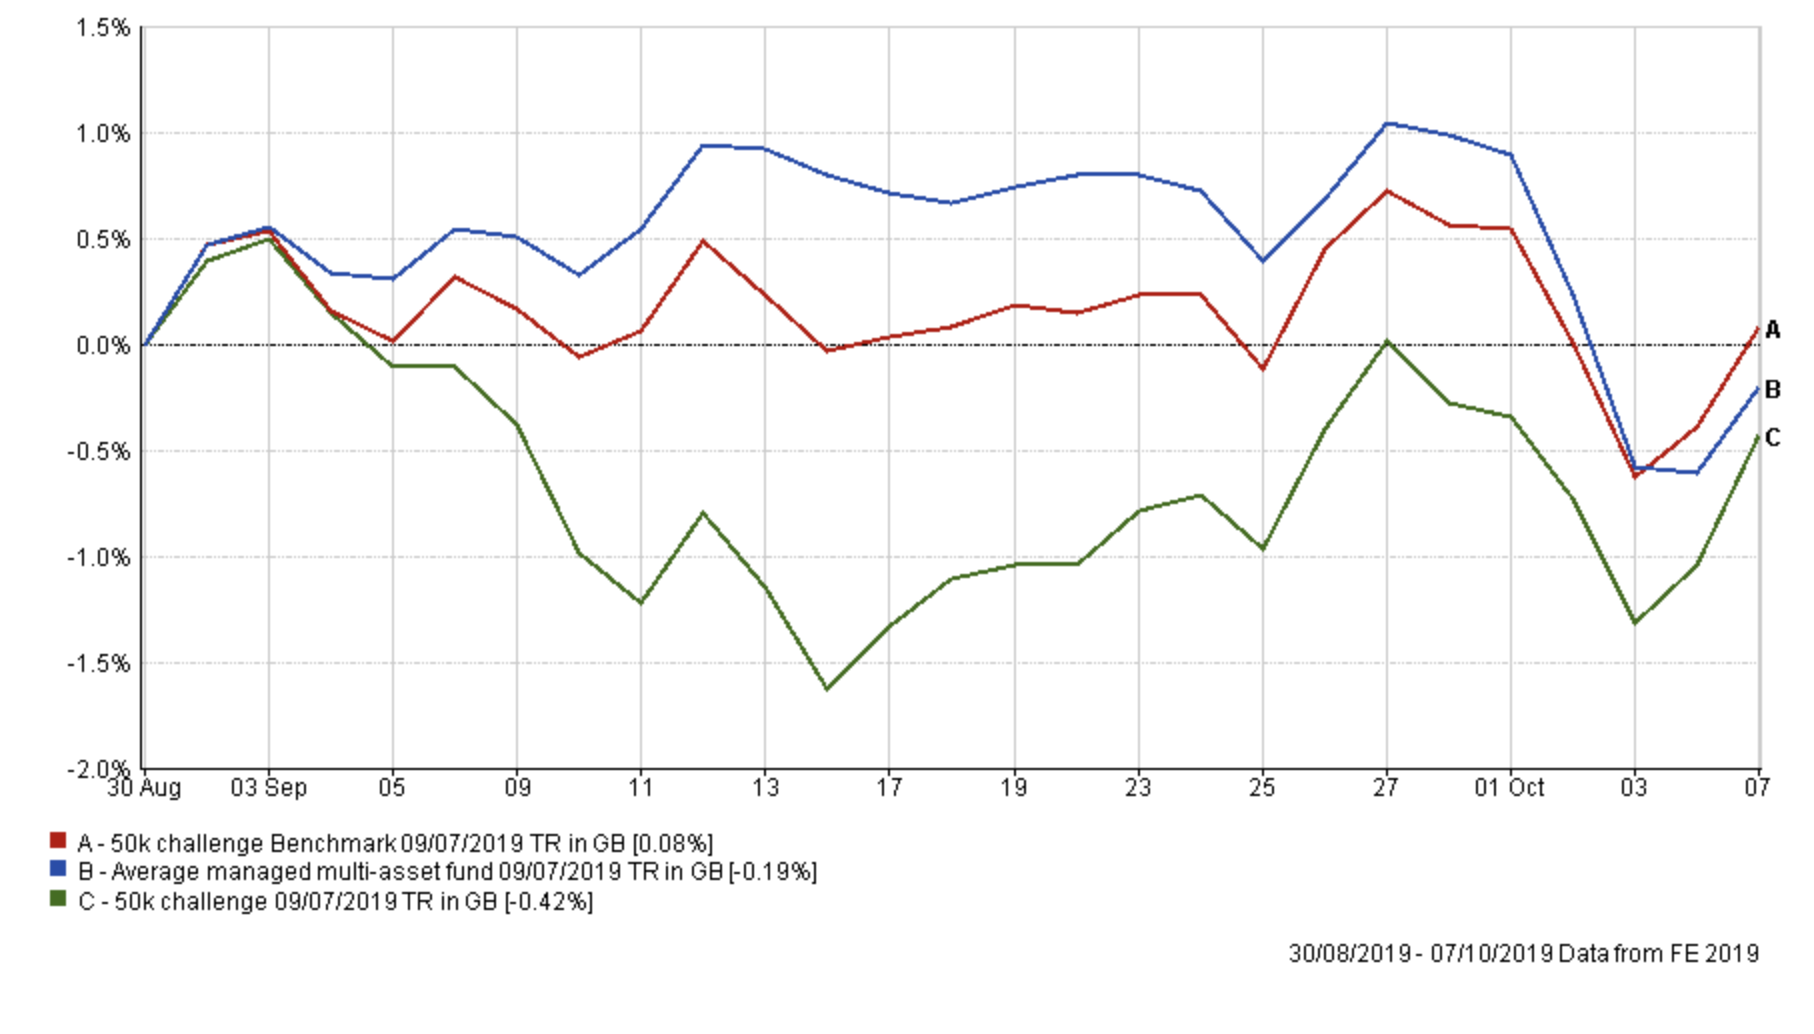
Of course the short period of underperformance felt uncomfortable as the aggressive reversal in market rhetoric hit my portfolio. But by sticking to my process throughout the short term bout of market volatility the portfolio went on to ultimately recoup all of its September losses (as shown above).
If we zoom out and look at the performance of my portfolio across August and September you can see that during September my portfolio simply gave up its August gains, versus its benchmarks, before reestablishing them as shown in the chart below.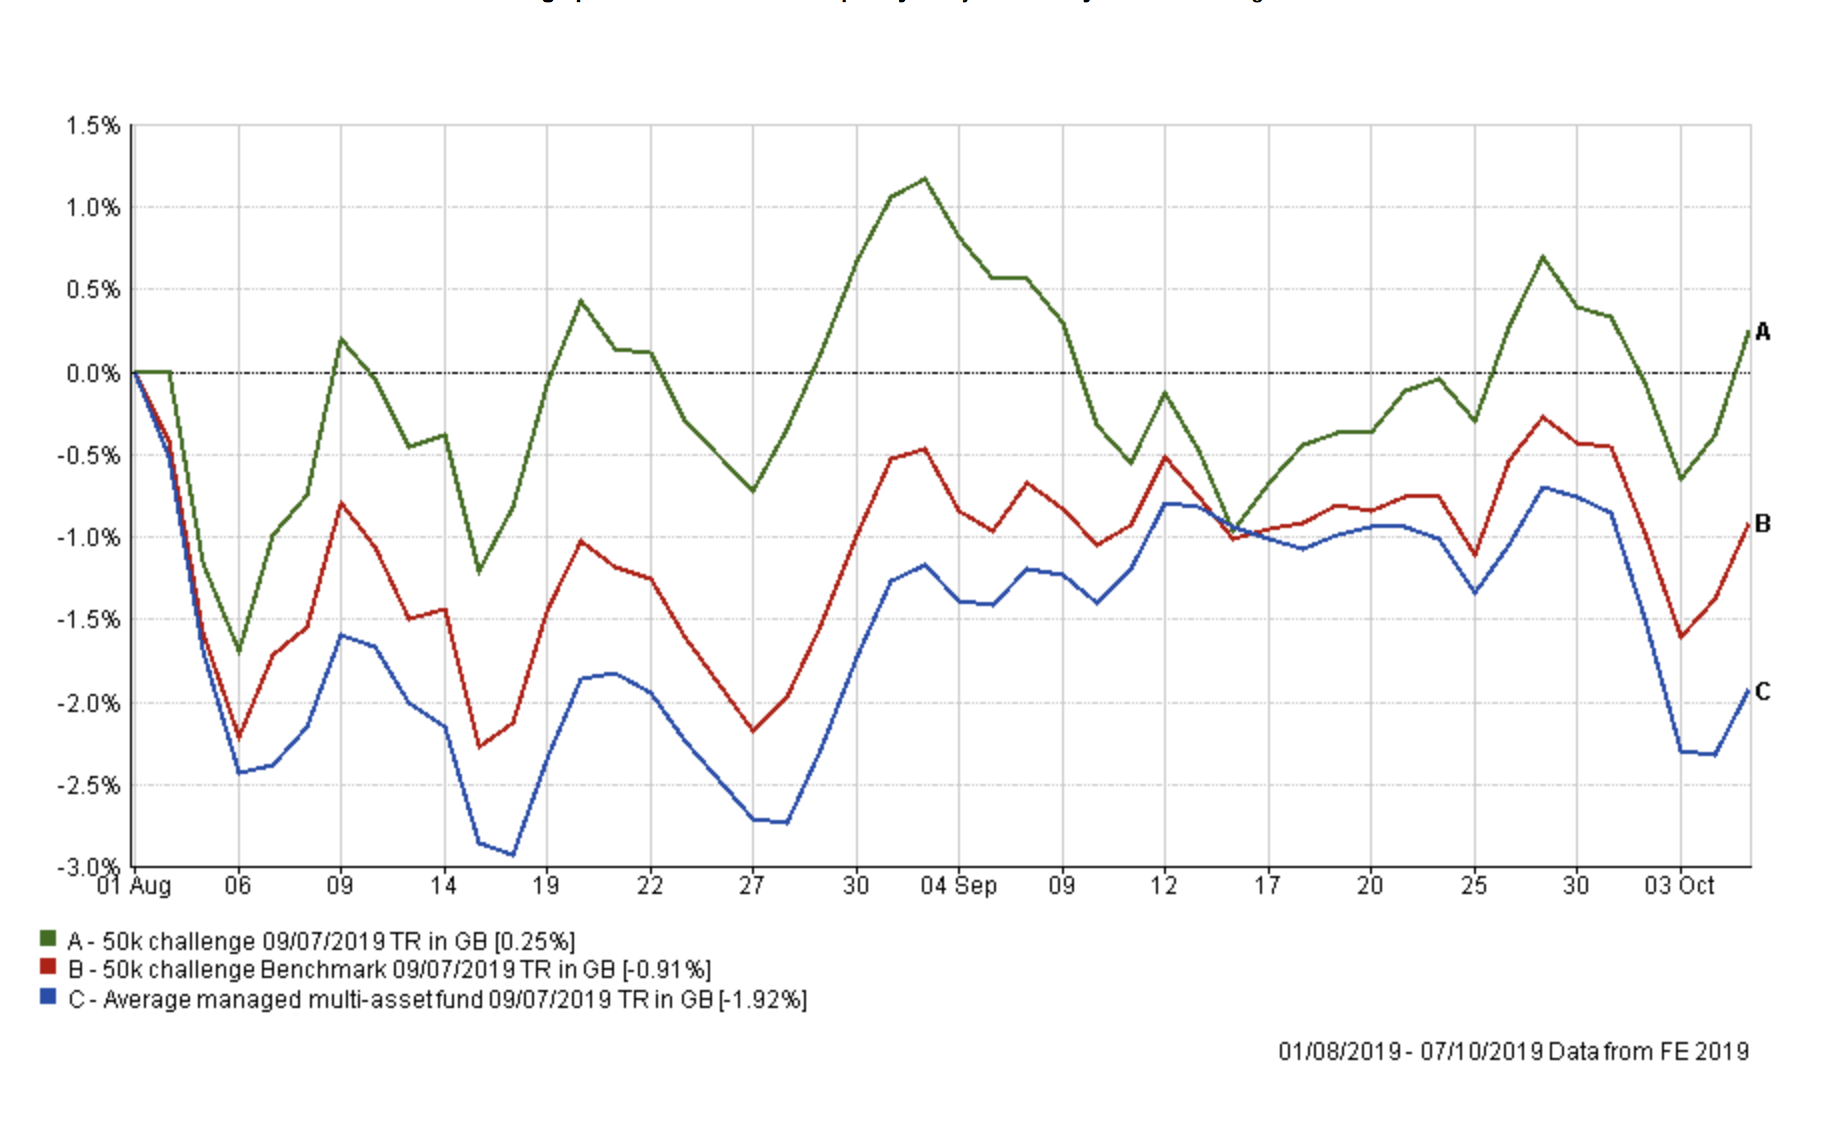
My portfolio made a profit across a difficult two month period for investment markets while the typical professional multi-asset fund manager lost -1.92%. As you can see in the first chart in this article, my portfolio is once again within 1% of its all-time high set at the start of September.
September provided a number of lessons, firstly not to obsess over short term trends when you are a long term investor but also why it is important to focus on your process, even when it can feel uncomfortable to do so. Another lesson is that the market can and will move against you. Sometimes that move will be short term (as was the move in September) or longer (as was the move in the autumn of 2018). That's investing for you! Sticking to an investment process helps you avoid making emotional investment decisions throughout these periods (although it doesn't guarantee profits). With so many worries hanging over markets including Brexit, the US-China trade war, slowing economic growth and geopolitical risks we should expect more wild moves and volatility in the months ahead.
For now the market narrative is once again driving my portfolio higher. This may change again. It pays to be humble as the market has a habit of doing what you least expect or want it to.
So applying the process as usual, the table below shows my portfolio's current allocation, with those funds in green still in the BOTB while those in yellow are not in the BOTB but remain in the BFBS list. Meanwhile, any funds in red have dropped out of both shortlists.
| Fund | Allocation % | Risk | Sector | ISIN Code |
| Fidelity Global Enhanced Income | 5 | Medium | Global Equity Income | GB00BD1NLJ41 |
| Fidelity Global Property | 12 | High | Property Other | GB00B7K2NZ09 |
| M&G Global Listed Infrastructure | 14 | Medium | Global | GB00BF00R928 |
| HSBC UK Gilt Index | 6 | Low | UK Gilts | GB00B4581C50 |
| Janus Henderson Fixed Interest Monthly Income | 10 | Low | Sterling Strategic Bond | GB0001920486 |
| BNY Mellon Real Return | 11 | Low | Targeted Absolute Return | GB0001642635 |
| ASI Emerging Markets Bond | 9.5 | Low | Global Emerging Markets Bond | GB00B5L9HN22 |
| Liontrust Sustainable Future Cautious Managed | 6 | Medium | Mixed Investment 40-85% Shares | GB00BMN90304 |
| ASI Europe ex UK Equity | 3 | High | Europe Excluding UK | GB00B0LG6P37 |
| Fundsmith Equity | 5 | High | Global | GB00B4Q5X527 |
| JPM Emerging Markets | 6 | High | Global Emerging Markets | GB0030881550 |
| TB Evenlode Global Income | 12.5 | Medium | Global Equity Income | GB00BF1QMV61 |
Currently, two funds appear in the 80-20 Investor tables and are coloured red. All of the others remain within the BOTB or the BFBS tables. Much like last time, there is no overly compelling reason to alter any of the funds in yellow and green, unless it is to tweak the underlying asset mix.
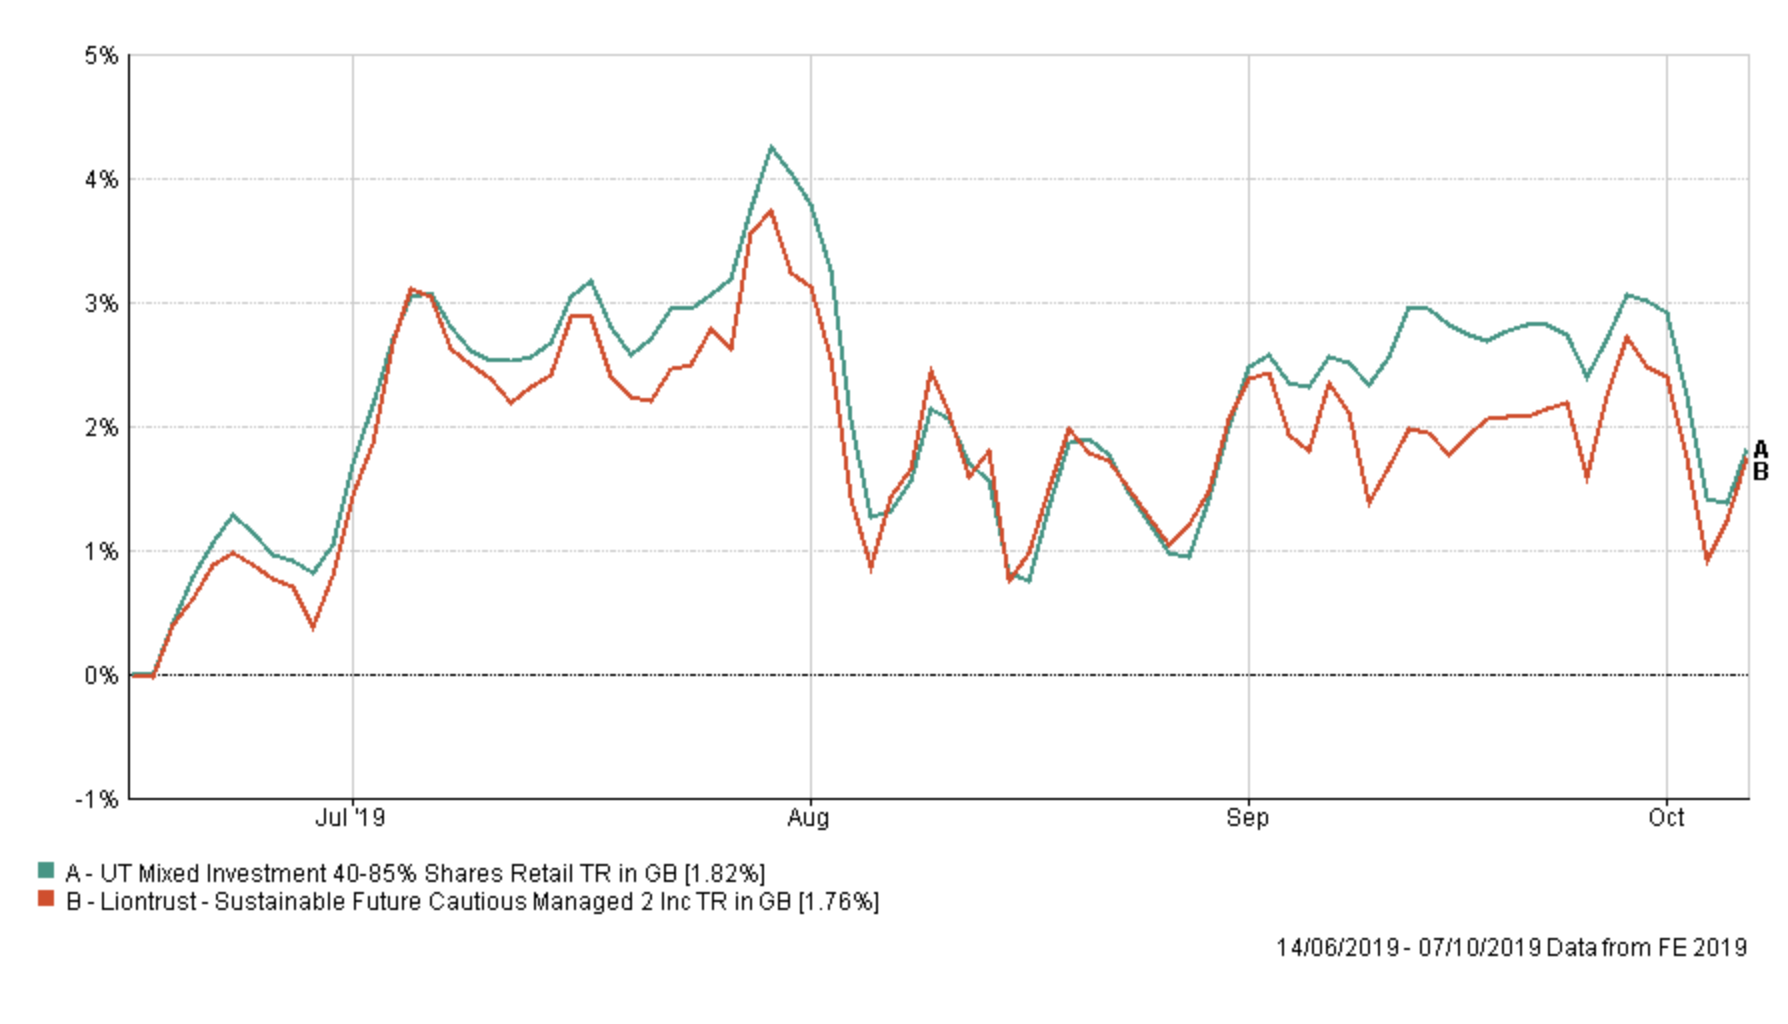
Once again the Liontrust Sustainable Future Cautious Managed fund is coloured red and it is time to seek better opportunities elsewhere. The chart below shows how the fund has continued to track the Mixed Investment 40-85% Shares sector average (the red line). It's still not a disaster but it did underperform its peer group throughout September.
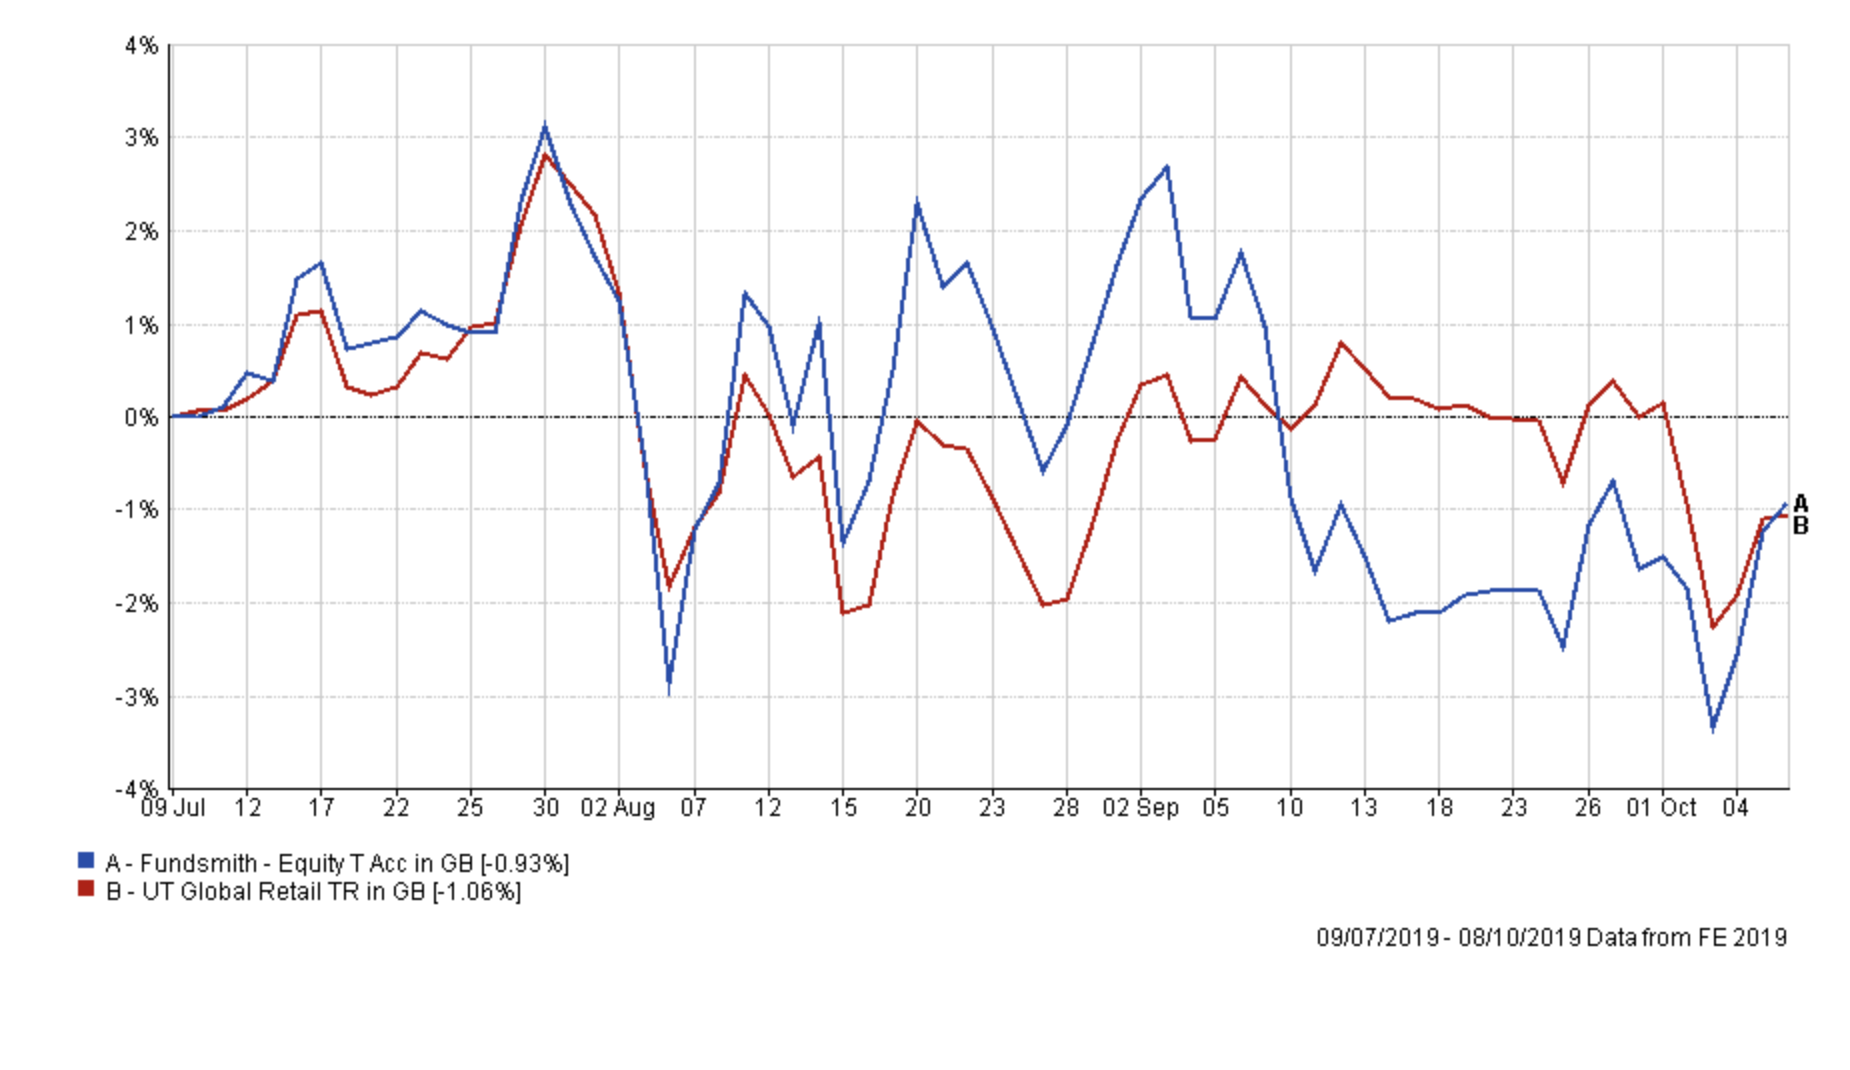
The other fund to fall out of both the BOTB and BFBS tables is Fundsmith equity. The fund has been extremely volatile, which is largely down to its concentrated number of holdings and its currency exposure (65% of its assets are from the US). That doesn't make it a terrible fund but its performance of late has been poor and has been a drag on my portfolio. The chart below shows the performance of the fund versus its benchmark since I've held it.
While I don't religiously follow the asset mix of the BOTB I do try to reflect it as well as I can while minimising the number of fund changes that I make. If I compare the asset mix of my portfolio as it currently stands against that of the new BOTB the key differences include:
- I have slightly more exposure to European and US equities
- I have no exposure to Japanese equities, unlike the BOTB
- I have an exposure to emerging market and Asian equities while the BOTB does not and hasn't for some time
- I have more exposure to global property than the BOTB
So my fund switches have looked to address most of these issues while keeping the number of fund changes to a minimum, given the portfolios strong performance.
Fund switches
100% out of Liontrust Sustainable Future Cautious Managed and 100% into Vanguard LifeStrategy 20% Equity. The latter has been a regular of the BOTB for some time now and has outperformed the former while taking much less risk. The switch also boosts my global bond exposure, while reducing my equity exposure, to be more in line with the asset mix of the BOTB.
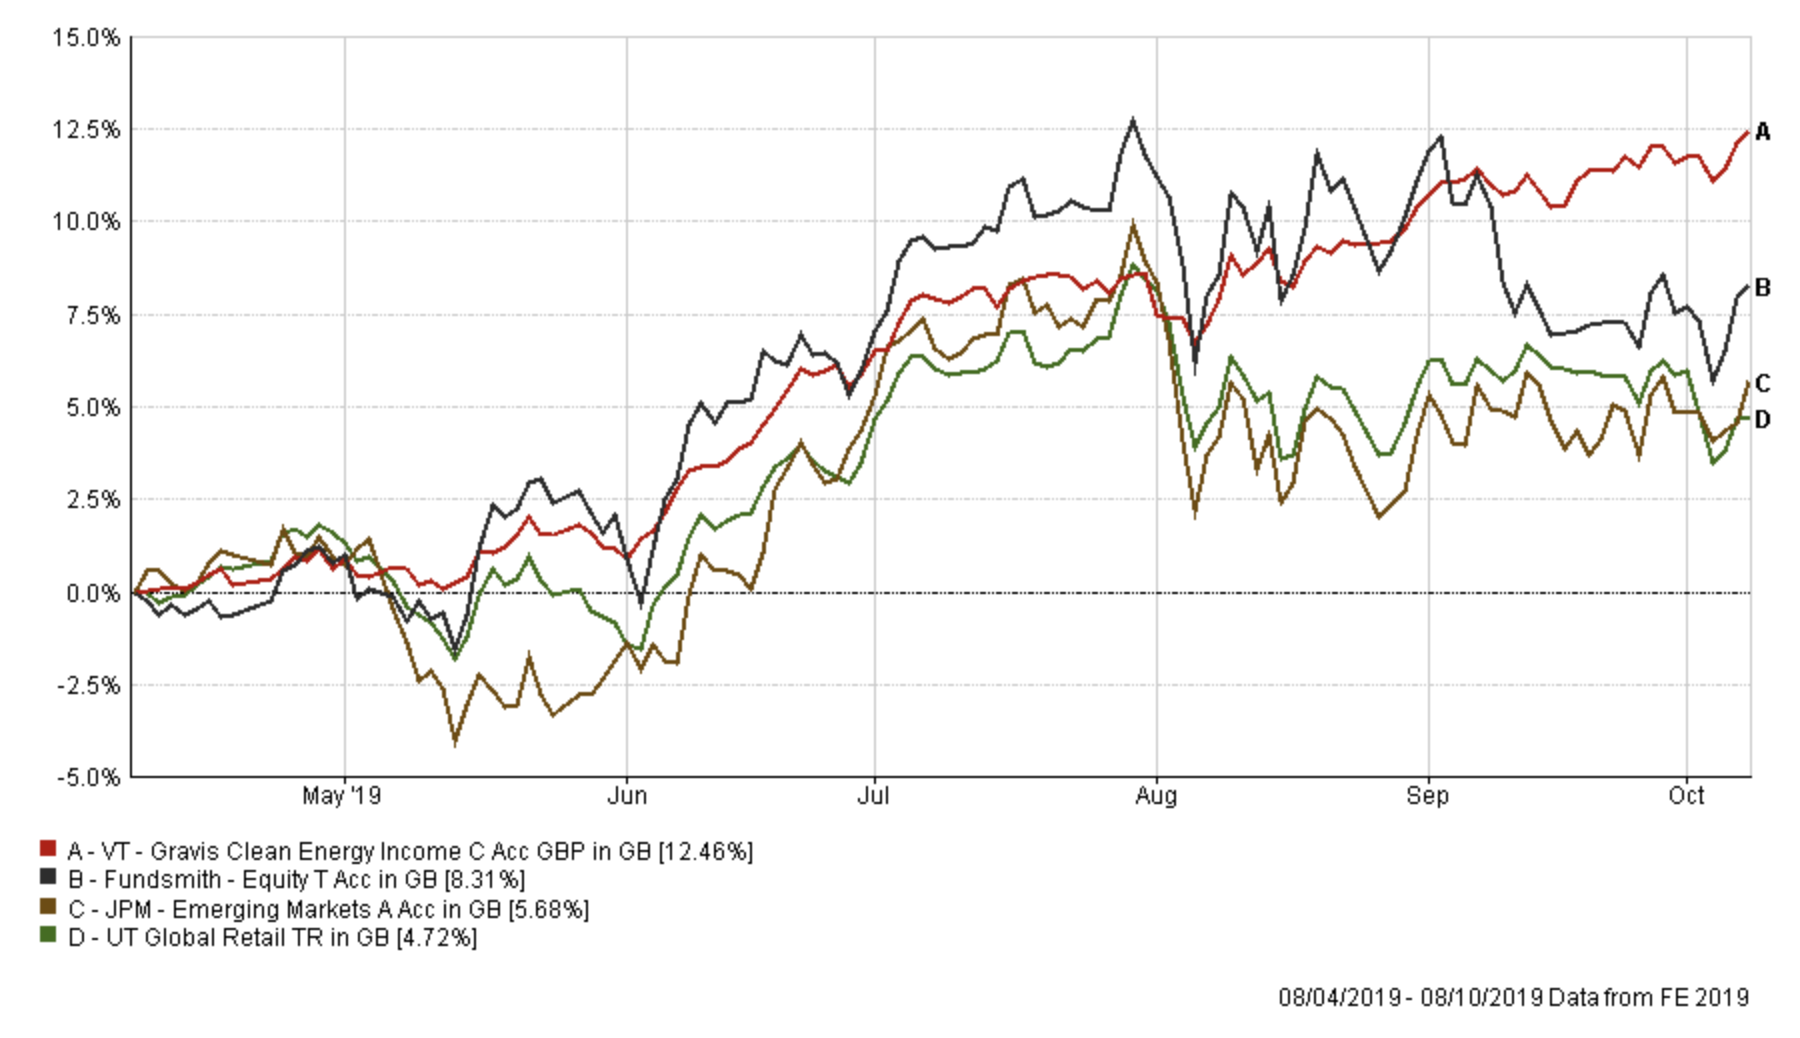
Switch 100% out of JPM Emerging Market and 100% out of Fundsmith Equity and put all of the proceeds into VT Gravis Clean Energy Income. The JPM Emerging Market fund has performed well versus its peers since I've held it (here is a link to its performance chart) but as a whole emerging market funds have struggled as global growth concerns continue to worry markets and the dollar continues to strengthen. So, I have chosen to put the proceeds from the JPM and Fundsmith funds into the VT Gravis Clean Energy Income fund. The new fund performed well across both August and September despite the changing market narratives, and it's displayed (see below) an impressively low level of volatility, compared to its peers including Fundsmith equity, due to currency hedging employed by its manager.
Finally, I switched 100% out of ASI Europe ex UK Equity and 100% into the Jupiter Japan Income fund. The ASI fund has struggled of late and this is a straightforward switch to reduce my European equity exposure and introduce a small (3%) exposure to Japanese equities within my portfolio.
I did also ponder reducing my Fidelity Global Property exposure but chose to maintain it, for now, pending a review next time. Part of the reason is because of the strong performance but also the US equity exposure the fund provides means that my portfolio's overall US equity exposure keeps in line with that of the new BOTB. Furthermore, I also looked at reducing my emerging market bond exposure however its recent performance has shown a higher level of capital protection than its peers and it's almost on a par with global bond funds more generally. For that reason, I decided to maintain my exposure, to provide some quasi-global bond exposure to raise my portfolio's bond exposure up to near that of the BOTB.
Overall my portfolio's equity exposure has dropped from 62% to around 55% and each of the funds switched out were replaced by funds from a lower risk category, so reducing my portfolio's overall risk level. Once again I've tried to keep fund switches to a minimum, given the levels of volatility in the market, and they only impact 20% of my portfolio. In fact the changes are the first changes I have made in three months.
My portfolio
My portfolio therefore looks like this:
| Fund | Allocation % | Risk | Sector | ISIN Code |
| Fidelity Global Enhanced Income | 5 | Medium | Global Equity Income | GB00BD1NLJ41 |
| Fidelity Global Property | 12 | High | Property Other | GB00B7K2NZ09 |
| M&G Global Listed Infrastructure | 14 | Medium | Global | GB00BF00R928 |
| HSBC UK Gilt Index | 6 | Low | UK Gilts | GB00B4581C50 |
| Janus Henderson Fixed Interest Monthly Income | 10 | Low | Sterling Strategic Bond | GB0001920486 |
| BNY Mellon Real Return | 11 | Low | Targeted Absolute Return | GB0001642635 |
| ASI Emerging Markets Bond | 9.5 | Low | Global Emerging Markets Bond | GB00B5L9HN22 |
| Vanguard LifeStrategy 20% Equity | 6 | Low | Mixed Investment 0-35% Shares | GB00B4NXY349 |
| Jupiter Japan Income | 3 | High | Japan | GB00B0HZTZ55 |
| VT Gravis Clean Energy Income | 11 | Medium | Global | GB00BFN4H792 |
| TB Evenlode Global Income | 12.5 | High | Global Equity Income | GB00BF1QMV61 |
My asset mix
This means my asset mix is as follows (the old asset mix is in brackets):
-
- UK Equities 8% (9%)
- North American Equities 18% (18%)
- Global Fixed Interest 13% (9%)
- Japanese Equities 4% (0%)
- Other International Equities 0% (0%)
- Emerging market equities 0% (5%)
- European Equities 10% (13%)
- UK Fixed Interest 0% (0%)
- Cash 5% (4%)
- Alternative Investment Strategies 11% (9%) (including absolute return)
- Emerging Market Fixed Interest 9% (10%)
- Gilts 7% (6%)
- Asian equities 0% (5%)
- Commodities and energy 4% (0%)
- Property 11% (12%) - most of which is equities in the US.
Damien's higher risk and low risk portfolios
Using the logic described in my post: Damien’s Higher Risk Portfolio I created higher and lower risk versions of my portfolio by popular demand.
Higher risk
| Fund | Allocation % |
| Fidelity Global Enhanced Income | 8.70 |
| Fidelity Global Property | 20.87 |
| M&G Global Listed Infrastructure | 24.35 |
| Jupiter Japan Income | 5.22 |
| VT Gravis Clean Energy Income | 19.13 |
| TB Evenlode Global Income | 21.74 |
Lower risk
| Fund | Allocation % |
| Fidelity Global Enhanced Income | 6.9 |
| M&G Global Listed Infrastructure | 19.3 |
| HSBC UK Gilt Index | 8.3 |
| Janus Henderson Fixed Interest Monthly Income | 13.8 |
| BNY Mellon Real Return | 15.2 |
| ASI Emerging Markets Bond | 13.1 |
| Vanguard LifeStrategy 20% Equity | 8.3 |
| VT Gravis Clean Energy Income | 15.1 |

£200 Pension Cashback Offer
Make a qualifying deposit or transfer a pension to our partner Interactive Investor.
- Deposit or transfer a pension of at least £20k and you could earn £200 cashback
- Terms and Fees apply, Capital at risk
- New & Existing customers opening a SIPP
- Offer ends 31st July 2026
Before starting your transfer, check you won't lose any valuable benefits (such as guaranteed annuity rates or a lower protected pension age) and find out what exit fees you might have to pay
