

The background to my portfolio
Back in March 2015 I decided to invest £50,000 of my own money using 80-20 Investor. The purpose was twofold, firstly to show how you can use 80-20 Investor to invest and outperform the market with only a few minutes effort every now and then. Secondly, no other investment commentator, journalist or research provider invests their own money for fear of failing. This is a sorry state of affairs and is precisely why I committed to openly running my own portfolio for 80-20 Investor members to see.
Since then I have periodically changed my portfolio using the fund suggestions provided by the 80-20 Investor algorithm and associated research. I always disclose the changes at the time they are made.
Performance update
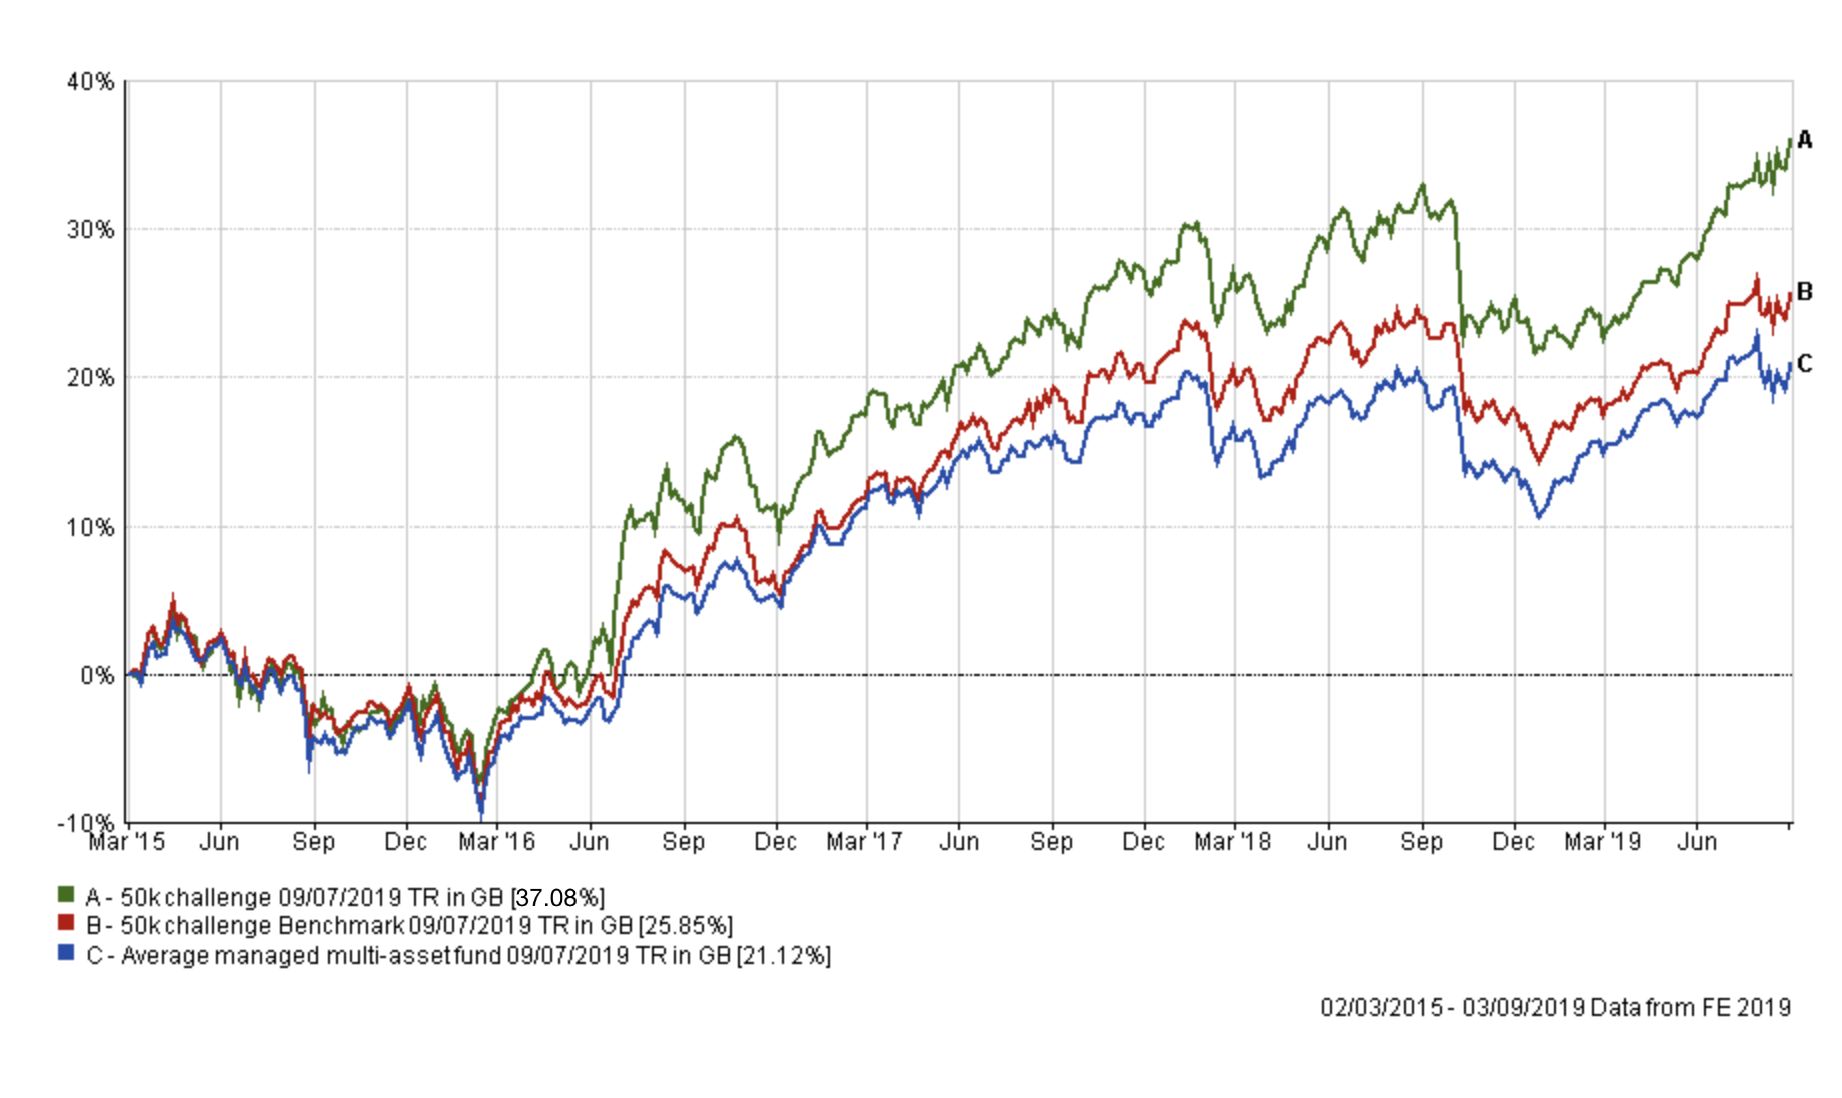
As is usual in my portfolio reviews, the chart below shows how my portfolio has outperformed since I started the challenge in March 2015, four and a half years ago. The green line is the performance of my portfolio while the red line is the benchmark showing the average return achieved by professional fund managers given the same asset mix. To accurately calculate this I have used the average return for each sector in which my portfolio invested. The blue line shows what the average multi-asset fund with comparable equity content achieved. In other words, the red line would show the extra performance added by just the asset mix of my portfolio (where I was invested i.e European equities etc) over picking a typical multi-asset fund (the blue line). While the green line (which is my actual performance) shows the impact of being in the right funds at the right time, as identified by the 80-20 Investor algorithm.
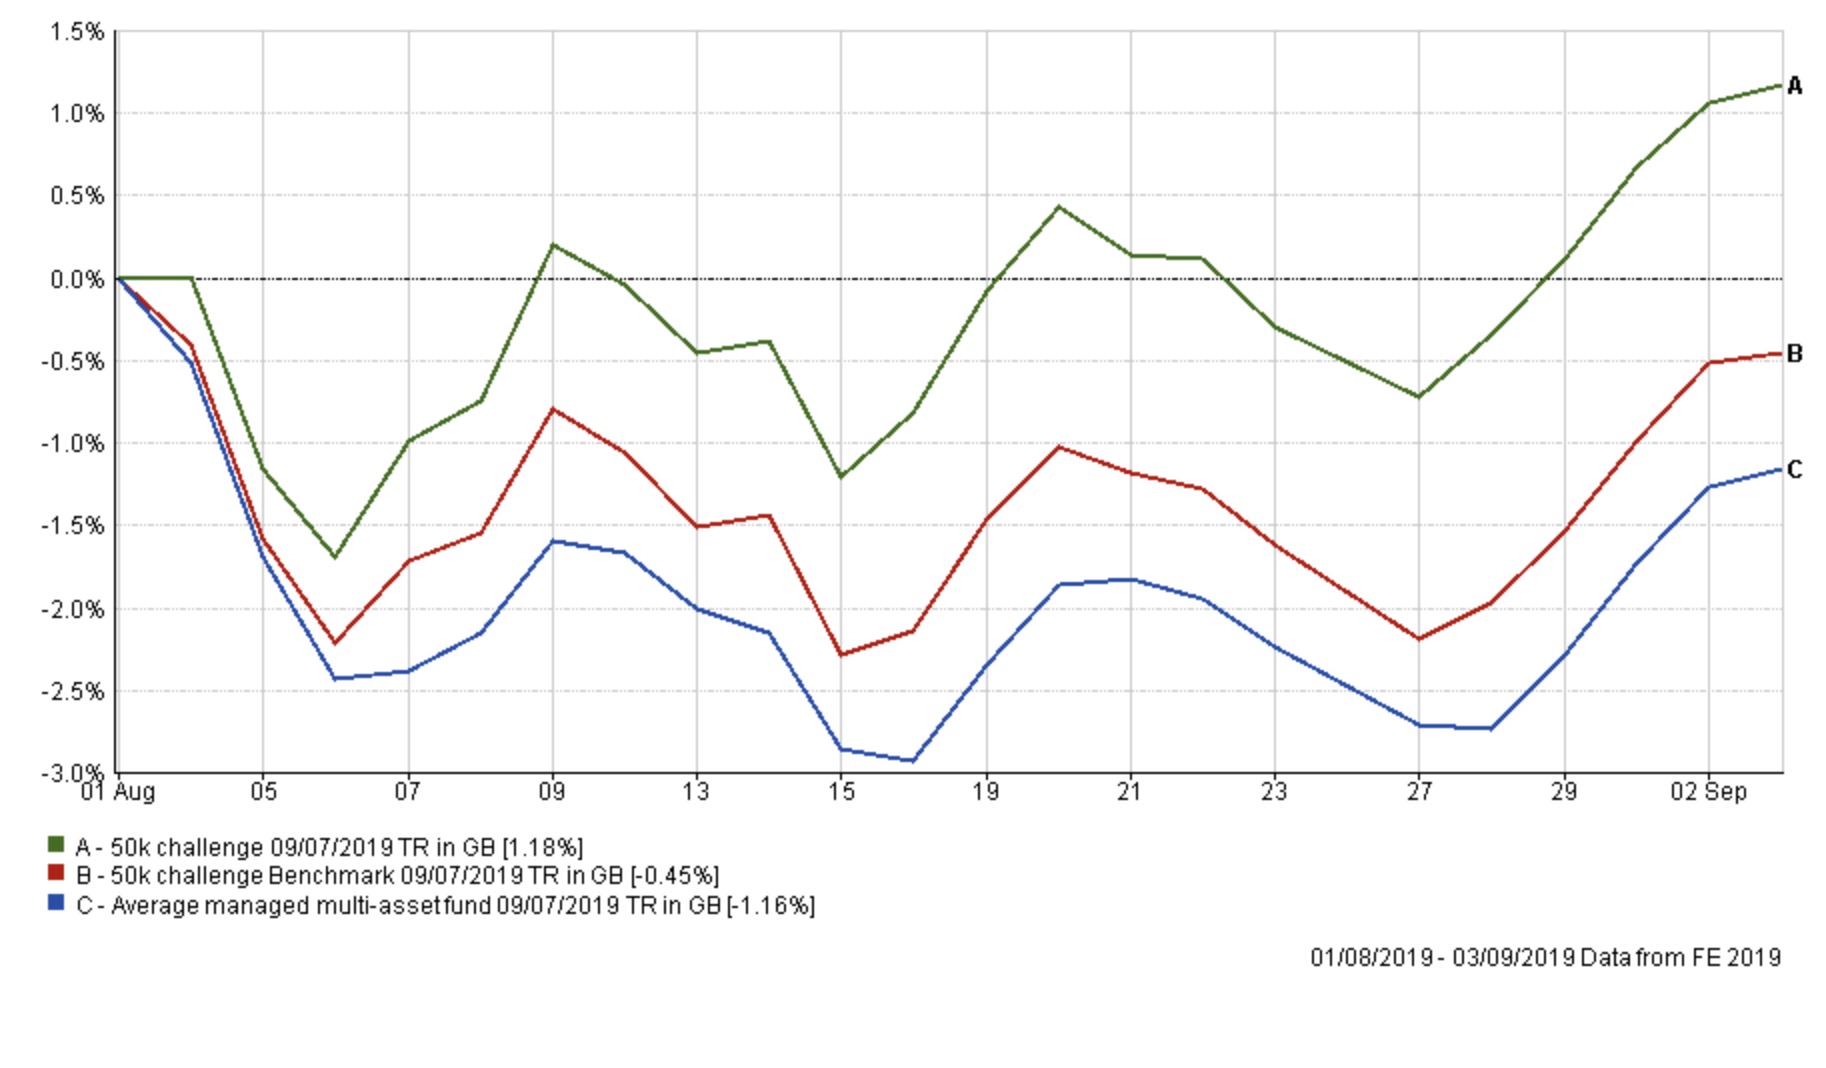
The chart below shows that since the start of August, and that despite the stock market sell-off, my portfolio has made a profit of 1.18%. In contrast the portfolio's benchmarks have made a loss, with the typical professional fund manager from the Mixed Investment 40-85% Shares sector losing -1.16%. To give these figures some context, over the same period the S&P 500 is down -1.6% and the FTSE 100 is down -4.18%. In addition, as I pointed out in my last newsletter, out of the 223 funds within the Mixed Investment 40-85% Shares sector 219 of them lost money during August. My portfolio, on the other hand, made a profit of 0.63% in the month of August, as can also be seen in the chart below.
The table below shows the performance of the funds within my portfolio since the beginning of August.
| Name |
Return since 1st August 2019
|
| HSBC UK Gilt Index | 3.7 |
| M&G Global Listed Infrastructure | 2.68 |
| Fidelity Global Property | 2.4 |
| BNY Mellon Real Return | 2.05 |
| Janus Henderson Fixed Interest Monthly Income | 2.03 |
| ASI Europe ex UK Equity | 0.04 |
| ASI Emerging Markets Bond | -0.05 |
| Fundsmith Equity | -0.67 |
| TB Evenlode Global Income | -0.74 |
| Fidelity Global Enhanced Income | -0.93 |
| Liontrust Sustainable Future Cautious Managed | -1.16 |
| JPM Emerging Markets A Acc in GB | -3.97 |
The big winners are those that are benefiting from a macro theme of global economic growth slowing (with a possible recession) - the catalysts being the ongoing US-China trade war, global geopolitical concerns, Brexit and the natural (and inevitable) ageing of the global economic cycle (something that I will cover more in a future newsletter).
The type of assets that tend to do well in this environment include utility stocks, consumer staples stocks, REITs (real estate investment trusts) as well as bonds. It explains why my fixed income holdings have done so well (especially my gilt holding which Brexit uncertainty has also given a boost). It also explains why M&G Global Listed Infrastructure (with exposure to utilities) and Fidelity Global Property (exposure to REITS) have performed so strongly in an environment where investment risk has not generally been rewarded.
Once again, sticking to a process has continued to help me make a profit in this difficult market. In fact my portfolio now sits at an all-time high in terms of profit. Of course, I am not complacent and appreciate the underlying market drivers could change but with the highest equity exposure I've had in 2019, but with a defensive tilt, I am more than comfortable with how my portfolio is positioned.
So applying the process as usual, the table below shows my portfolio's current allocation, with those funds in green still in the BOTB while those in yellow are not in the BOTB but remain in the BFBS list. Meanwhile, any funds in red have dropped out of both shortlists.
| Fund | Allocation % | Risk | Sector | ISIN Code |
| Fidelity Global Enhanced Income | 5 | Medium | Global Equity Income | GB00BD1NLJ41 |
| Fidelity Global Property | 12 | High | Property Other | GB00B7K2NZ09 |
| M&G Global Listed Infrastructure | 14 | Medium | Global | GB00BF00R928 |
| HSBC UK Gilt Index | 6 | Low | UK Gilts | GB00B4581C50 |
| Janus Henderson Fixed Interest Monthly Income | 10 | Low | Sterling Strategic Bond | GB0001920486 |
| BNY Mellon Real Return | 11 | Low | Targeted Absolute Return | GB0001642635 |
| ASI Emerging Markets Bond | 9.5 | Low | Global Emerging Markets Bond | GB00B5L9HN22 |
| Liontrust Sustainable Future Cautious Managed | 6 | Medium | Mixed Investment 40-85% Shares | GB00BMN90304 |
| ASI Europe ex UK Equity | 3 | High | Europe Excluding UK | GB00B0LG6P37 |
| Fundsmith Equity | 5 | High | Global | GB00B4Q5X527 |
| JPM Emerging Markets | 6 | High | Global Emerging Markets | GB0030881550 |
| TB Evenlode Global Income | 12.5 | Medium | Global Equity Income | GB00BF1QMV61 |
Currently, only one fund does not appear in the 80-20 Investor tables and is coloured red. All of the others remain within the BOTB or the BFBS tables. As such, there is no real reason to alter any of the funds in yellow and green, especially given the performance of the portfolio in the recent bout of market weakness.
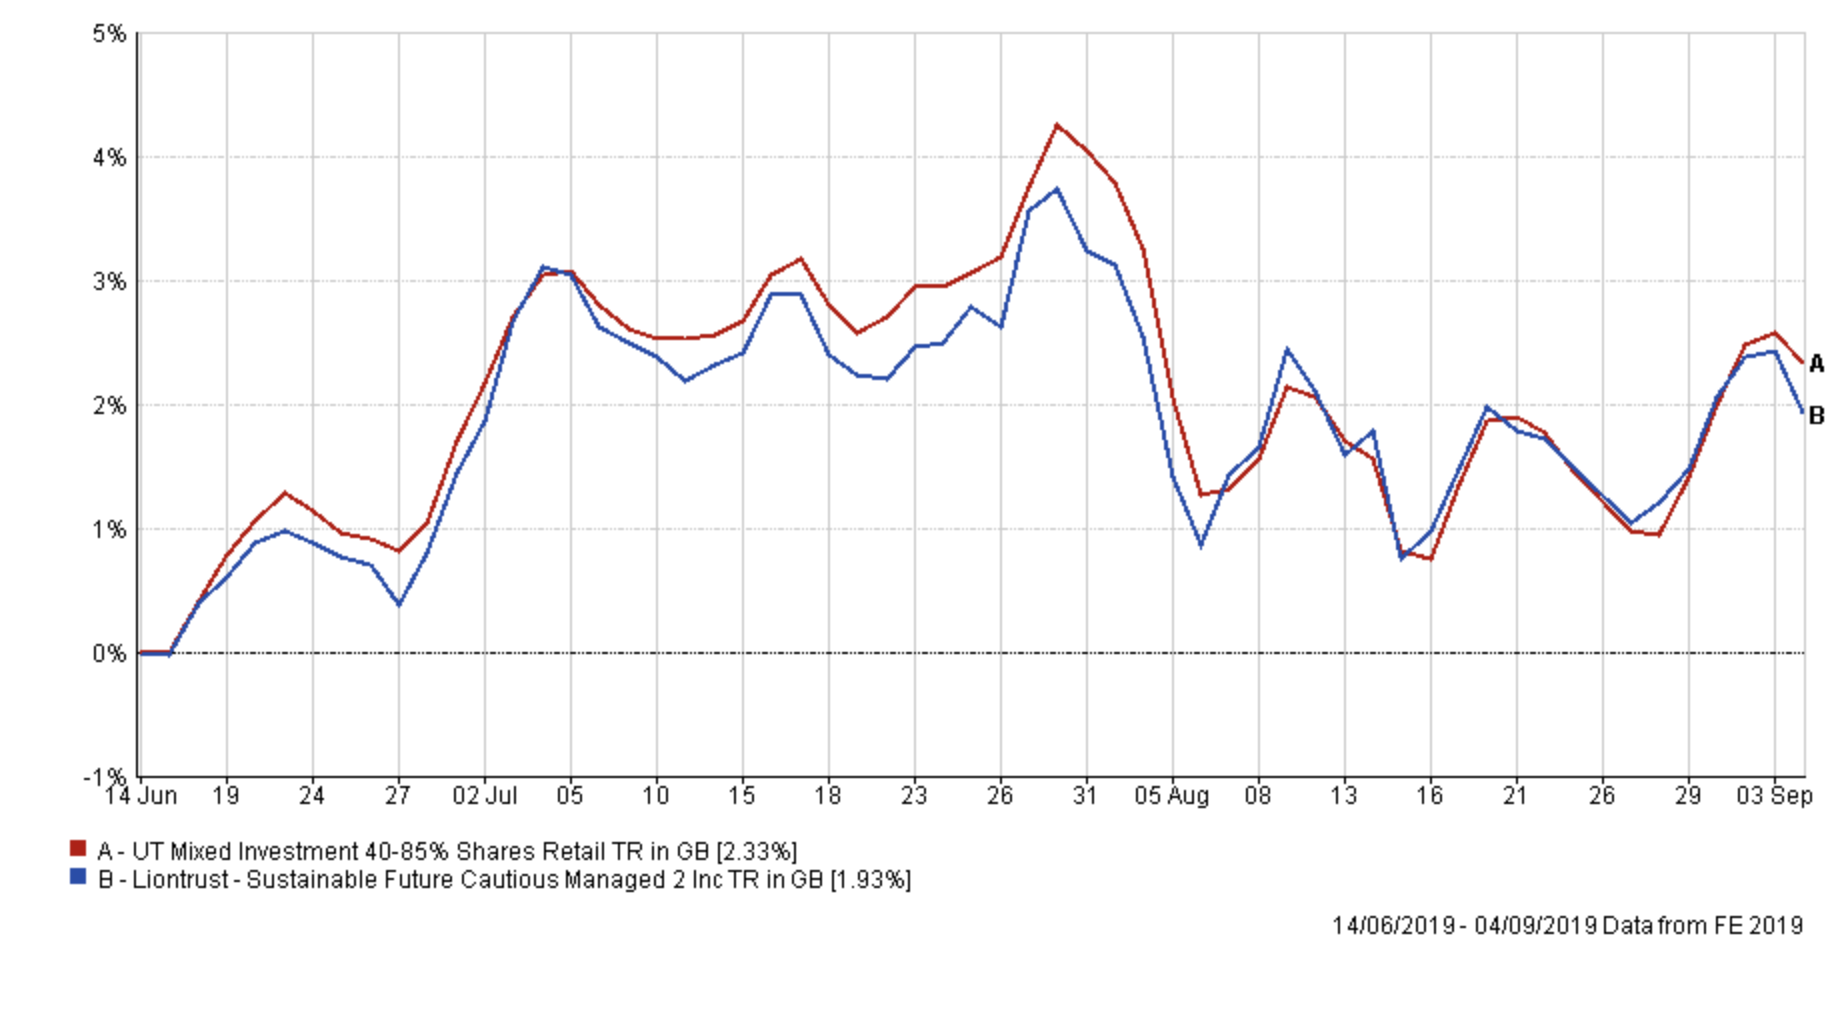
The only fund in red is the Liontrust Sustainable Future Cautious Managed fund which has been on my watchlist for the last couple of months. If we look at how the fund has performed since I've held it (see the chart below) it has pretty much tracked the Mixed Investment 40-85% Shares sector average (the red line). So it's still not a disaster by any stretch.
Given that it only represents 6% of my portfolio and given the overall portfolio's performance I am comfortable just leaving the fund within the portfolio for now, especially given how volatile investment markets are right now
If you recall, last time I looked at the Fidelity Global Enhanced Income as it had been out of the 80-20 Investor tables for a few months. I ultimately decided to maintain its position in my portfolio due to its performance during May's trade tantrum equity sell-off. The patience was rewarded as the fund has now reentered the BFBS tables.
In fact this reflects a wider pattern of the new BOTB now almost mirroring my £50k portfolio. Last time I wrote that "overall the equity/bond profile of my portfolio and the BOTB is still similar with the exception of the emerging market/Asian exposure. This is something I will look at once market volatility has subsided and I next review my portfolio."
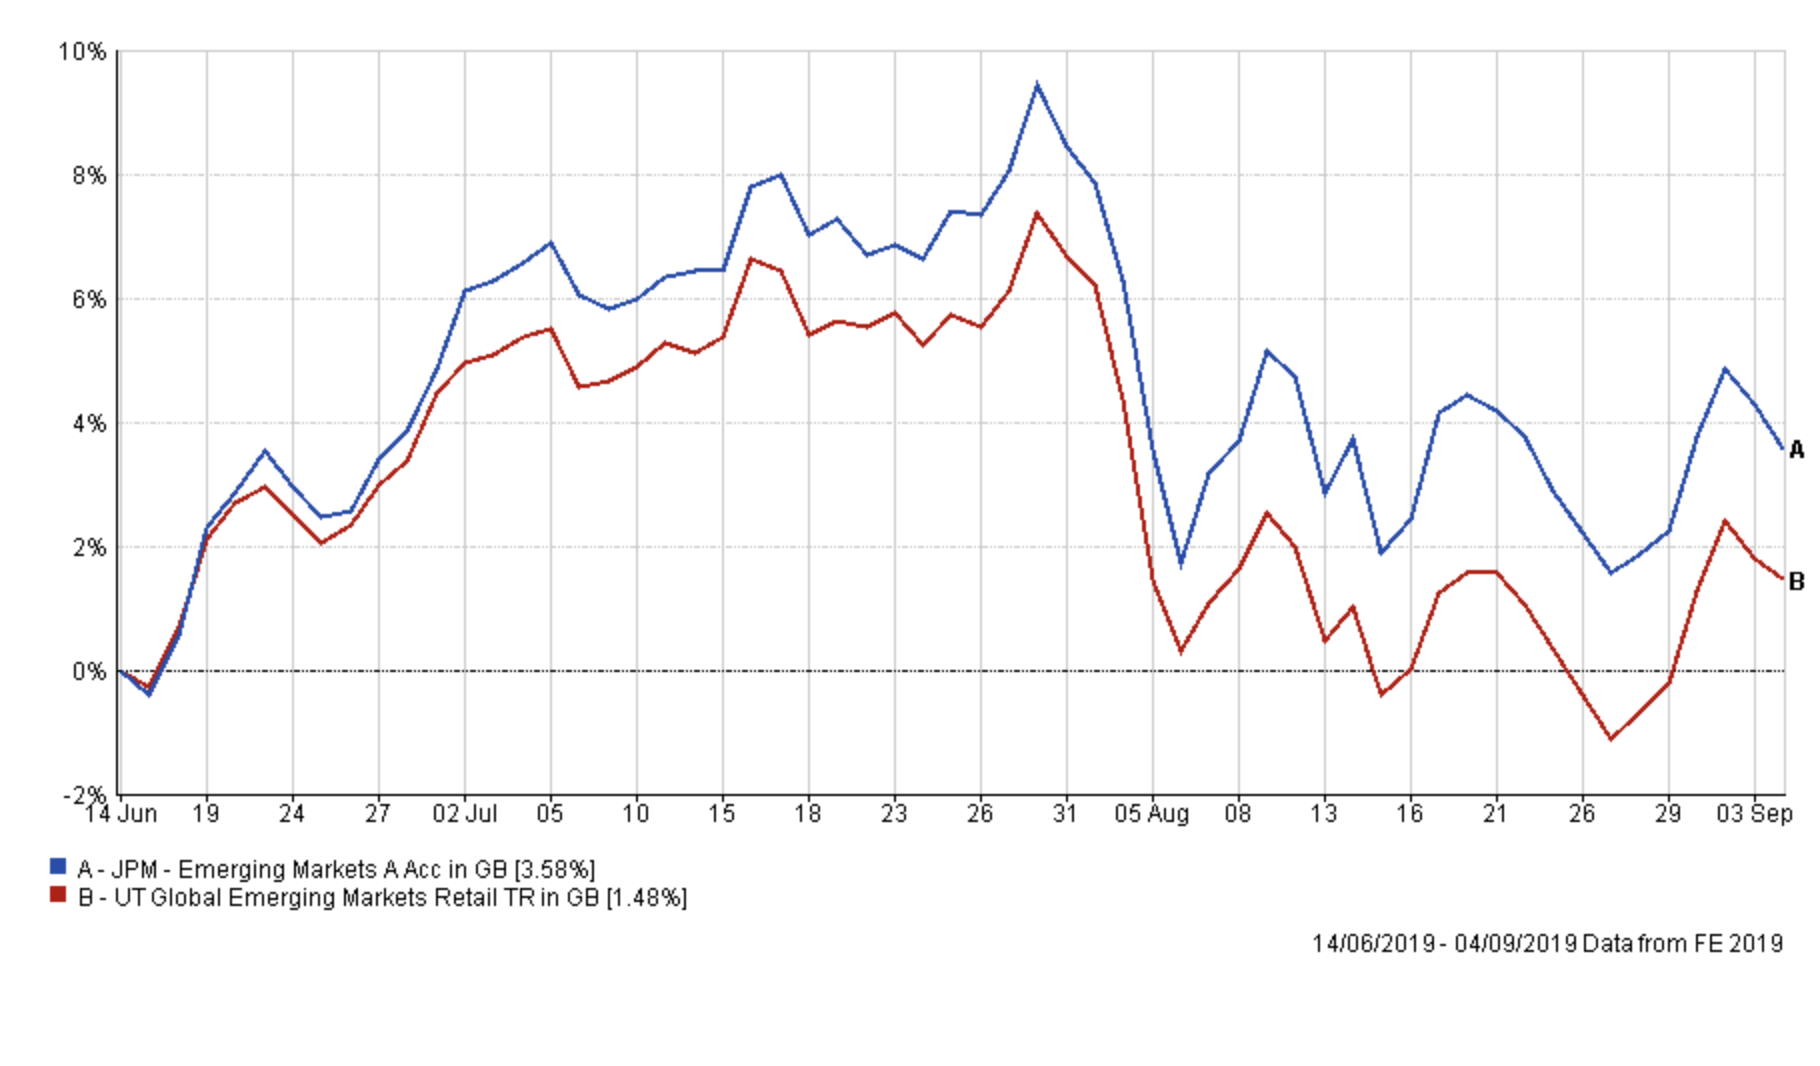
Although market volatility is still raised the latest BOTB portfolio asset mix now is much more closely aligned with my portfolio, meaning that there is less urgency to make changes. The BOTB now has an exposure to gilts and property once again, as does my own portfolio. The only exception remains the JPM emerging market fund (giving my portfolio an emerging market equity exposure) which is being hampered by the strong dollar. But as the chart below shows, this holding still sits in profit, since I've held it, and given it only accounts for 6% of my portfolio I don't feel any need to remove it yet. This may be something I later regret, however, I plan to reconsider its inclusion in my next portfolio review.
Finally, it is once again worth reminding members that there is no compulsion to always make changes to a portfolio as shown in my research piece 'The lazy 80-20 Investor – how often should you change funds?', especially when it is performing well and especially when markets are this volatile. On this occasion, the added bonus is that funds within my portfolio once again represent the core of those within the BOTB.
My portfolio
My portfolio therefore remains:
| Fund | Allocation % | Risk | Sector | ISIN Code |
| Fidelity Global Enhanced Income | 5 | Medium | Global Equity Income | GB00BD1NLJ41 |
| Fidelity Global Property | 12 | High | Property Other | GB00B7K2NZ09 |
| M&G Global Listed Infrastructure | 14 | Medium | Global | GB00BF00R928 |
| HSBC UK Gilt Index | 6 | Low | UK Gilts | GB00B4581C50 |
| Janus Henderson Fixed Interest Monthly Income | 10 | Low | Sterling Strategic Bond | GB0001920486 |
| BNY Mellon Real Return | 11 | Low | Targeted Absolute Return | GB0001642635 |
| ASI Emerging Markets Bond | 9.5 | Low | Global Emerging Markets Bond | GB00B5L9HN22 |
| Liontrust Sustainable Future Cautious Managed | 6 | Medium | Mixed Investment 40-85% Shares | GB00BMN90304 |
| ASI Europe ex UK Equity | 3 | High | Europe Excluding UK | GB00B0LG6P37 |
| Fundsmith Equity | 5 | High | Global | GB00B4Q5X527 |
| JPM Emerging Markets | 6 | High | Global Emerging Markets | GB0030881550 |
| TB Evenlode Global Income | 12.5 | Medium | Global Equity Income | GB00BF1QMV61 |
My asset mix
This means my asset mix is as follows:
-
- UK Equities 9%
- North American Equities 18%
- Global Fixed Interest 9%
- Japanese Equities 0%
- Other International Equities 0%
- Emerging market equities 5%
- European Equities 13%
- UK Fixed Interest 0%
- Cash 4%
- Alternative Investment Strategies 9% (including absolute return)
- Emerging Market Fixed Interest 10%
- Gilts 6%
- Asian equities 5%
- Property 12% - most of which is equities in the US.
Damien's higher risk and low risk portfolios
Using the logic described in my post: Damien’s Higher Risk Portfolio I created higher and lower risk versions of my portfolio by popular demand.
Higher risk
| Fund | Allocation |
| Fidelity Global Enhanced Income | 8 |
| Fidelity Global Property | 19 |
| M&G Global Listed Infrastructure | 22 |
| Liontrust Sustainable Future Cautious Managed | 10 |
| ASI Europe ex UK Equity | 5 |
| Fundsmith Equity | 8 |
| JPM Emerging Markets | 9 |
| TB Evenlode Global Income | 19 |
Lower risk
| Fund | Allocation |
| Fidelity Global Enhanced Income | 7 |
| M&G Global Listed Infrastructure | 19 |
| HSBC UK Gilt Index | 8 |
| Janus Henderson Fixed Interest Monthly Income | 14 |
| BNY Mellon Real Return (formerly Newton Real Return) | 15 |
| ASI Emerging Markets Bond | 13 |
| Liontrust Sustainable Future Cautious Managed | 8 |
| TB Evenlode Global Income | 16 |

£200 Pension Cashback Offer
Make a qualifying deposit or transfer a pension to our partner Interactive Investor.
- Deposit or transfer a pension of at least £20k and you could earn £200 cashback
- Terms and Fees apply, Capital at risk
- New & Existing customers opening a SIPP
- Offer ends 31st July 2026
Before starting your transfer, check you won't lose any valuable benefits (such as guaranteed annuity rates or a lower protected pension age) and find out what exit fees you might have to pay
