

The background to my portfolio
Back in March 2015 I decided to invest £50,000 of my own money using 80-20 Investor. The purpose was twofold, firstly to show how you can use 80-20 Investor to invest and outperform the market with only a few minutes effort every now and then. Secondly, no other investment commentator, journalist or research provider invests their own money for fear of failing. This is a sorry state of affairs and is precisely why I committed to openly running my own portfolio for 80-20 Investor members to see.
Since then I have periodically changed my portfolio using the fund suggestions provided by the 80-20 Investor algorithm and associated research. I always disclose the changes at the time they are made.
Performance update
As is usual in my portfolio reviews, the chart below shows how my portfolio has outperformed since I started the challenge in March 2015, three and a half years ago. The green line is the performance of my portfolio while the red line is the benchmark showing the average return achieved by professional fund managers given the same asset mix. To accurately calculate this I have used the average return for each sector in which my portfolio invested. The blue line shows what the average multi-asset fund with comparable equity content achieved. In other words, the red line would show the extra performance added by just the asset mix of my portfolio (where I was invested i.e European equities etc) over picking a typical multi-asset fund (the blue line). While the green line (which is my actual performance) shows the impact of being in the right funds at the right time, as identified by the 80-20 Investor algorithm.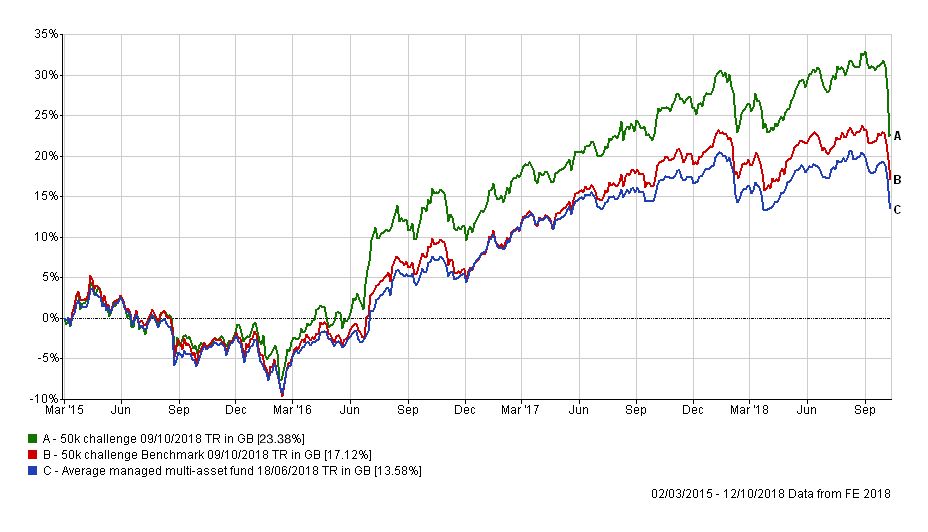
The chart also includes the performance of my portfolio by the end of the market carnage last week which I discussed in my latest newsletter. You can see from the chart above (and comparing it to my portfolio review last week) that I've given up about 2-3% of my outperformance over my benchmarks. Obviously, no one wants to see their portfolio fall in value but it's all relative as my benchmarks have also fallen. Since the start of October 2018, 97.2% of funds out there have lost money irrespective of the underlying assets they invest in. In a market where momentum takes a decisive downward shift then a strategy that has ridden the momentum upwards will underperform unless those 'broken' trends repair themselves or you alter your portfolio.
The question is will the market bounce back and the old trends resume or have we entered a new investment backdrop? That, of course, is the million-dollar question.
First of all, let's look at the performance of the funds in my portfolio since the start of last week. This is shown in the chart below (click to enlarge):
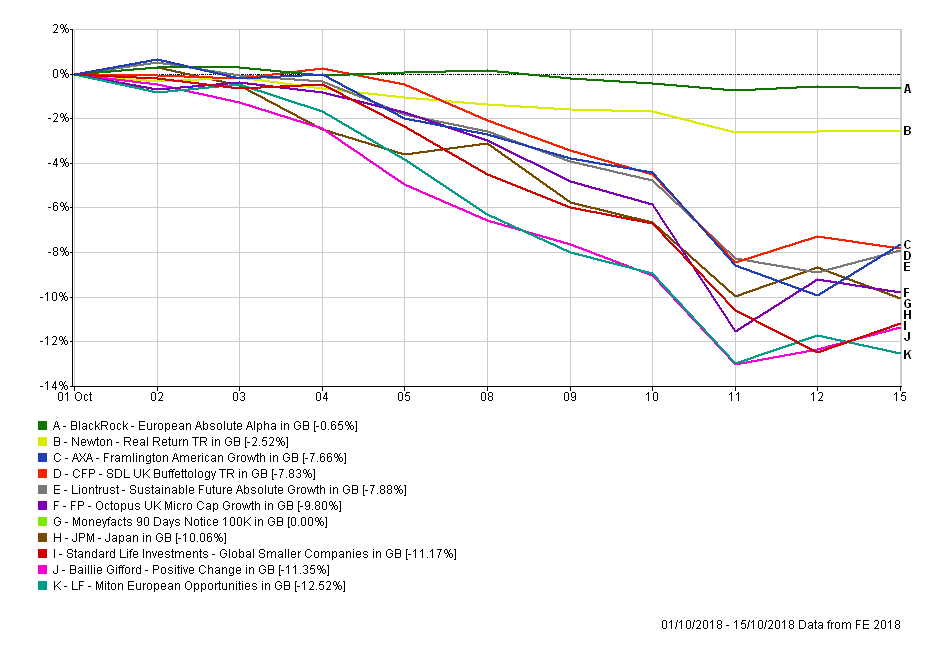
Those of you who receive our stop loss alerts will have noticed that all of the pure equity funds in my portfolio (which were also in the BOTB) triggered stop-loss alerts at some point last week. In fact, the sheer number of stop loss alerts issued last week was unusual. In the first 12 days of this month, 21 of the 30 funds in the BOTB have had a stop loss triggered. That compares to 20 during the market rout in the spring.
The severity of the market sell-off led to a small bounceback at the end of the week. As I've discussed in this week's newsletter, the reason for the market wobble was a repricing of assets, based on the view that the US Federal Reserve would raise interest rates faster than previously thought. What made the current sell-off interesting is that from a technical analysis perspective a number of key support lines were breached as the US stock market tumbled. The rate at which these support levels fell was alarming and may suggest that more pain could follow.
However, at the time of writing the S&P 500 has managed to claw its way back above its 200-day moving average (closing below this line is a bearish indicator) and sits on the rising support line that marks the uptrend that started in 2016. While we have fallen below the 200-day moving average previously this year the market managed to regain its poise. It has also consistently bounced higher off the upward sloping support line which started in 2016, eventually setting new all-time highs. We saw this happen after February's initial sell-off.
Having said that, the odds of the current bull market finally coming to an end are arguably higher now than in other recent breakdowns. The fact that we saw a decline in upward momentum in key sectors after hitting new highs is ominous. The divergence in sector performance too (tech has been struggling since September) is a warning light as is the fact that it eventually led to momentum being lost across the entire market. We also aren't yet seeing the sector rotations we'd like to see which could give the bull market new energy. Don't forget all the support lines on the way down that were breached are now resistance lines which makes rebounding to new highs all the more tricky.
That doesn't mean that markets won't rebound from here. However, it's prudent to acknowledge that US equities could be entering the early stages of a bear market or a choppy consolidation phase. Bear markets are bad for equities. The trouble is you never know when a bull market ends until after the event. We only had confirmation that the US bull market was still intact after February's sell-off months after the event.
It is a useful exercise to look back to February 2018 and see how I weathered the storm. In times of uncertainty, it becomes more a case of risk management rather than going for broke. That means reevaluating your portfolio objectively and making adjustments. A good process which is one that I followed in February is to:
- increase cash positions
- increase bond exposure
- build hedges
- sell losers and trim winners
- reduce equity exposure
The process means that you still remain invested in the market but your portfolio will be impacted by any rallies or renewed sell-offs to a lesser extent. Once you have confirmation that the bull market has resumed it is possible to unwind the changes by increasing the equity exposure, reducing hedges and redeploying cash. This is what I did in February. It's not to say it is always the best strategy from a portfolio return perspective but it is sensible from a risk management (and capital preservation) viewpoint. Interestingly my timing during the spring sell-off was impeccably bad as I actually reduced risk almost at the bottom of the market slump before it began to rally,
At the time I wrote:
...with the correlation between the funds in my portfolio increasing I am keen to reduce this, in case we experience the Armageddon scenario of a 20-30% fall in equity markets from here. It is for that reason that I plan to make the move out of the following funds and into cash until the next publication of the new BOTB in a few weeks. Cash is the only low-risk asset that hasn't tracked equity markets lower.
The situation sounds oddly familiar, doesn't it.
However, after reducing risk in February I then took my foot off the brakes during the summer upturn to ride the momentum higher which eventually resulted in my Septemeber portfolio review where I hit new all-time profit highs and I was outperforming 90% of the funds within the Mixed Investment 40-85% Shares sector. Perhaps that was an indicator of an impending market top?
To use an analogy, we've been cruising along the motorway in the fast lane comfortably all summer after navigating the last crash and now we have hit some fog. Accelerating into the fog (increasing investment risk) or pulling up the handbrake (cashing out and missing a possible rally) are both potentially disastrous moves. It's prudent to hedge your bets and take your foot off the accelerator and reduce your speed in order to assess the danger. All the time still moving forward but not increasing your speed until you get confirmation that you are not heading into a pile-up of cars.
So what does this mean for my portfolio? If you look at the latest BFBS tables, which were updated on Friday, you can see that they are more sparse than usual. A sign of the sudden fall in momentum. That doesn't mean that there aren't opportunities but they are limited and most won't fully protect you if equity markets encounter an Armageddon-like 20-30% fall in the coming weeks or months. Don't forget the BOTB fund selection is updated at the start of each month, although the performance data for the funds is updated weekly.
Fund switches
Taking all of the above into account I have taken the decision to make the following fund switches:
- 60% out of LF Miton European Opportunities and into Thesis TM Sanditon European Select
- 100% out of AXA Framlington American Growth and into LF Canlife North American
- 100% out of Liontrust Sustainable Future Absolute Growth and into Man GLG Corporate Bond
- 100% out of Baillie Gifford Positive Change and into cash
- 100% out of Standard Life Investments Global Smaller Companies and into cash
I will explain the reason for my decision for each in turn:
Cashing out of Baillie Gifford Positive Change and Standard Life Investments Global Smaller Companies
Both these funds had a torrid time during the sell-off as smaller company focused funds were hit hard in the sell-off. Sometimes it is best to admit objectively (the stop loss alerts helped) when something is no longer working rather than hope for a rebound. With my desire to raise my cash position temporarily they were the obvious candidates to sell. It does mean that I crystalise the losses on both funds since I've held them, despite them once being very profitable, with the Baillie Gifford fund down 10% and the Standard Life fund down 6.8%. It could end up that I've cashed out too early, but only time will tell.
100% out of AXA Framlington American Growth and into LF Canlife North American
Despite the sell-off, this fund is up more than 12% since I first bought it in March. Given that the fund made up almost 13% of my portfolio (more than eclipsing the total exposure of the Standard Life and Baillie Gifford funds) the profits offset the losses I'm crystalising above. The AXA fund remains in the BFBS for now but it is a technology focussed fund. Technology stocks were long overdue a sell-off and we are experiencing that. Tech stocks may come roaring back but it is prudent to finally diversify away from such an interest rate-sensitive sector into a fund that is more defensive in nature. The LF Canlife North American fund is in the BFBS tables now and to give you some context during last week's market lows the Canlife fund was down just 5.5% (making it one of the best performing US equity funds) versus 9.9% for the AXA fund. So this switch is not about selling out of the market but moving away from a reliance on growth focused sectors such as tech and investing in those that have more value and more defensive characteristics.
100% out of Liontrust Sustainable Future Absolute Growth and into Man GLG Corporate Bond
The Liontrust fund hasn't delivered in this downturn. Furthermore, I want to reduce the overall risk profile of my portfolio. The Liontrust fund is medium risk while Man GLG Corporate Bond is a low-risk fund that invests in bonds. While bond markets have struggled of late I am choosing to invest in a bond fund to diversify my asset mix. The Man GLG fund appears in the BOTB (although I place less emphasis on the BOTB right now as it would look very different if updated today) and has held up surprisingly well during the bond rout. If bond yields continue to spike it won't bode will for bonds but there comes a point where they may once again become a haven trade if equity markets tumble further. Just like equities, it's difficult to say which way bond markets will go at the moment having endured a torrid week/few months. However, my portfolio's new allocation to global bonds only takes it to the same as the BOTB (pre-crash) and at 10% I am still clearly erring on the side of caution.
60% out of LF Miton European Opportunities and into Thesis TM Sanditon European Select
This is an interesting one. European equities have struggled of late especially in the face of renewed Brexit angst and the ongoing Italian political risks. The LF Miton fund had been a very profitable position (up over 6% at one point) since I'd first held it in June. The sell-off now means the fund is sitting on a loss. As it was a high momentum trade (and labelled as high risk in the BOTB) its dip is not surprising. So I've decided to drip out of the fund, acknowledging that the market could rally from here, and hedging my position by investing in the Thesis fund mentioned. The fund has just crept into the BFBS and is one of the few funds to actually make money so far in October because it takes long and short positions in European equities. By hedging some of my European equity exposure I remain net long but with some downside protection. Interestingly the Thesis fund is a stablemate of a fund identified in my research piece 'Funds for a falling market'. So by combining the research within 80-20 Investor and the data tables I am hedging my equity exposure. We talked earlier about the possibility of US equities entering a bear market but we have to realise that we've already seen them elsewhere, for example in China. In fact, Reuters now claim that half of Europe's biggest stocks are in bear markets. So, for now, I will hedge my exposure, to limit my losses should markets tumble from here, and look to remove the hedge should Armageddon be avoided and stocks rally. The fund switch also reduces my portfolio's risk profile as the Thesis fund is medium risk (as opposed to high risk like the Miton fund)
The overall result is that I am temporarily boosting my cash position, waiting for positive momentum to pick up while reducing my equity exposure overall, principally in the US and Europe. The beneficiaries are bonds, cash and hedging strategies. In terms of direct equity exposure (ie.not via absolute return and hedging strategies) I now have 41% in equities which is the lowest level since the equity bloodbath in January 2016, when I reduced my equity weighting down from 70% equities to 40%. Interestingly, my new portfolio now has a passing resemblance to the lower risk version of my portfolio as it was before of the sell-off.
My new portfolio
My new portfolio looks like this:
| Fund | Allocation % | Risk | Sector | ISIN Code | SEDOL Code | Citicode / TIDM |
| BlackRock European Absolute Alpha | 8 | Low | Targeted Absolute Return | GB00B4Y62W78 | B4Y62W7 | EYN0 |
| CFP SDL UK Buffettology | 12.6 | Medium | UK All Companies | GB00B3QQFJ66 | B3QQFJ6 | MJZ1 |
| JPM Japan | 3.2 | High | Japan | GB0030879471 | 3087947 | RT06 |
| FP - Octopus UK Micro Cap Growth | 5 | High | UK Smaller Companies | GB00BYQ7HN43 | BYQ7HN4 | NFZH |
| LF Miton European Opportunities | 4 | High | Europe Excluding UK | GB00BZ2K2M84 | BZ2K2M8 | MSED |
| Newton Real Return | 6.8 | Low | Targeted Absolute Return | GB0001642635 | 164263 | BS97 |
| Thesis TM Sanditon European Select | 6 | Medium | Targeted Absolute Return | GB00BNY7Y722 | BNY7Y72 | KMPQ |
| Man GLG Corporate Bond | 12.3 | Low | Global Bonds | GB00B0118B85 | B0118B8 | AX76 |
| LF Canlife North American | 12.6 | High | North America | GB00B73N3278 | B73N327 | 0YMD |
| Cash | 29.5 | Low | N/A | N/A | N/A | N/A |
My new asset mix
This means my new asset mix is (previous asset mix is in brackets):
-
- UK Equities 17% (19%)
- North American Equities 14% (23%)
- Global Fixed Interest 14% (2%)
- Japanese Equities 4% (5%)
- Other International Equities 0% (0%)
- Asian equities 1% (1%)
- European Equities 5% (14%)
- UK Fixed Interest 0% (0%)
- Cash 33% (23%)
- Alternative Investment Strategies 12% (13%)
- Emerging Asia equities 0% (0%)
- Emerging Market Fixed Interest 0% (0%)
- Property 0% (0%)
If you are looking for the notional high and low-risk versions of my £50k portfolio which are often published with these updates then see the question and answer (regarding their omission) in this month's Chatterbox.

£200 Pension Cashback Offer
Make a qualifying deposit or transfer a pension to our partner Interactive Investor.
- Deposit or transfer a pension of at least £20k and you could earn £200 cashback
- Terms and Fees apply, Capital at risk
- New & Existing customers opening a SIPP
- Offer ends 31st July 2026
Before starting your transfer, check you won't lose any valuable benefits (such as guaranteed annuity rates or a lower protected pension age) and find out what exit fees you might have to pay
