

Long-time 80-20 Investor members will know I am always keen to hear your research ideas as they can be fantastic fodder for future articles.
In September's Chatterbox a member asked the following question:
Hi,
Your April article “Navigating market tops and bottoms” which is one of the best you’ve done, in my view, was very thought provoking. Your backtest found that overall performance was similar (total growth) but drawdown was greatly reduced. Wow, that’s quite a result! This type of market filter performance has also been found by other sources both online and in print, and I wonder whether you would go a bit further as it seems to have great potential? For example how would your portfolio have been affected if you were to invest only in high risk or high and medium risk funds when S&P above the 10 month m.a. and only in low risk or cash when below the 10 month m.a. Would this affect the risk adjusted return, or is it not worth the effort?
Keep up the great work, I find the subscription to be well worth it!
Thanks.
The 'Navigating market tops and bottoms' article seemed to strike a chord with many of you. So I thought the above suggestion was an intriguing one and while I did not initially know the answer to the questions posed some of the best research is born out of analysing historic data to see what it throws up. Not only do the results often surprise you and provide new insights but they also aren't tainted by inherent biases or conventional wisdoms.
To shed some light on the question I had to recreate historical versions of my £50k portfolio using the 10-month moving average as an indicator to increase or decrease risk. For ease I will use the abbreviation of 10mma in place of writing the '10 month moving average' for the rest of this article. If you read the original 'Navigating market tops and bottoms' article it explains how the indicator can be applied. In summary, if on a monthly basis an index closes above its 10-month moving average line then it suggests that you should remain invested in the market. If however, it closes below the 10-month moving average line then it's a sign to reduce risk and or move into cash. The index used in my analysis is the S&P 500 and the chart below shows the latest path of this indicator.
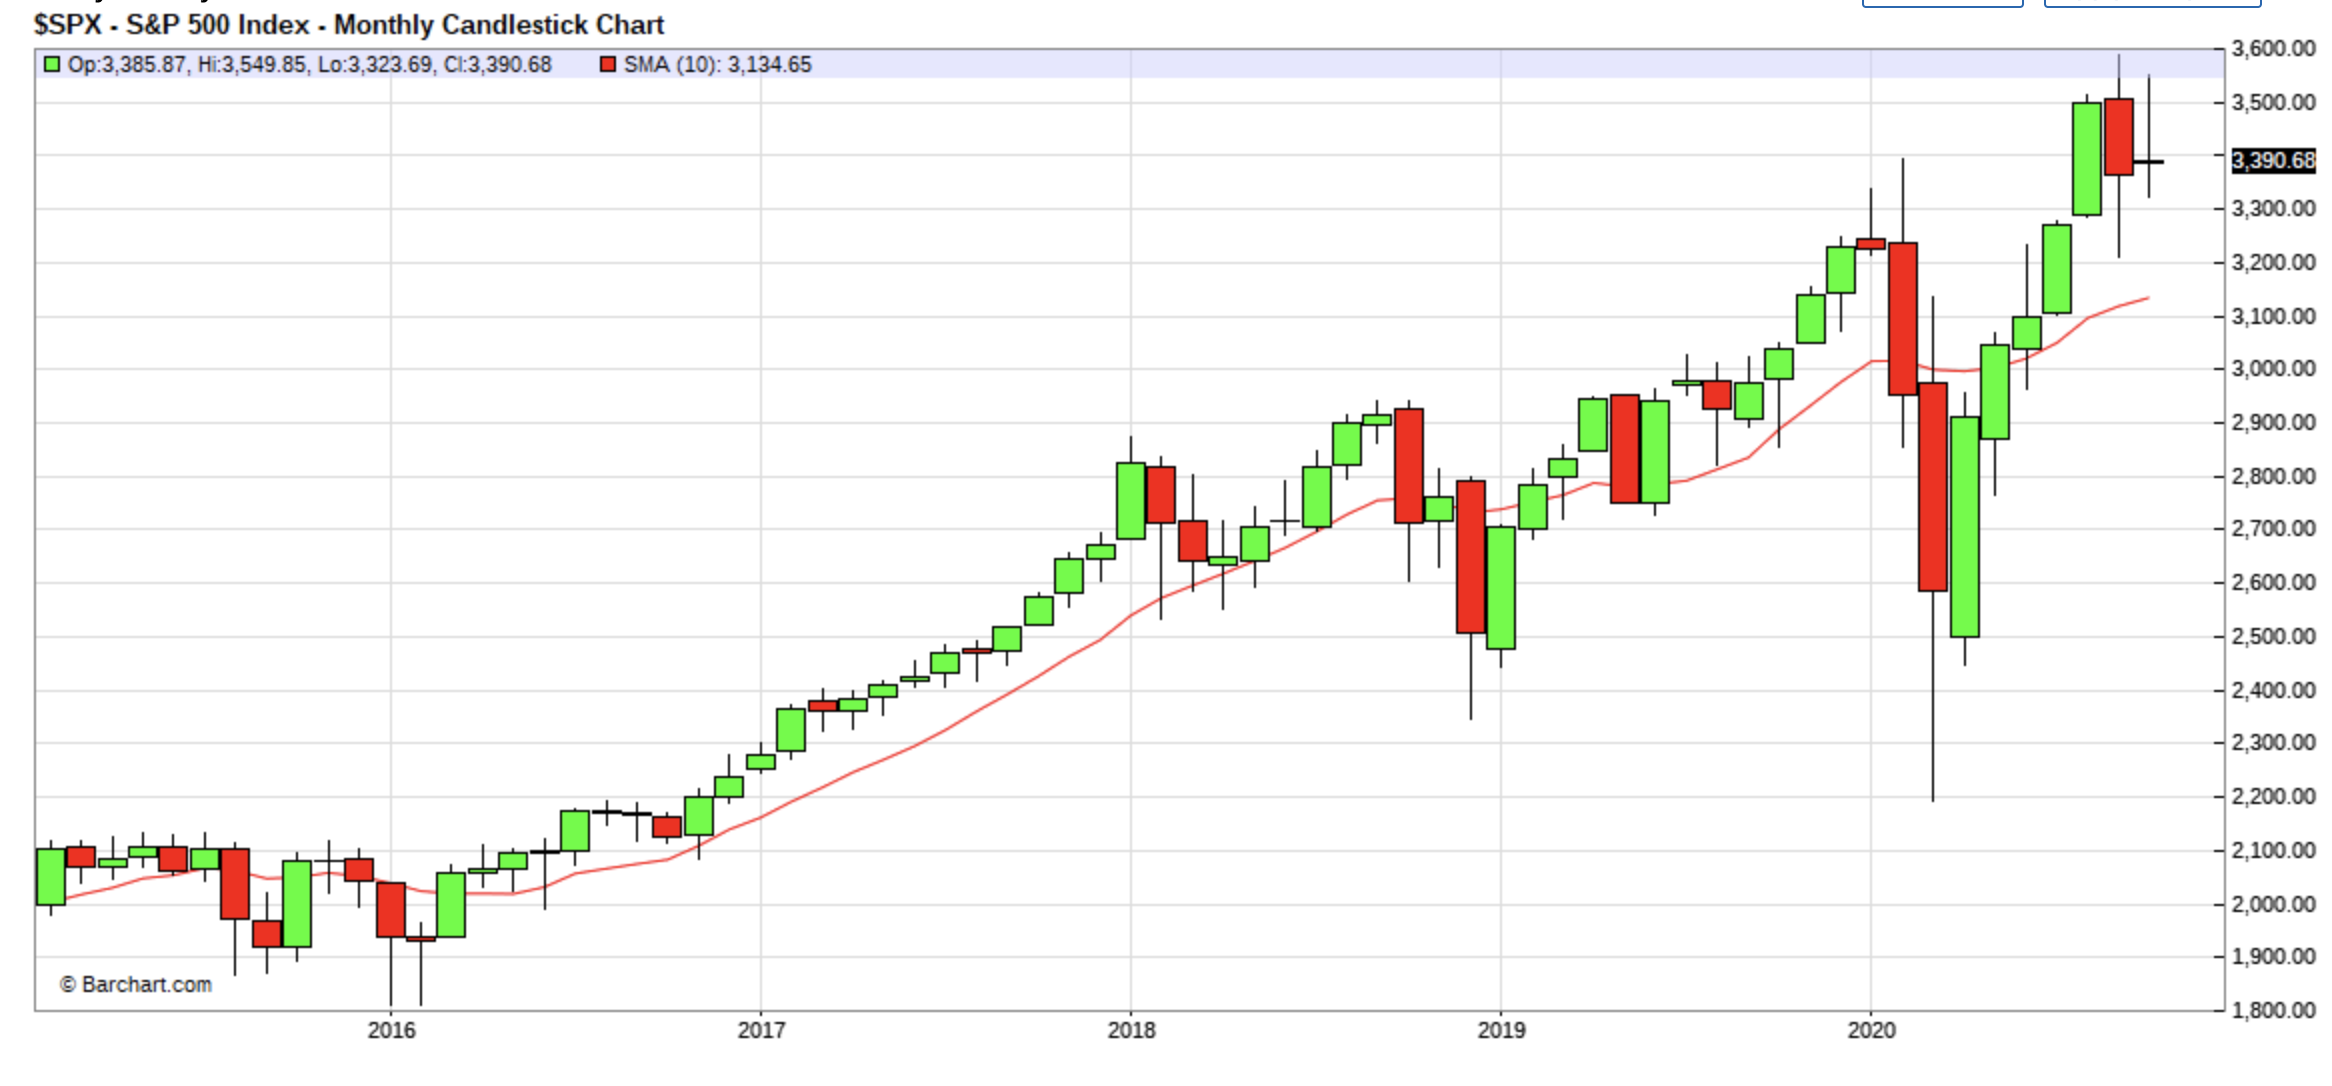
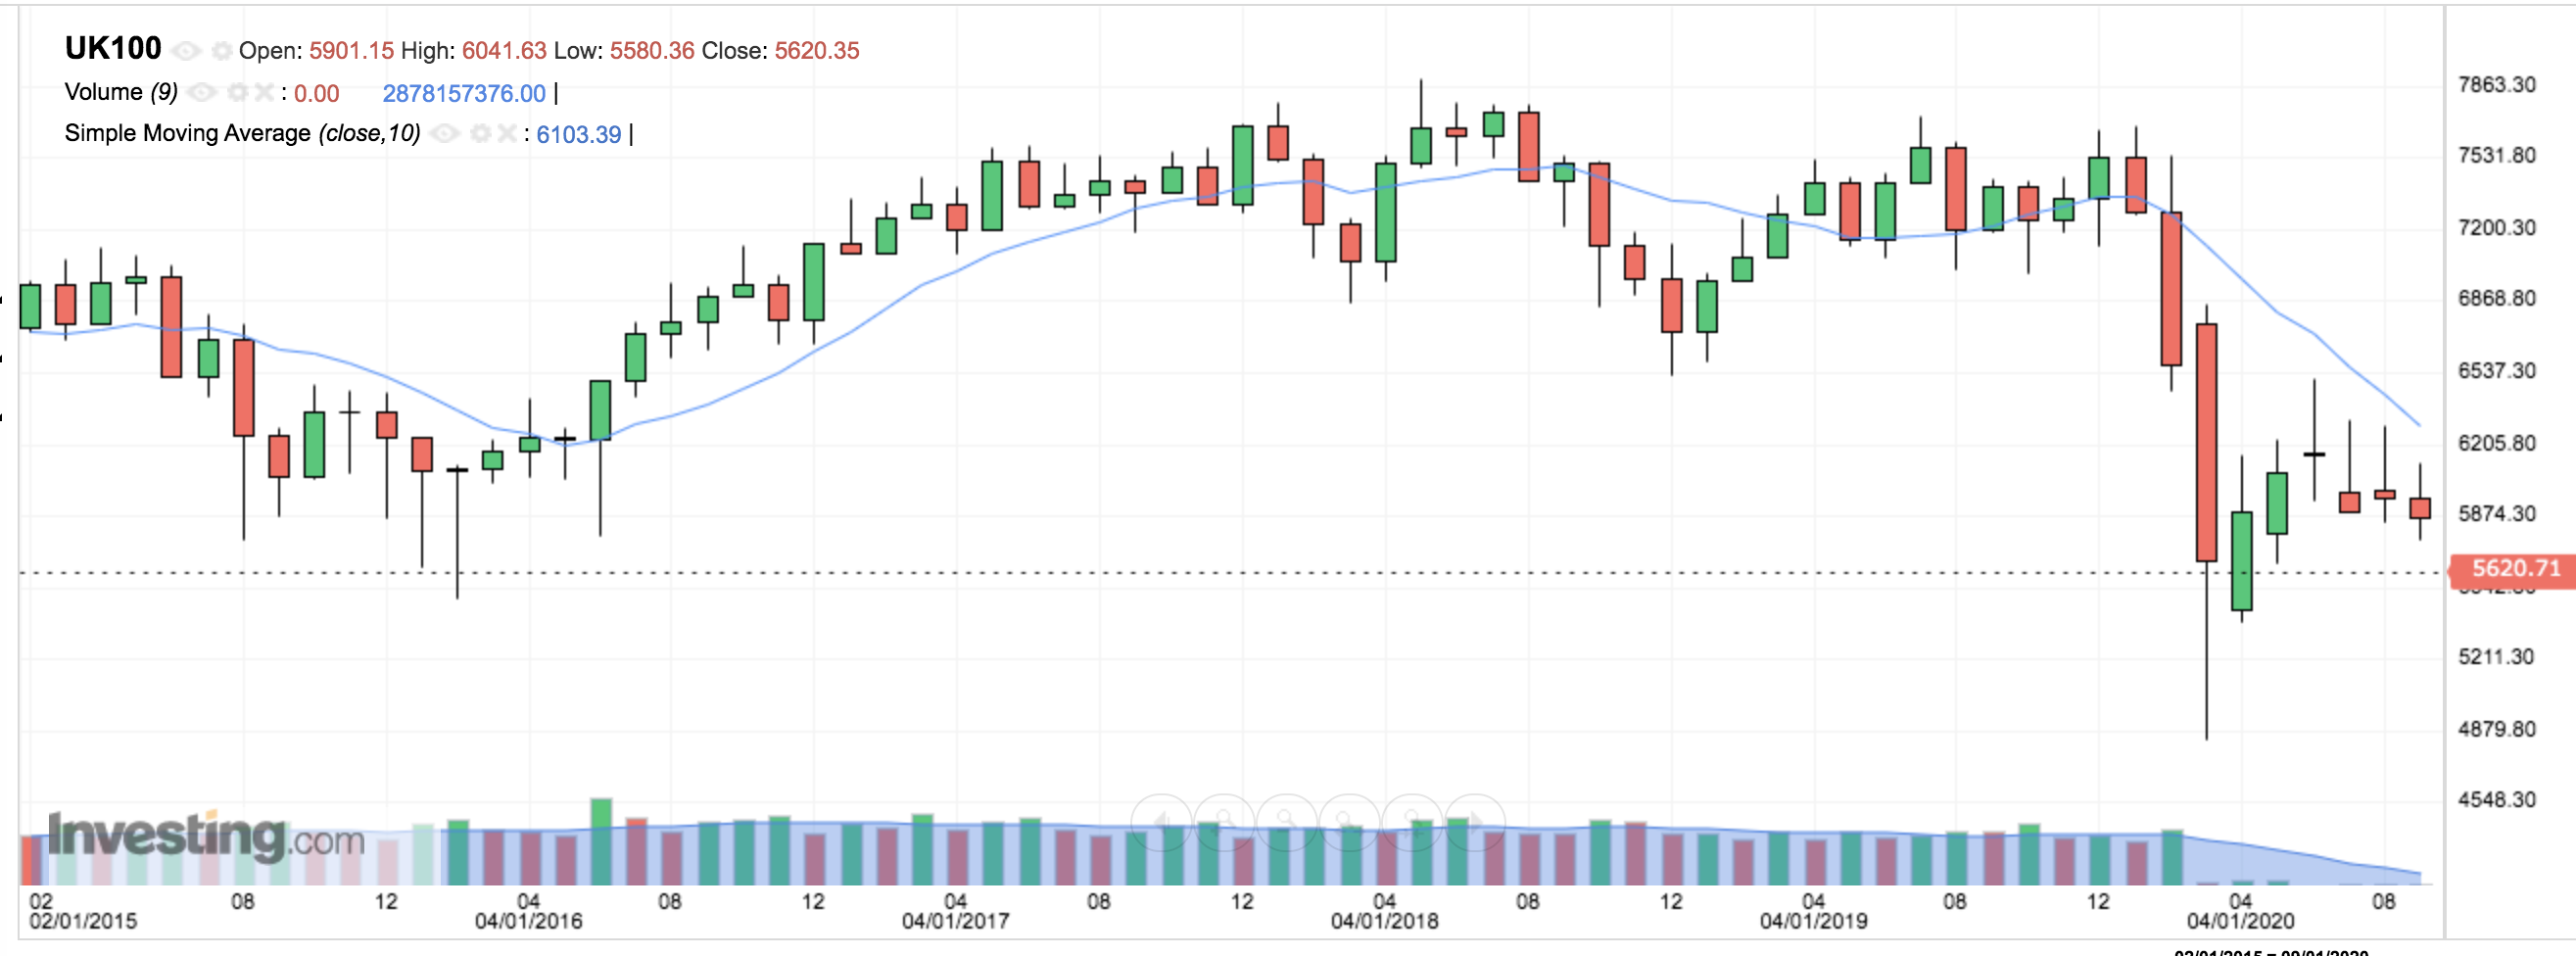
Although we are UK investors, the 80-20 Investor process means that we invest globally. For example, right now my portfolio almost has no UK equity exposure while having its largest equity exposure to the US. That means that the S&P 500 has relevance to us as an indicator. But more importantly, the US is the largest equity market in the world and global equities tend to be led by it. So even if you do not invest in the US then using the S&P 500 as an indicator still has merit. After all, don't forget that the widely talked about market fear gauge (the VIX) is derived from the S&P 500 too. In addition, it could be claimed that the FTSE 100, for example, has been in a bear market since 2018. Below is the same chart as above but replicated using the FTSE 100 as the indicator. You can see that it if you'd used the FTSE 100's 10mma you'd have spent most of recent history in cash and missed out on equity rallies in other markets.
So assuming the use of the S&P 500 and its 10mma here is a list of when an investor would have entered and exited the market since I've been running my £50k portfolio.
| Date switched out of the market | Date switched back into the market |
| 1-9-2015 | 1-11-2015 |
| 1-1-2016 | 1-4-2016 |
| 1-11-2018 | 1-12-2018 |
| 1-1-2019 | 1-3-2019 |
| 1-6-2019 | 1-7-2019 |
| 1-3-2020 | 1-6-2020 |
Using these dates I created a number of portfolio/scenarios to answer the Chatterbox question.
Portfolio 1 - £50k/cash portolio
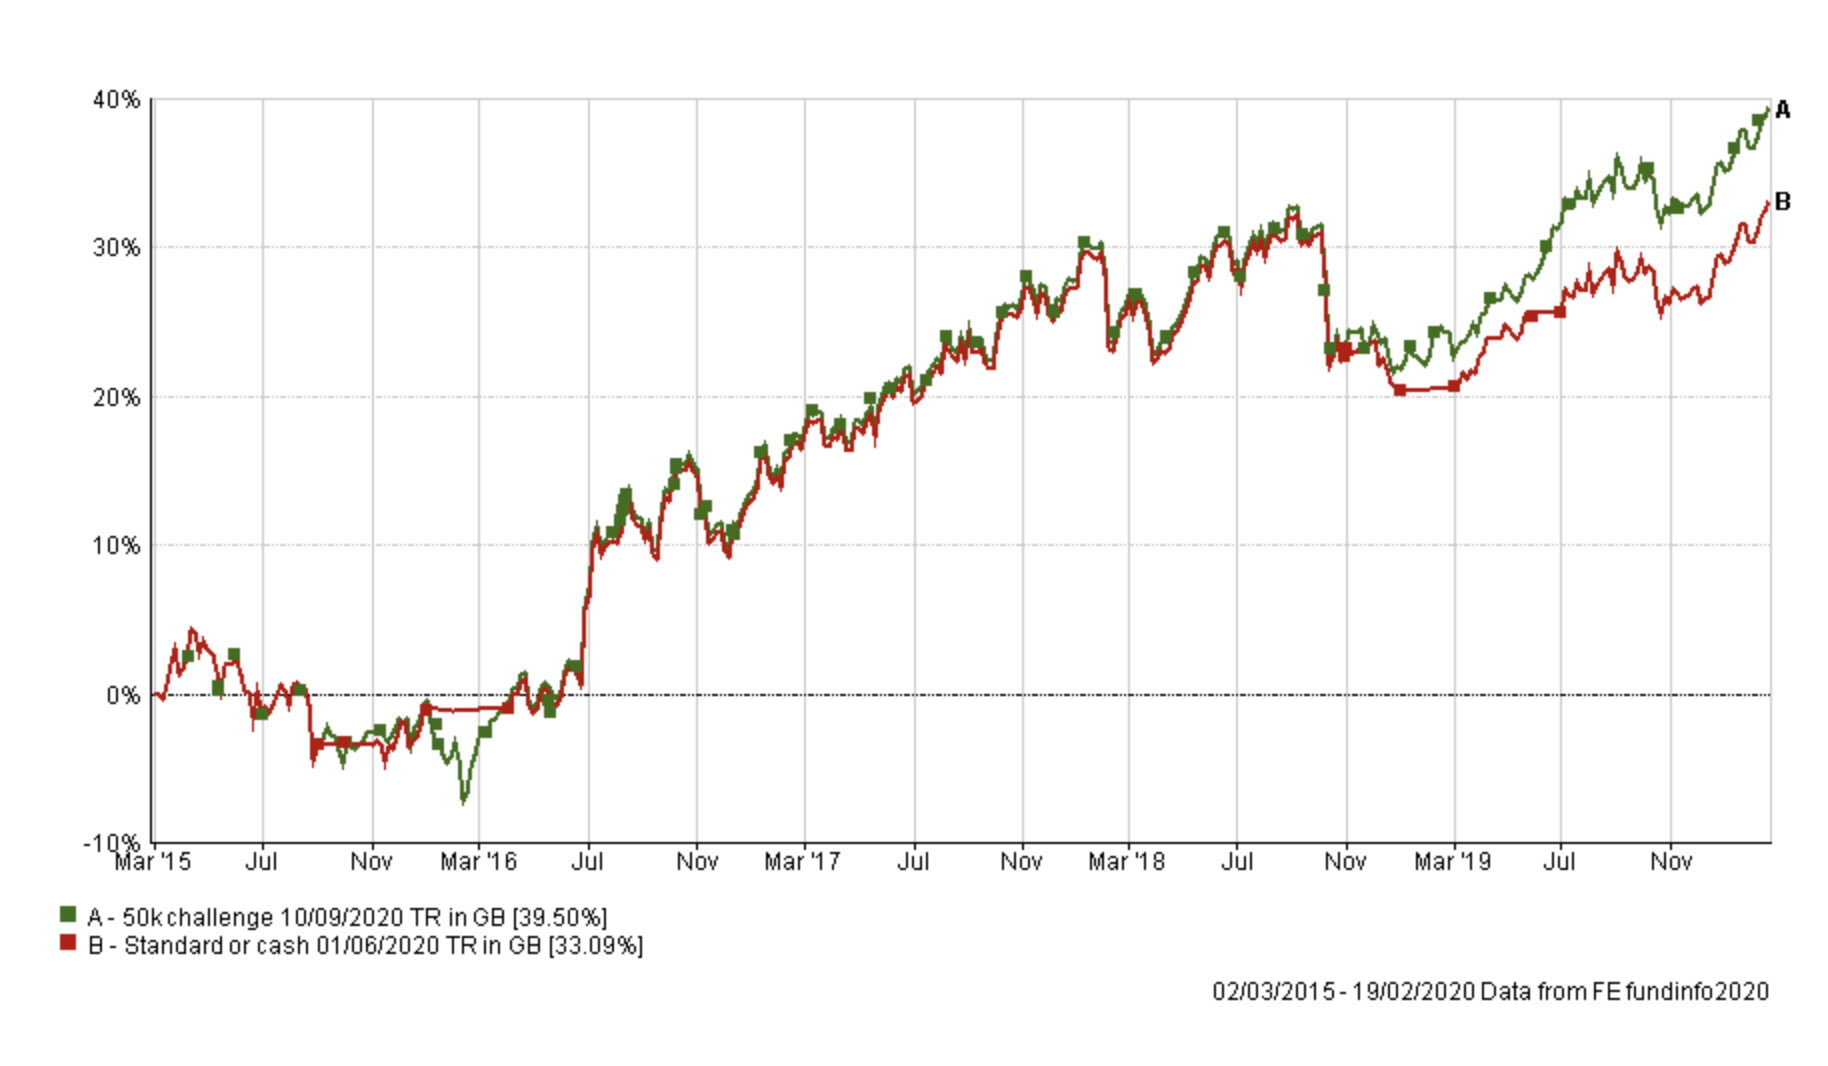
The £50k/cash portfolio is assumed to have been invested as per my normal £50k portfolio but with one difference. Whenever the 10mma indicator flashed a warning of a market top, at the start of a month, I would assume that the portfolio switched to 100% cash until the indicator gave the all-clear. Once it had I then assumed the portfolio was 100% invested in accordance with my £50k portfolio. The green line shows the actual performance of my £50k portfolio since inception versus the £50k/cash portfolio in red.
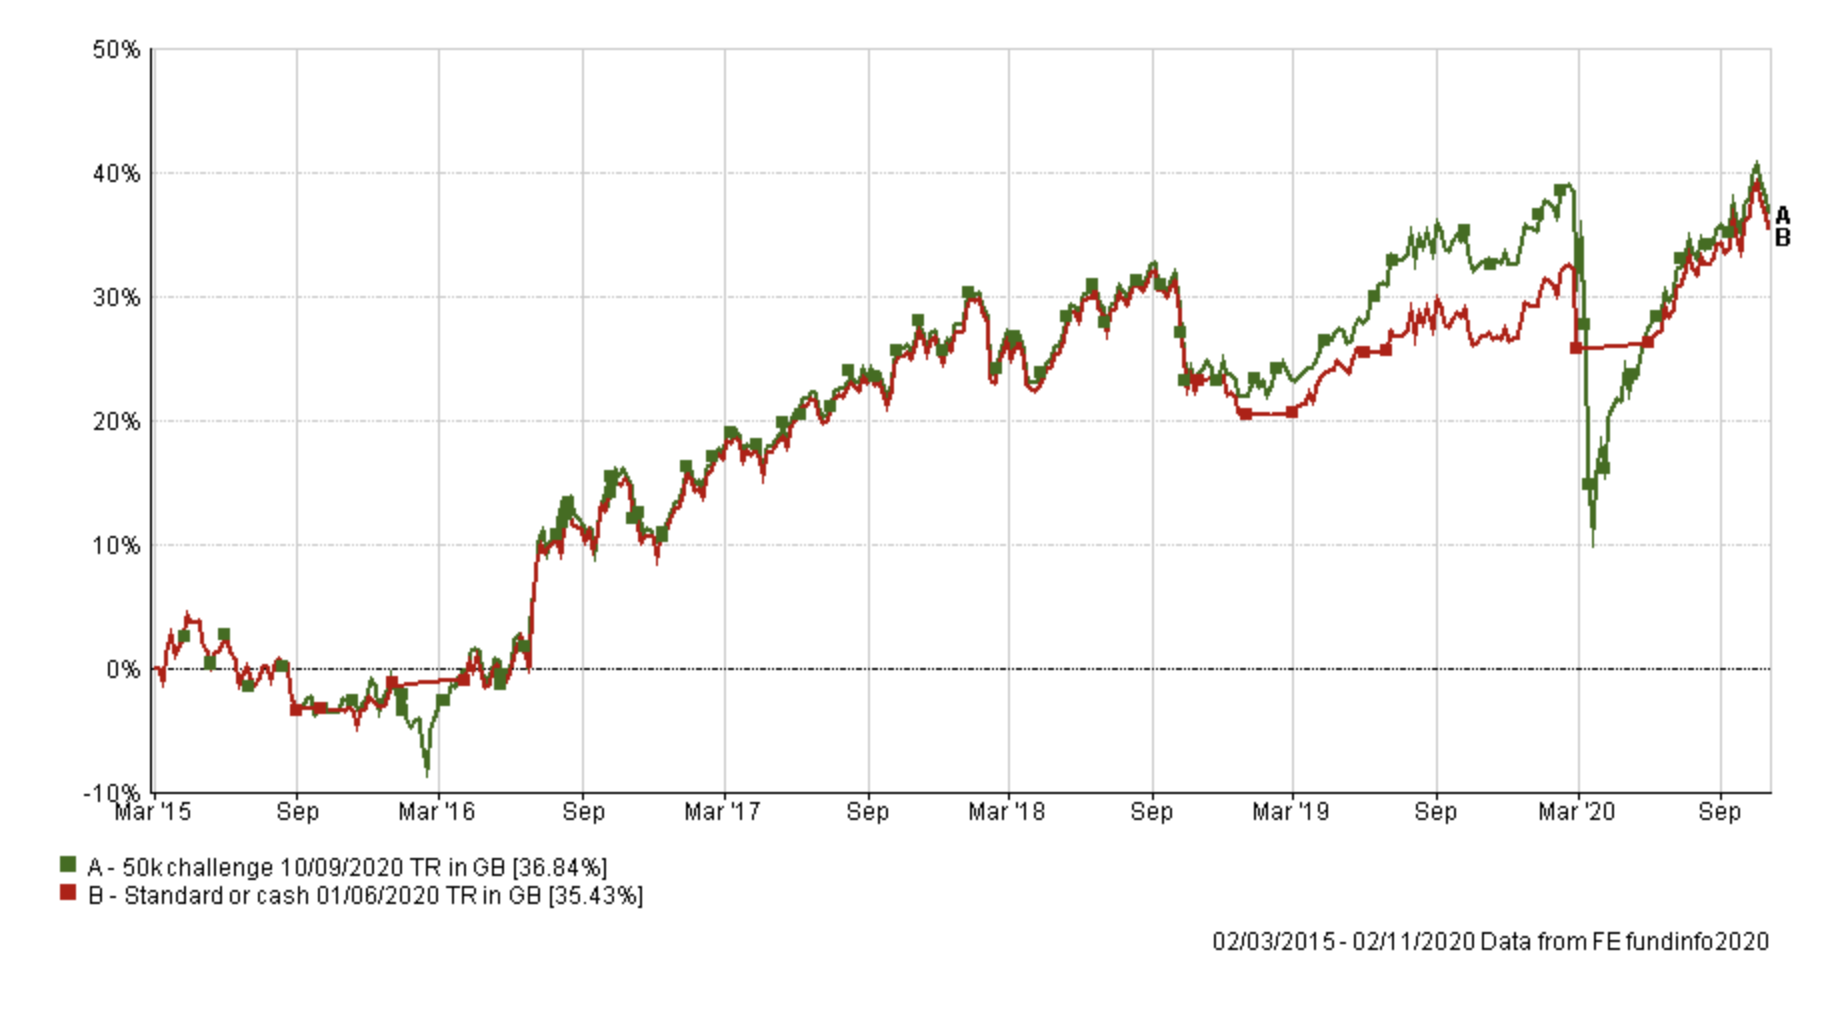
You may be surprised to see that my £50k portfolio outperformed, albeit marginally, given the size of the market fall in the spring. The result backs up the adage that 'it's time in the market not timing the market' that is most important. Or in other words, as a long term investor it suggests that the best thing to do is stay invested during a market crash. This is backed up by my previous extensive research 'The best strategy in a stock market crash – Stick or Twist?' in which I analysed market moves going back more than 30 years.
But interestingly in 2020 you can see that the £50k/cash portfolio missed the worst of the fall but also missed a significant part of the rebound. However, it did re-enter the market at a lower level to that which it exited in the market crash. Which is obviously a good thing as the market rose higher. The year to date performance of both portfolios (see below) shows this particularly well.
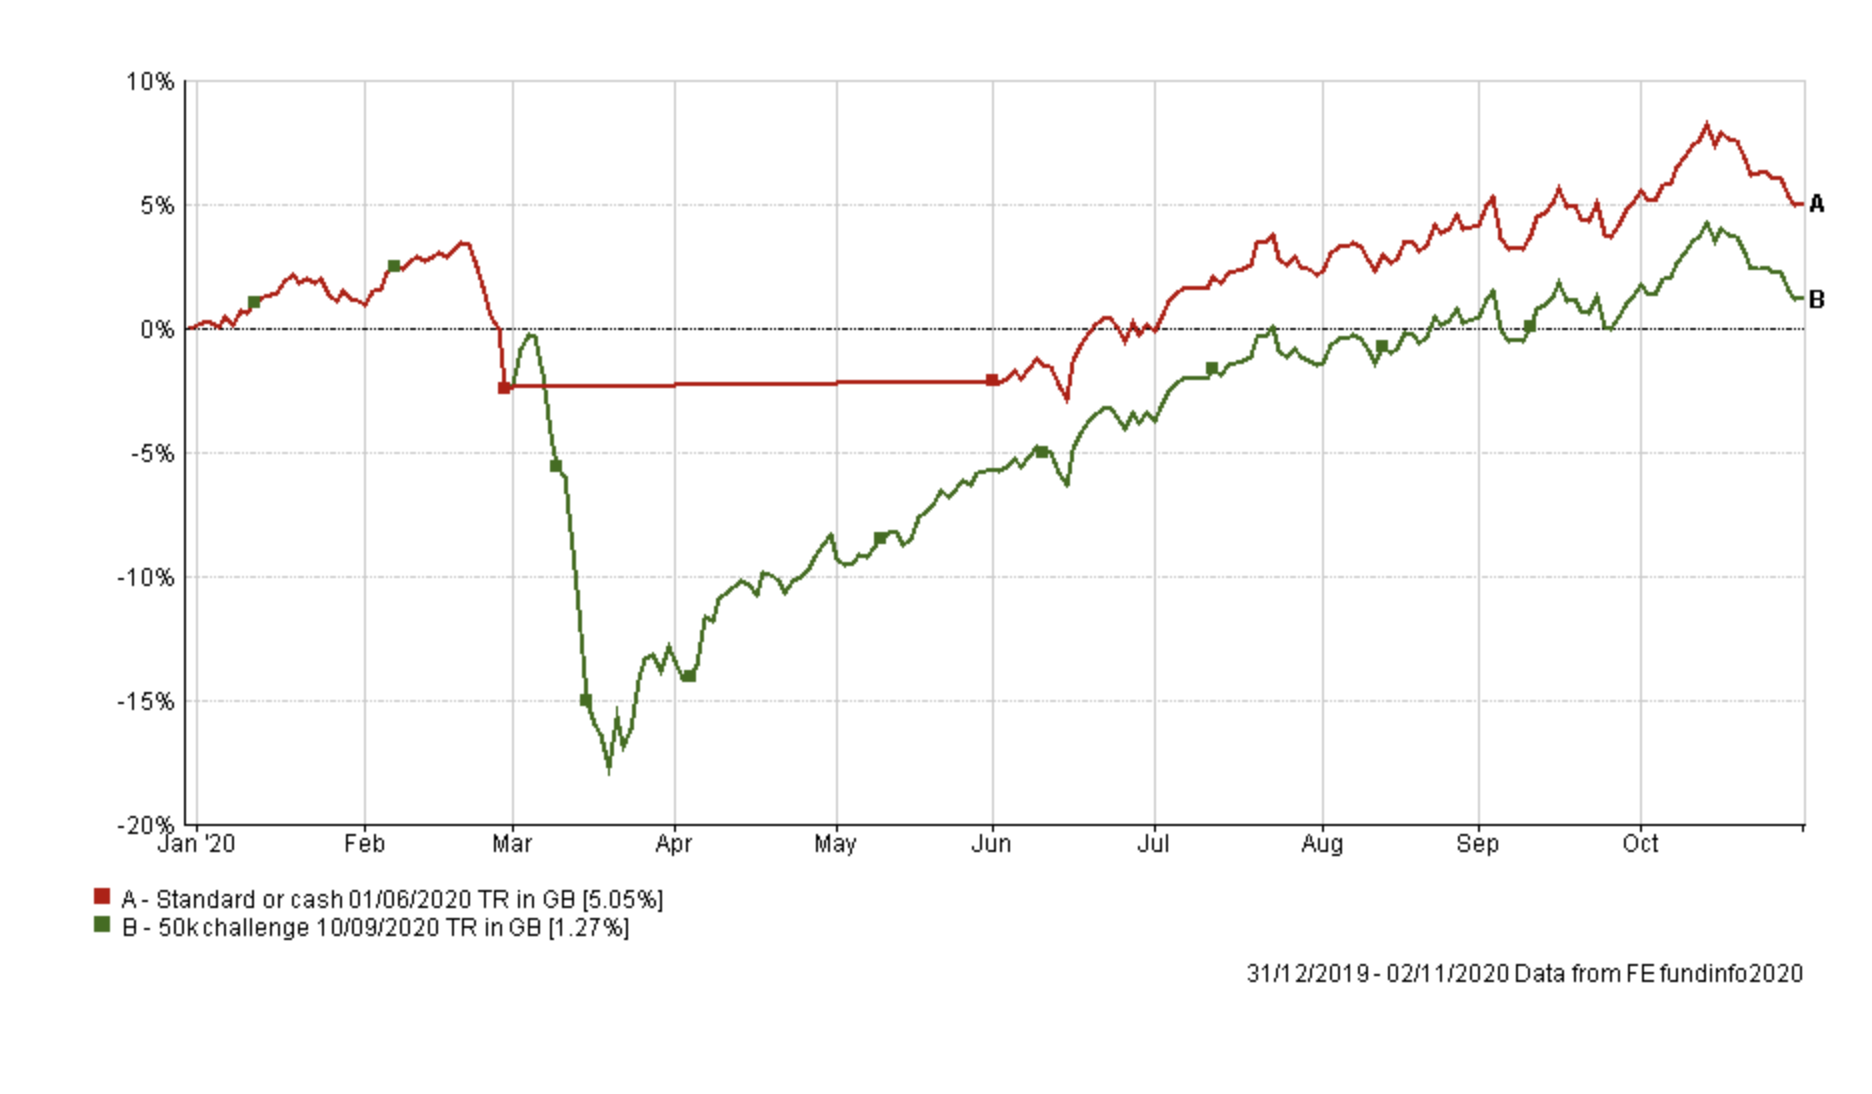
But if you look at the 2019 performance you can see the £50k/cash portfolio remained too cautious for much of the year and just before the coronavirus sell-off in February 2020 the portfolio lagged my £50k portfolio by 6.41% as shown below.
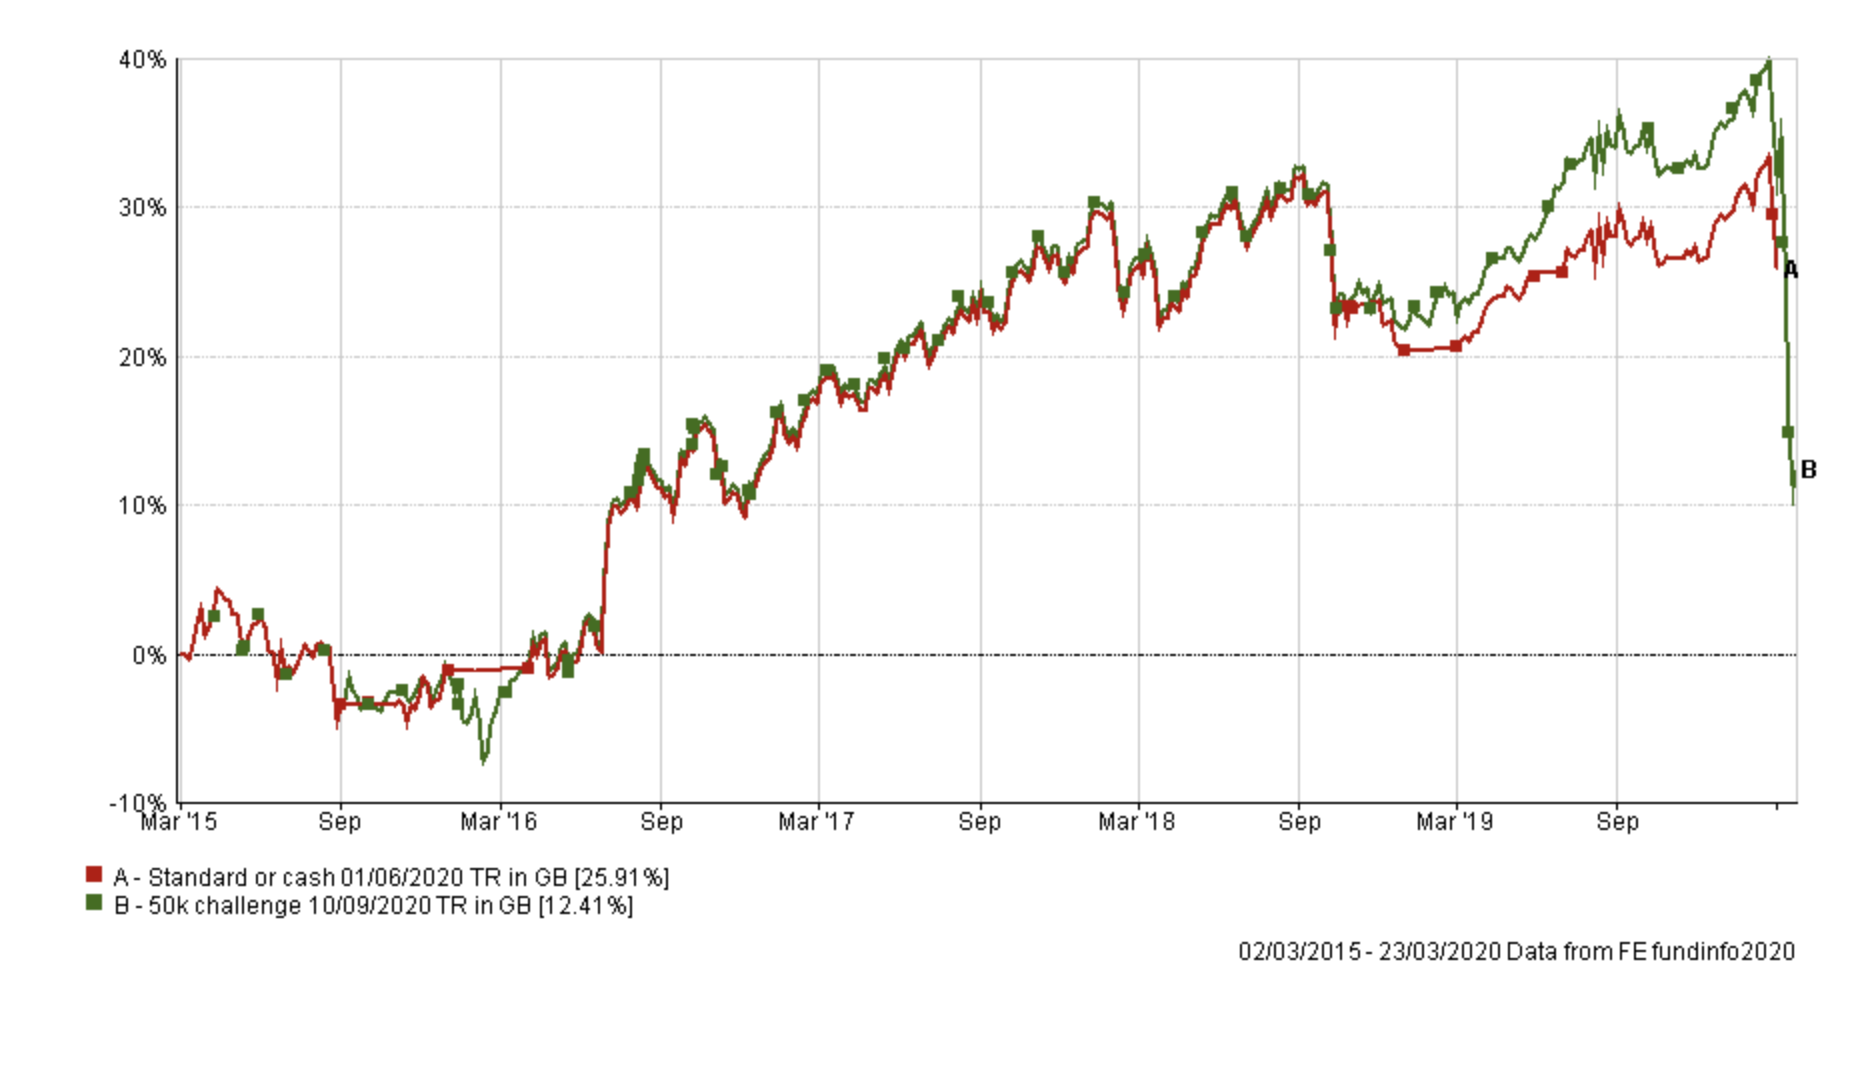
But of course, if you make the comparison at the market low of 23rd March 2020 then timing the market shines, outperforming by 13.81%.
The results show that using the 10mma indicator to switch into cash protects your portfolio from extreme bear market corrections. After all, we had no idea that the market wouldn't break even lower back in March 2020. If it had then the £50k/cash portfolio would have been preserved even more capital. However, switching to cash is a drag on performance in most other market conditions (even during corrections of 10%) and therefore over the longer term. But does that make it bad? Not necessarily. The original question stated that '"your backtest found that overall performance was similar (total growth) but drawdown was greatly reduced. Wow, that’s quite a result!"
Well that's exactly what we have found once again here. Therefore whether someone would want to use the 10mma indicator comes down to personal choice and what they prioritise, after all it is their money they are investing. The 10mma akin to an insurance policy that insures you against your house burning down. There's an annual cost and it only really proves value for money in the event of a fire. After nearly 6 years the performance of the two portfolios is similar and which would you have rather held? The one without the COVID drawdown? If that's a yes, would you really have been happy with the underperformance heading into 2020, before COVID (a black swan event) shook markets? Again it's a personal choice.
Portfolio 2 - £50k/lower-risk portolio
The Chatterbox question raised another possibility, which is rather than switch into cash when the 10mma indicator is triggered, instead switch to the lower risk version of my £50K portfolio. The chart below shows this £50k/lower-risk portfolio (in blue) vs my standard £50k portfolio (in green). Again the alternative portfolio underperforms my £50k portfolio but without the level of downside protection we saw in Portfolio 1 above.
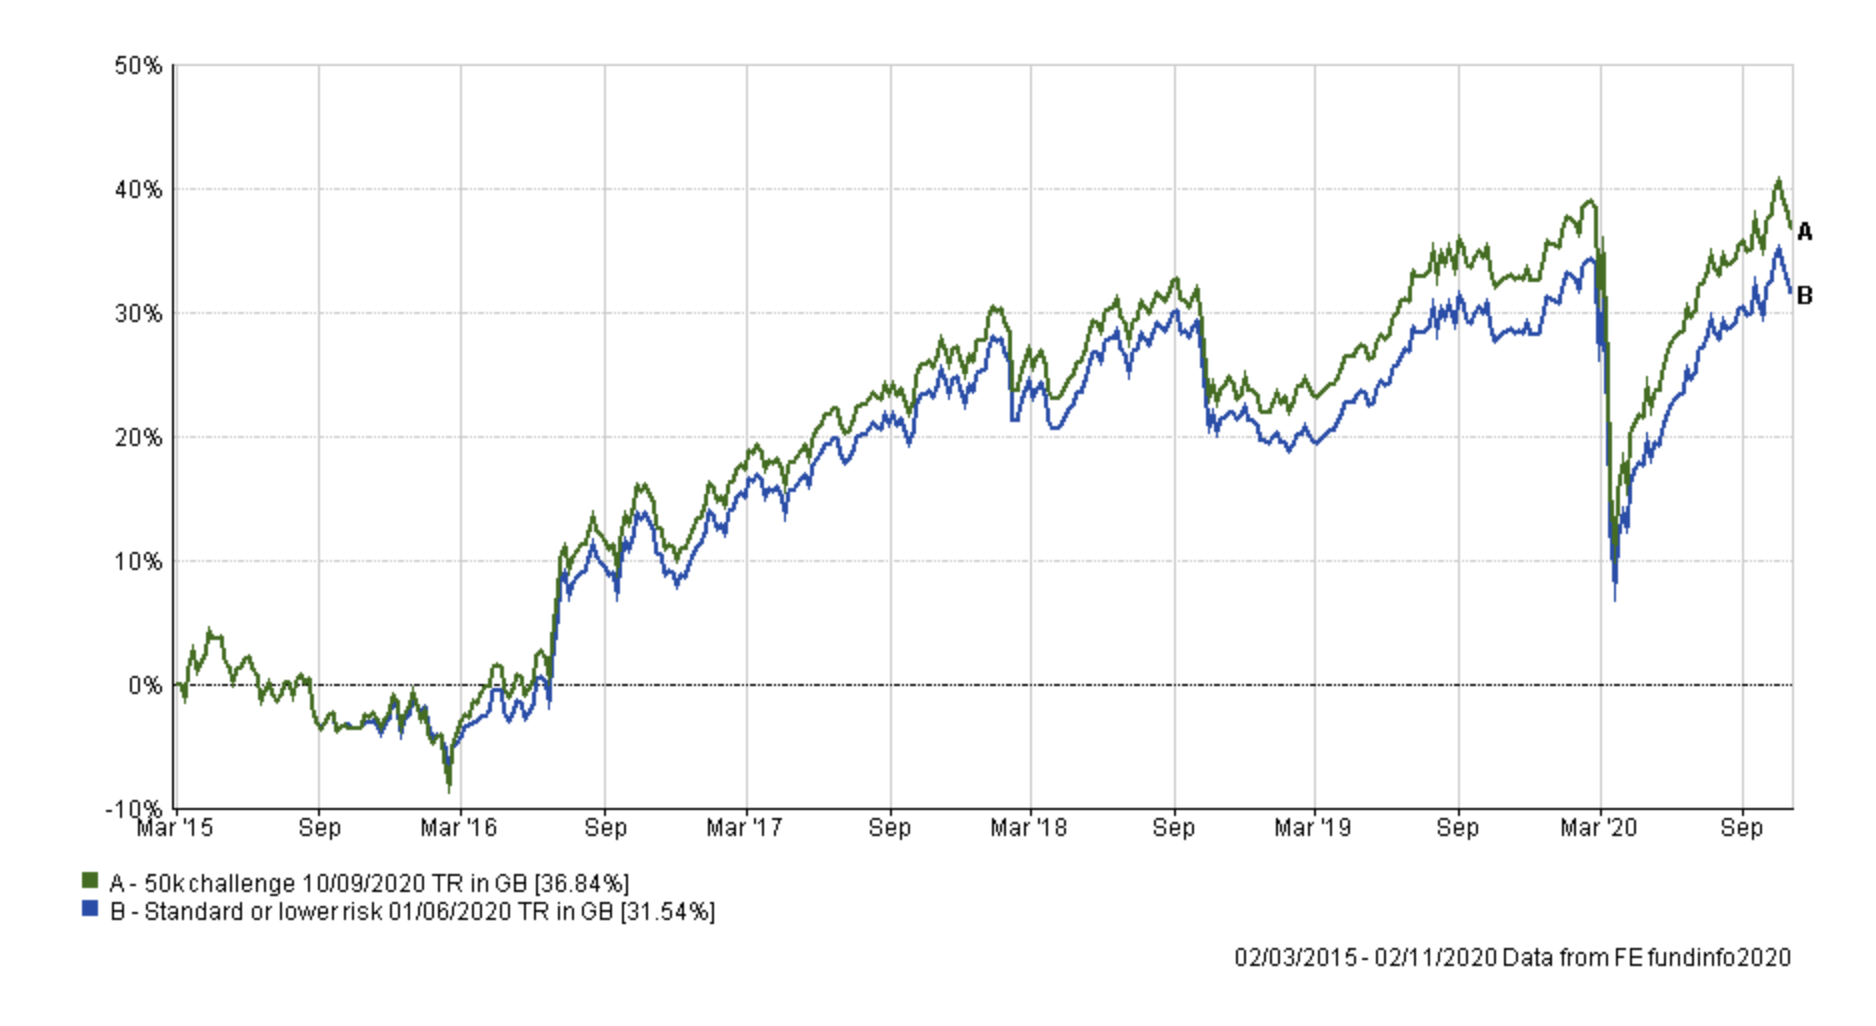
Comparing both portfolios (1&2) against my £50k portfolio shows that switching to the lower-risk portfolio has no benefit over switching to cash, and of course the latter portfolio is much easier to implement too.
But what about if you were instead following the higher-risk version of my 50k portfolio and then using the 10mma to switch to cash or the lower-risk portfolio? I answer this with the next two portfolios.
Portfolio 3 - Higher-risk £50k/cash
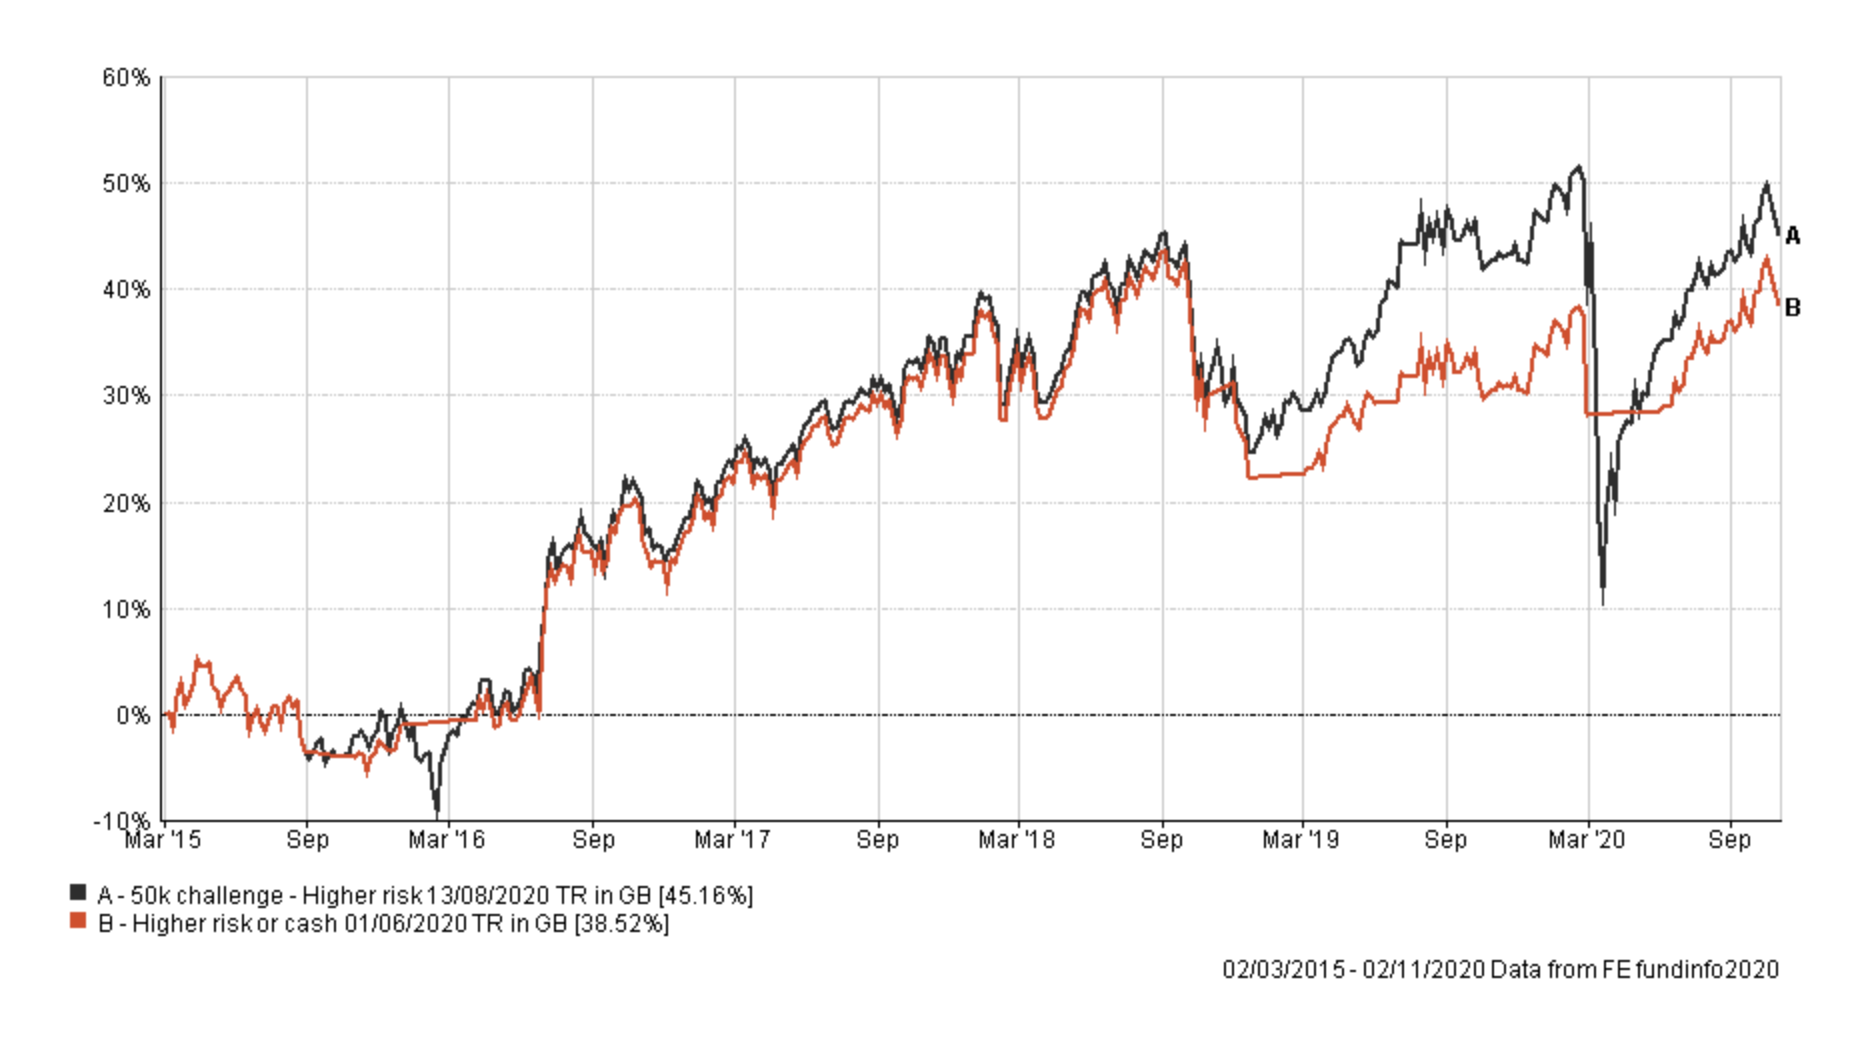
Let us assume that you invested in the Higher-risk £50k Portfolio and then switched to cash when the 10mma suggested to. The chart below shows this 'Higher-risk £50/cash' portfolio (in red) versus the standard higher-risk £50k portfolio (in black).
Portfolio 4 - Higher-risk £50k/lower-risk portfolio
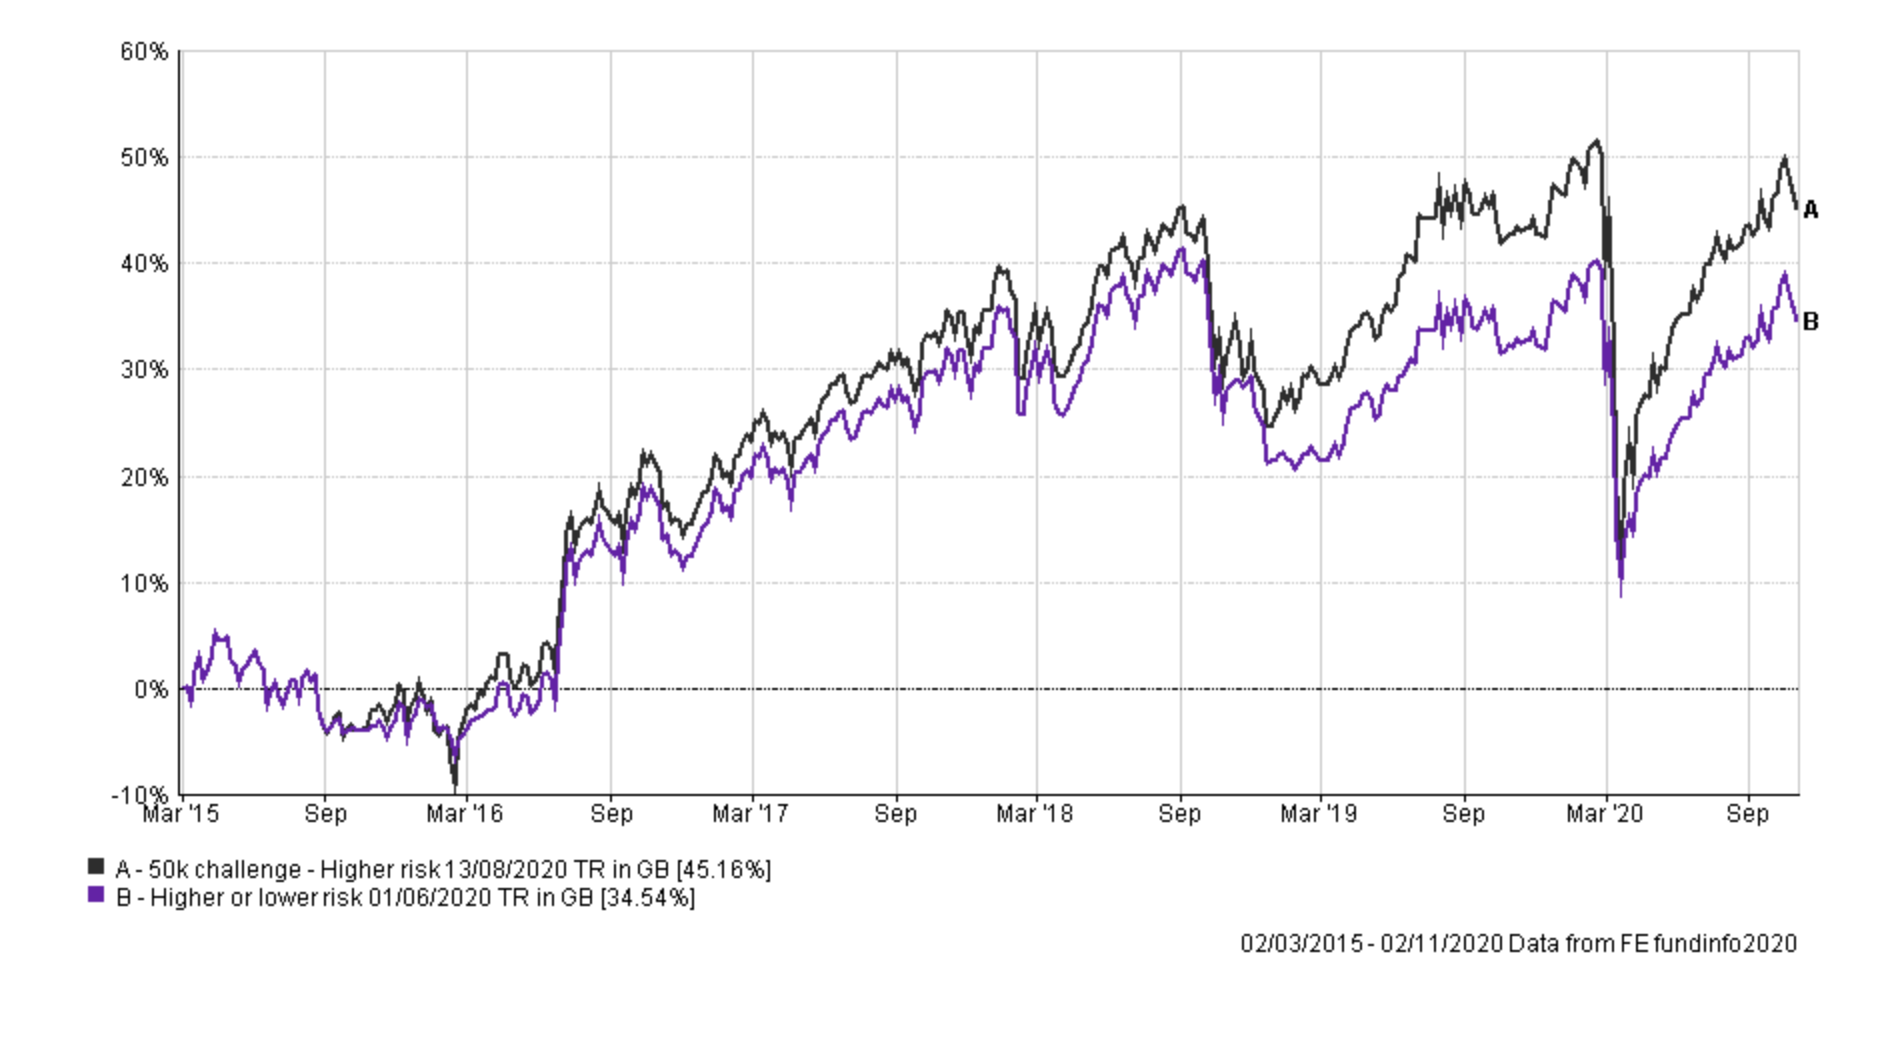
Let's now look at what happened if you used the 10mma to move between the higher-risk version of my £50k portfolio and the lower-risk version of my £50k portfolio. The chart below shows the 'Higher-risk £50k/lower-risk' portfolio (in purple) versus the standard higher-risk £50k portfolio (in black).
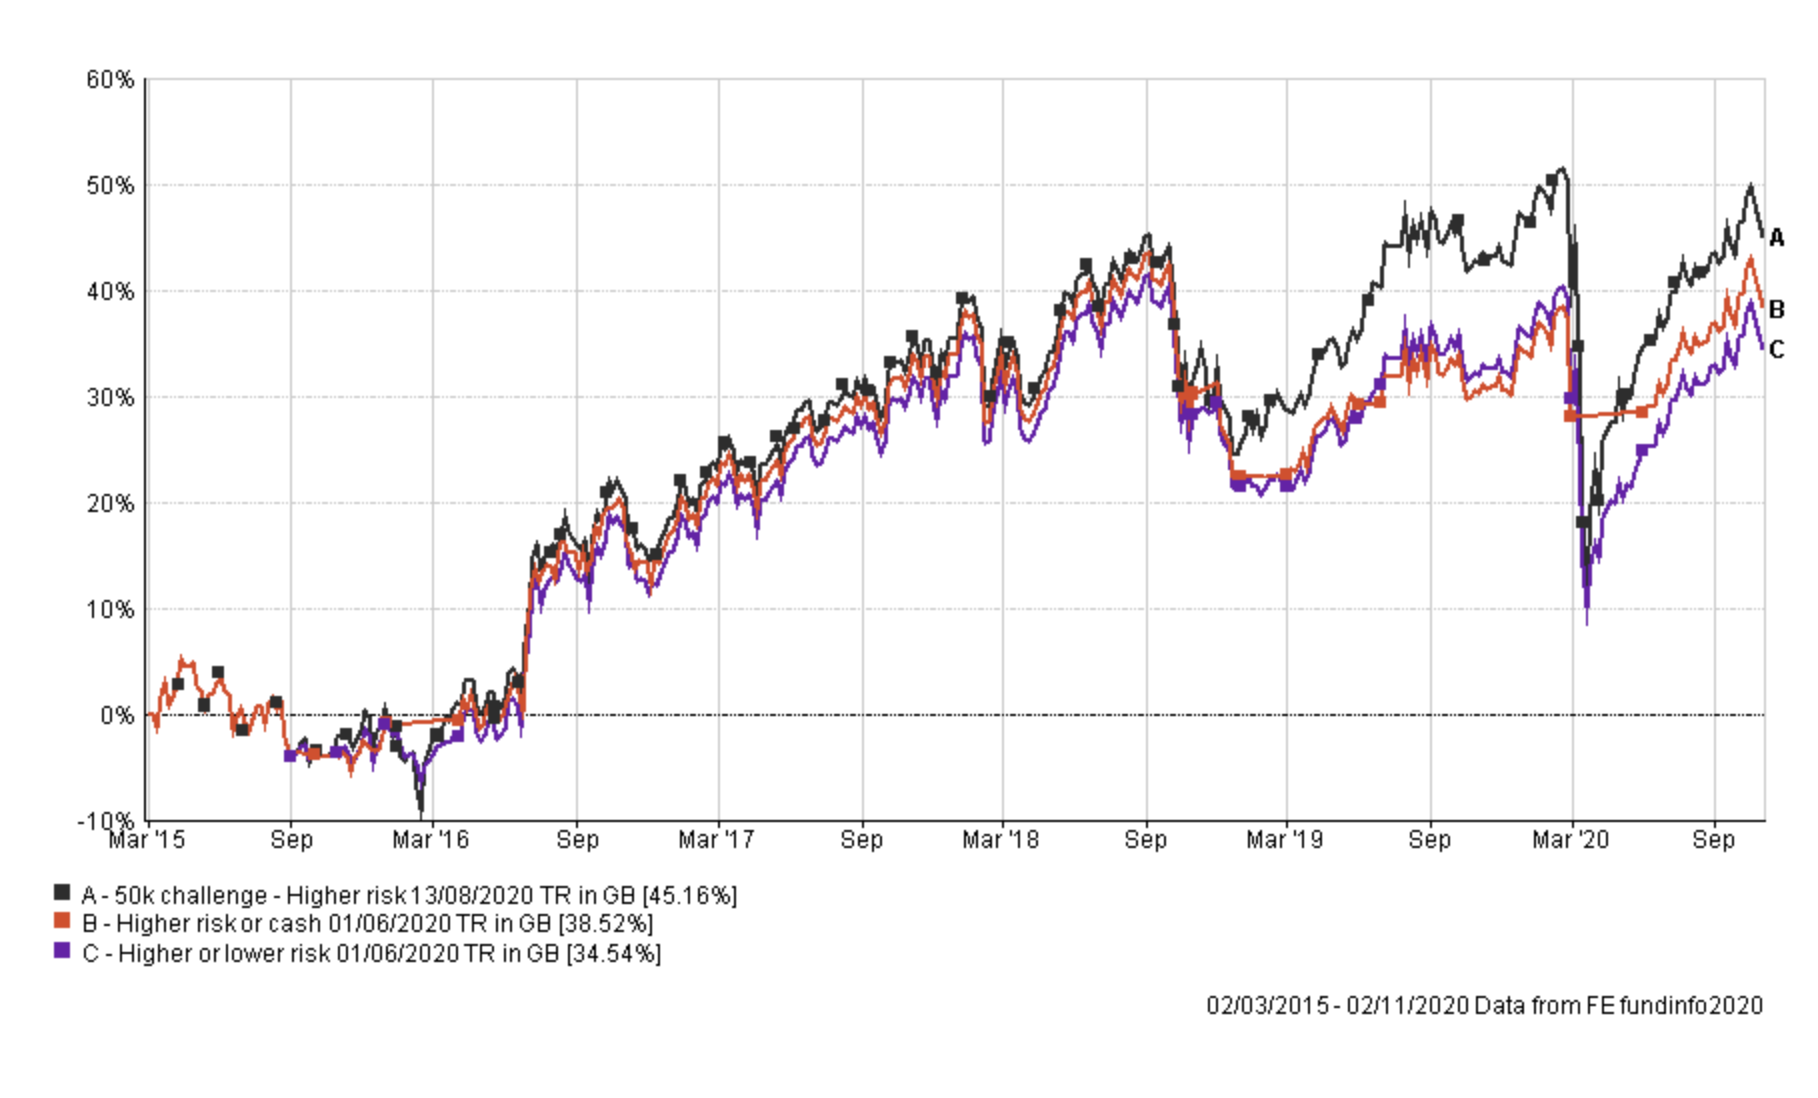
Combining all of the higher-risk variants into one chart looks like this.
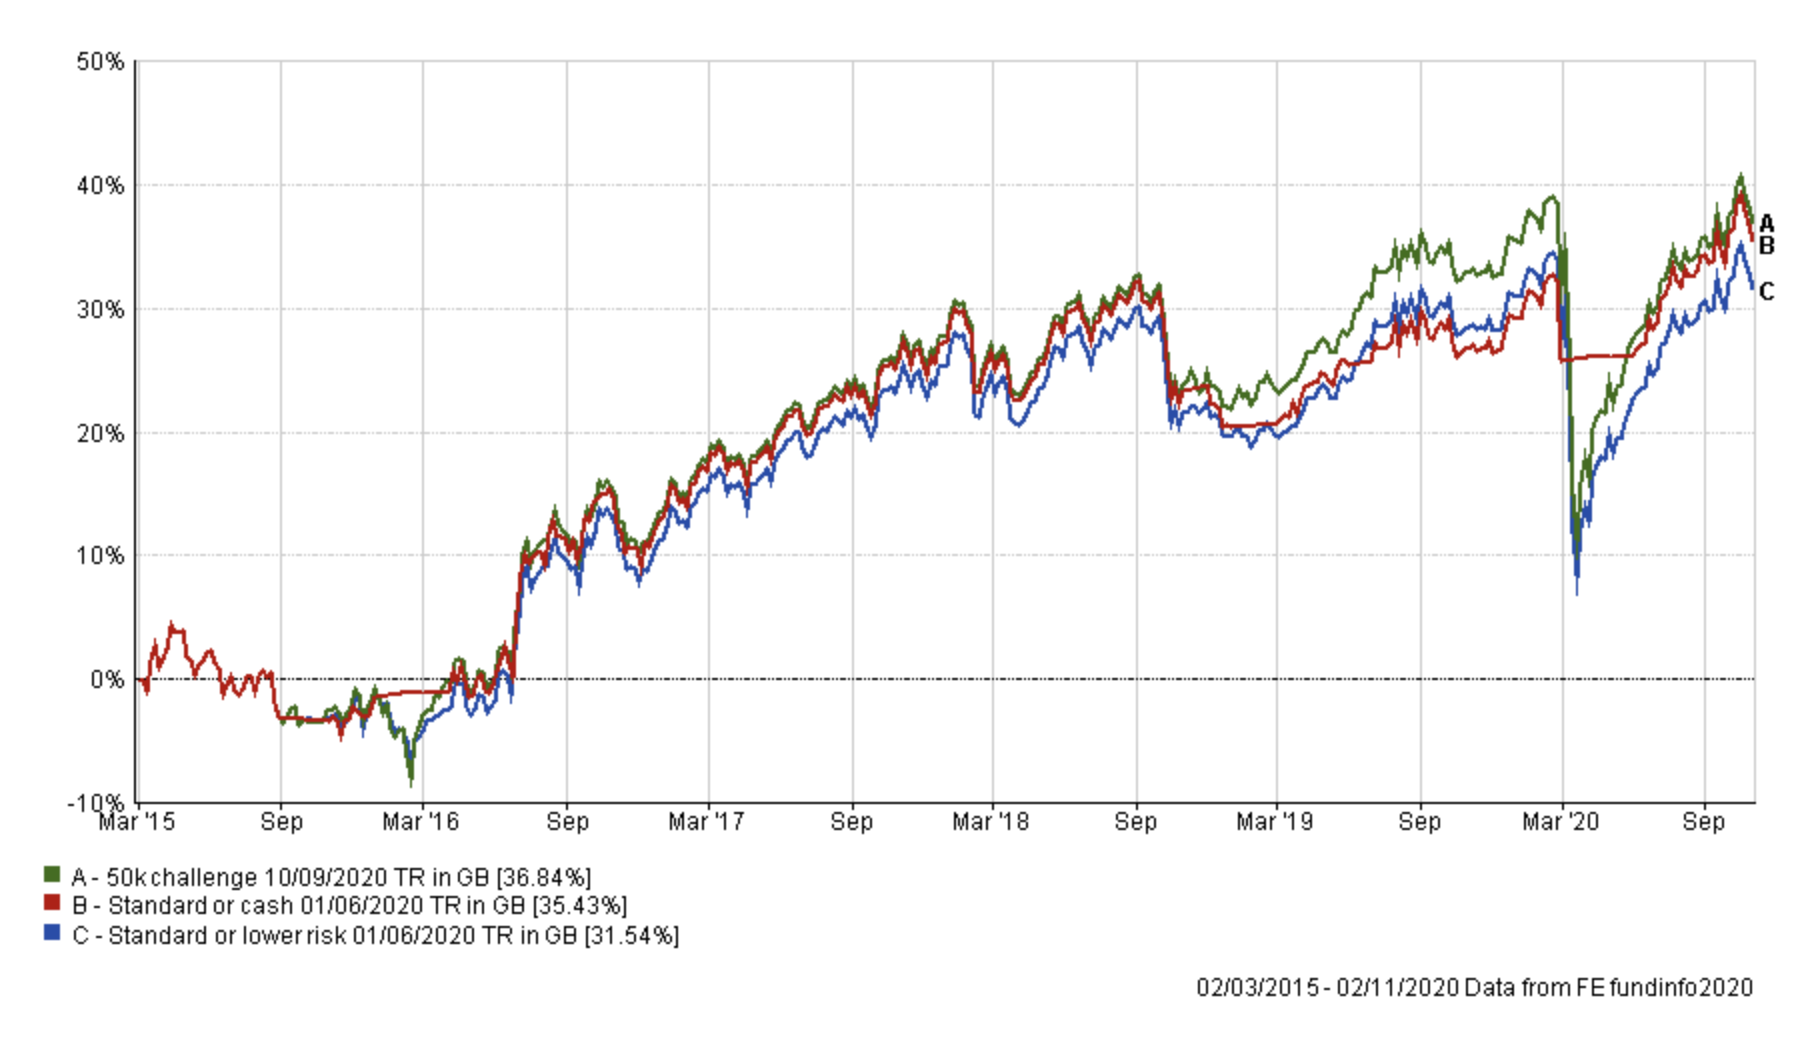
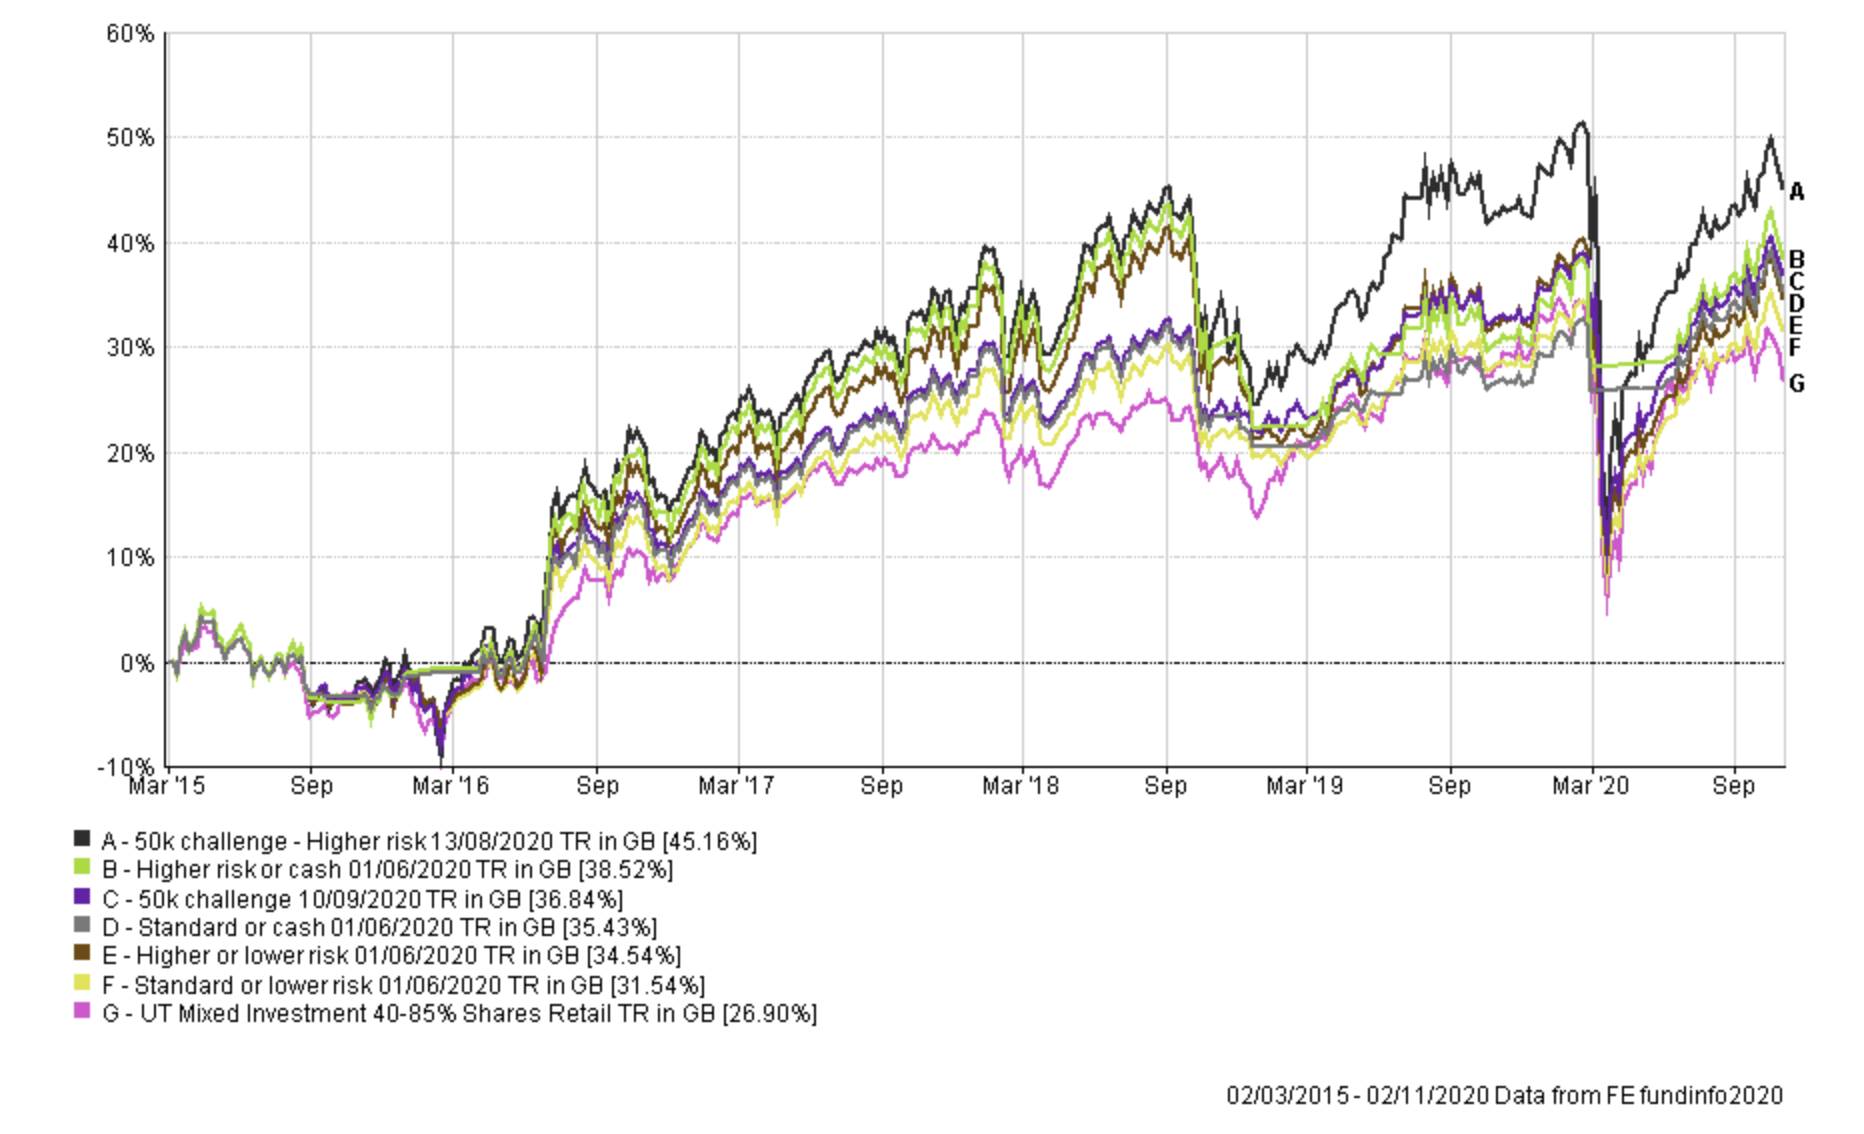
For comparison purposes, the chart below (which is a bit messy) shows all of the above portfolios' performances over time since the £50k challenge started.
But what about the concept of risk-adjusted returns raised in the original question? After all the whole point of the indicator is to manage risk while trying to maintain returns. Interestingly, you can statically measure this. Below I explain a number of key measures that can be used to compare risk-adjusted returns. They are:
Alpha
Alpha is a figure which measures a manager’s apparent skill at picking winning investments versus their benchmark. Alpha is the excess return versus the return of a fund’s benchmark (i.e the market). So a fund with a positive alpha indicates that the fund manager has outperformed through skill. While a negative alpha figure would indicate underperformance. The higher the alpha figure the better
Beta
Beta measures a fund’s sensitivity to the general market in which it operates. The market always has a beta of 1 by definition. So if a fund also has a beta of 1 that would mean that if the market rose by 5% then so should the fund. If the fund has a beta of -1 then as the market rises so the fund falls. A well-managed index fund will have a beta of exactly 1. Funds that outperform the market when it does well but do even worse when the market is going down will have a beta above 1.
Maximum Drawdown
This is the biggest fall experienced in a given week.
Sharpe Ratio
The Sharpe Ratio is a measure of the excess return a manager is achieving for the risk they are taking. The higher the Sharpe Ratio the better.
Sortino Ratio
This is very similar to the Sharpe Ratio but places more emphasis on the manager's ability to manage on the downside.
Volatility
This is a measure of a funds dispersion of returns, or in plain English the variability in those returns. Think of it as a measure of how much a building is prone to wobble. The more prone it is (the higher the volatility) the more it will sway in an earthquake.
The chart below summarises these statistics, plus the annualised return, for all of the portfolios above. I have colour coded each statistic with green identifying the best portfolio and red the worst (click to enlarge)
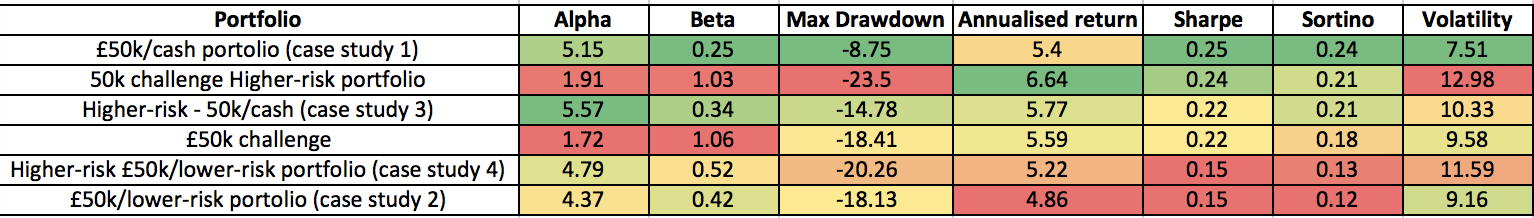
The results are stark. Using the 10mma to switch to cash boosts alpha and reduces beta because it throws momentum completely out of the window periodically and sits in cash, which is uncorrelated to any other asset class. It, therefore, reduces volatility and the size of the maximum weekly drawdown of my portfolio and boosts the shape and sortino ratio (although not on the higher risk portfolio interestingly). The cost of the improved risk-adjusted return is the drop in overall annualised return percentage.
Summary
The key takeaways are:
- That over the longer term, remaining invested trumps market timing
- Extending your investing time frame (simply remaining invested after a slump) is perhaps the most effective way of dealing with a market crash
- The evidence shows that across a severe sell-off the 10mma strategy clearly works but it also shows that the longer your timeframe the greater the chance that a simple buy and hold strategy will outperform (this is a direct quote from the original research article but it is remarkable that it has been proved true once again)
- The 10mma indictor undoubtedly reduces drawdowns in bear markets. It is best at protecting you from the black swan events (like COVID) but proves a drag on performance following smaller corrections (less than 20%)
- The 10mma indicator can statistically be shown to boost risk-adjusted returns and reduce volatility but it comes at a cost of reduced performance.
But there is a large caveat to all to this. While the above research has been applied to a real portfolio (in this case my £50k) the timeframe analysed is just under 6 years (a relatively small timeframe) and includes a bear market in equities, which inevitably favours the portfolio that switched to cash using the 10mma. If the market had endured a series of minor correction (and no bear market) then the 10mma approach would have lagged by a greater amount. Having said that, as the original research stated... "the 10mma indicator is particularly good at helping you to avoid the largest drawdowns that occur in bear markets. It would have helped you avoid the worst of the bursting of the dotcom bubble, the financial crisis crash and the coronavirus sell-off." There's no doubt that while far from perfect, the indicator's simplicity and ease of implementation will likely make it popular with investors trying to time the market.

£200 Pension Cashback Offer
Make a qualifying deposit or transfer a pension to our partner Interactive Investor.
- Deposit or transfer a pension of at least £20k and you could earn £200 cashback
- Terms and Fees apply, Capital at risk
- New & Existing customers opening a SIPP
- Offer ends 31st July 2026
Before starting your transfer, check you won't lose any valuable benefits (such as guaranteed annuity rates or a lower protected pension age) and find out what exit fees you might have to pay
