

This research article is split into two parts. In Part 1 I look at the performance of the Perfect portfolios over the first half of 2022 and in Part 2 I explore the idea of applying market timing to the perfect (all-weather) portfolios.
Part 1 - Perfect portfolio performance update (2022)
Back in 2020, shortly after the pandemic equity market slump I carried out an extensive piece of analysis on a host of fixed allocation "perfect portfolios". Over the years there have been numerous famous books and research articles that have produced "perfect portfolios", which their authors claim have proven track records. Each of the portfolios was created with the aim of trying to simplify the investment process by giving a core asset mix which investors should invest in accordance with and periodically rebalance. These "perfect portfolios" have been heralded by their creators (and advocates) for their ability to produce strong returns in almost all market conditions.
The portfolios I included in my original analysis are listed below:
- Harry Browne Permanent Portfolio
- Ivy League Portfolio
- Gone Fishin' Portfolio
- Ray Dalio All Weather
Alongside these I also analysed variations of the 80-20 Investor Perfect ISA Portfolio. You can read more about the 80-20 Investor Perfect ISA Portfolio in my article - "Perfect ISA Portfolio 2022 - 21 years and counting".
Back in 2020 I analysed how each portfolio had performed during the pandemic sell-off. You can read the original piece of research here - "The best all-weather portfolios analysed". Some of the conclusions reached in my analysis back then included:
- the Harry Browne Permanent Portfolio and the 80-20 Investor Perfect Portfolios performed the best across and into the major downturn
- portfolios that held up the best in 2020 were those with gold exposure
- over the longer term (10 years) the Ivy league and Gone Fishin' portfolios start to outperform significantly, due to their 70% equity exposure versus 20% for the 80-20 Investor Portfolios and 25% for the Harry Browne Permanent Portfolio
But how have the portfolios fared in the first half of 2022, one of the worst investing starts to a year in more than 50 years?
Unusually both bonds and equities collapsed into bear markets during the first half of this year meaning that a typical 60% equity / 40% bond portfolio fell 11% in the first six months of 2022. If ever a perfect portfolio was to be put to the test it is now. Furthermore, if the second half of 2022 turns out to be a repeat of the first half (or not) then what can we learn from the performance of the various perfect portfolios as to what will work in the future?
Before I analyse the performance of the portfolios I will just recap each portfolio's asset mix.
80-20 Investor Perfect Portfolio
- 9% Cash
- 20% UK Equity Income
- 71% UK Gilts
80-20 Investor Perfect Gold Portfolio
- 9% ETFS Physical Gold
- 20% UK Equity Income
- 71% UK Gilts
Harry Browne Permanent Portfolio
- 25% ETFS Physical Gold
- 25% Cash
- 25% UK Equities
- 25% UK Gilts
Ivy League Portfolio
- 30% UK Equities
- 15% Global Equities
- 5% Emerging Market Equities
- 20% Property Equities
- 15% Gilts
- 15% Index-Linked Gilts
Gone Fishin' Portfolio
- 5% Ruffer Gold
- 10% Asia ex-Japan Equities
- 10% Europe ex-UK Equities
- 10% Global Bonds
- 10% Global Emerging Market Equities
- 15% North American Equities
- 15% North American Smaller Companies
- 5% Property Equities
- 10% Sterling High Yield
- 10% UK Gilts
Ray Dalio All Weather
- 7.5% ETFS Gold Physical
- 7.5% Commodities and Energy ETFs
- 15% Sterling Corporate Bond
- 30% UK Equities
- 40% UK Gilts
In order to chart the performance of each portfolio I have assumed that investors achieved the average return for the sectors relating to each asset mix. I have assumed that unit trusts were used unless stated otherwise. So for UK Equity I have assumed the average return for the UK All Companies sector etc.
Now while most portfolios suggested domestic equities in their construction the Gone Fishin' portfolio assumes US equities as standard. In fact it has zero UK equity exposure. This means that if I was to make a like for like comparison I need to change this to UK Equities to be in line with the other portfolios. This portfolio is called the Gone Fishin' UK version.
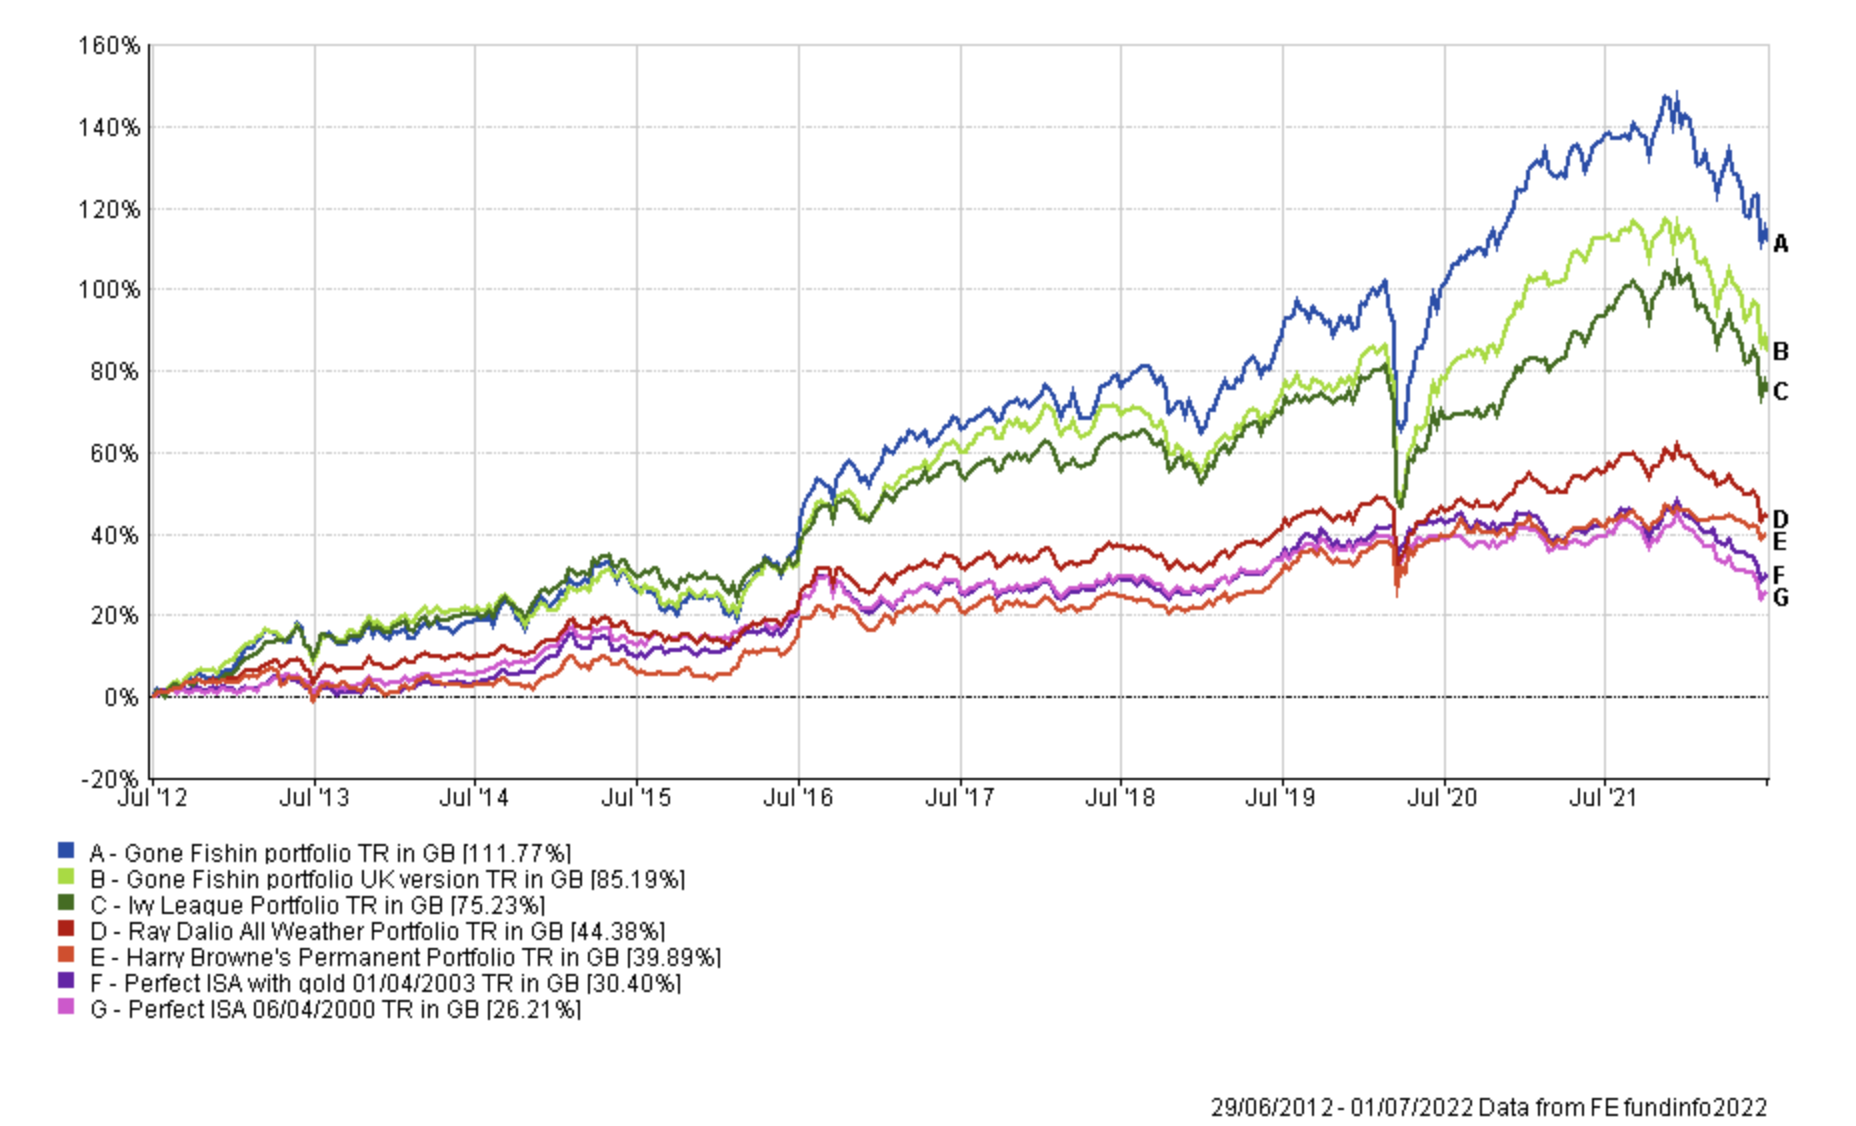
The chart below shows the performance of each portfolio for the first six months of 2022.
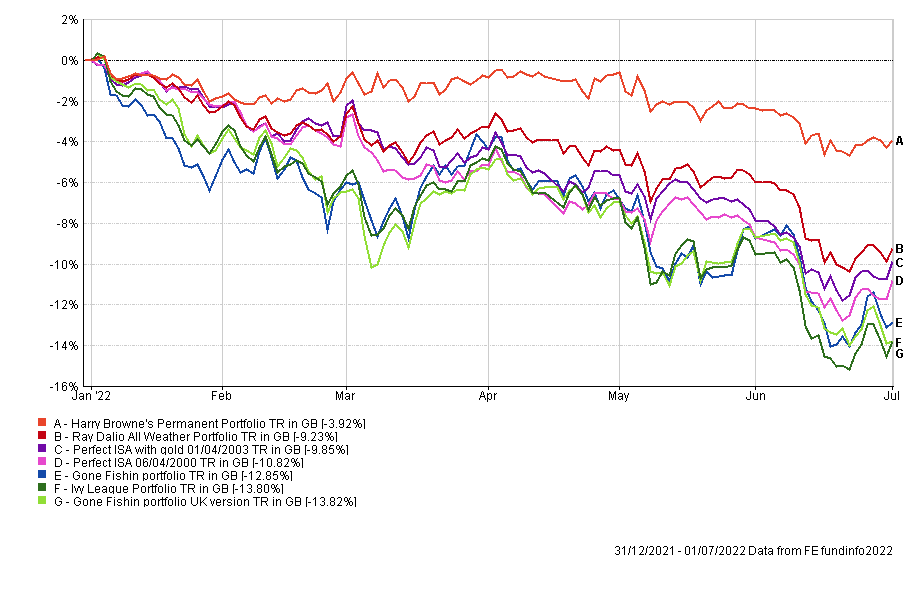
You can see that there is a huge difference in the performance of the various perfect portfolios, with the Harry Browne Permanent Portfolio and the 80-20 Investor Perfect portfolios among the best performers. At the other end of the scale the Ivy League and Gone Fishin portfolios fell by as much as 14%.
This outcome backs up the findings from the original research piece as to which portfolios protect you the most in a market downturn. Ultimately it is those that have the lowest equity exposure, while having some exposure to gold.
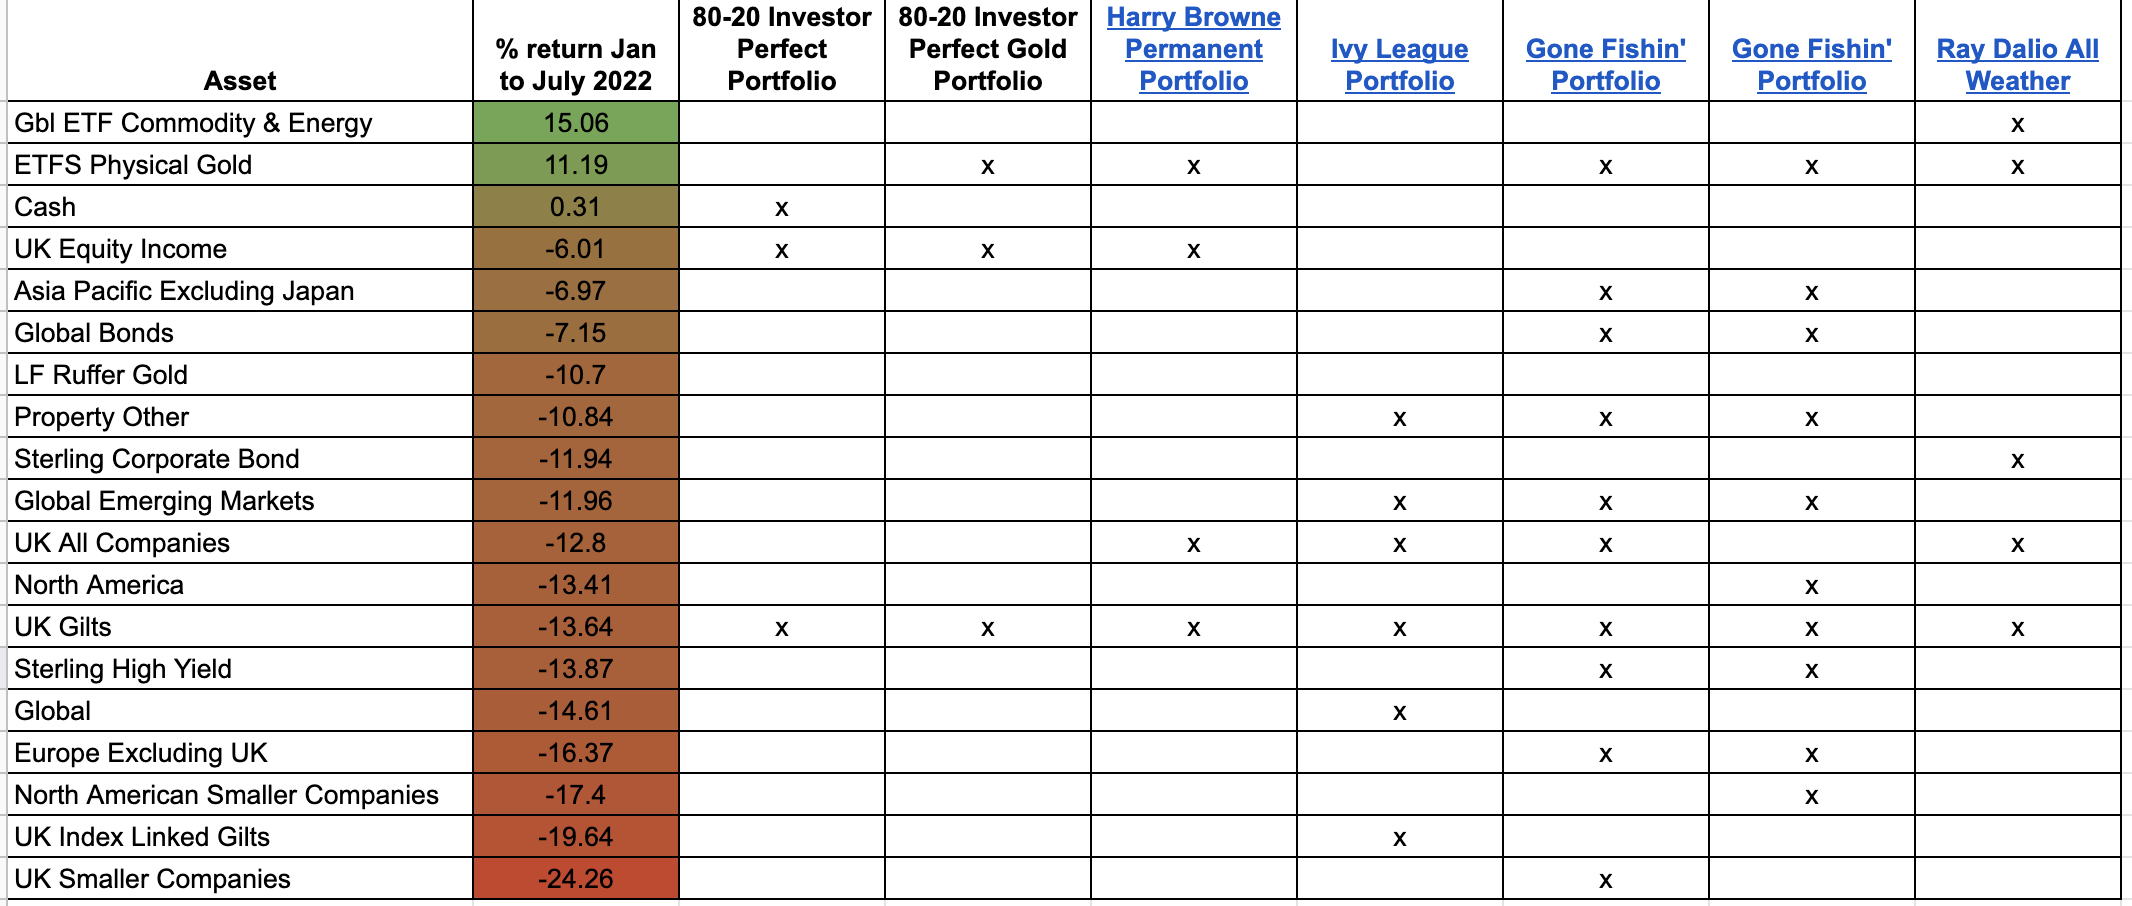
The table below (click to enlarge) gives a summary of the best performing assets in the first half of 2022, that appear across the portfolios, alongside a grid highlighting which portfolios the assets reside in. If the second half of 2022 turns out to be a repeat of the first, then it is clear which portfolios will likely outperform. Likewise if the second half of 2022 turns out to be the complete opposite to the first six months it is easy to project which portfolios will do well/badly.
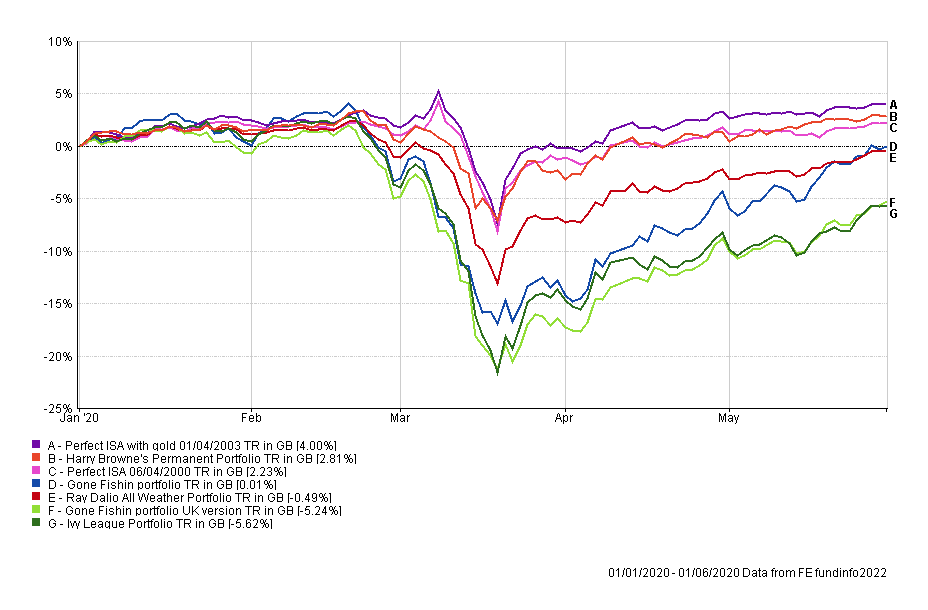
But what is different this time around is the dispersion of outcomes. During the worst of the pandemic sell-off back in 2020 (shown in the chart below), the 80-20 Perfect ISA Portfolios and the Harry Browne Permanent Portfolio held up best. At the opposite end of the scale were the Ivy League and Gone Fishin portfolios with their high equity content. Meanwhile in the middle sat Ray Dalio's portfolio.
In 2022 the dispersion of performance was much different, as you can see from the first chart in this article. The Harry Browne Permanent Portfolio was out in front on its own as the best performer, with the Ivy League and Gone Fishin portfolios significantly underperforming. However the Ray Dalio portfolio was joined by the 80-20 Perfect Portfolios in the middle group. The reason for the differing outcomes when compared to 2020 was the performance of bonds and in particular UK gilts during the first half of this year. The 80-20 Perfect Portfolios have significant gilt exposure as does the Ray Dalio All Weather portfolio when compared to Harry Browne's Permanent portfolio. Gilts have been a problem in 2022.
For completeness the next two charts show the performance of all the portfolios over the last 5 and 10 years assuming an annual rebalance in January. You can see once again that the Ivy League and Gone Fishin portfolios outperform over the long-term thanks to their significant equity exposure.
5 year performance
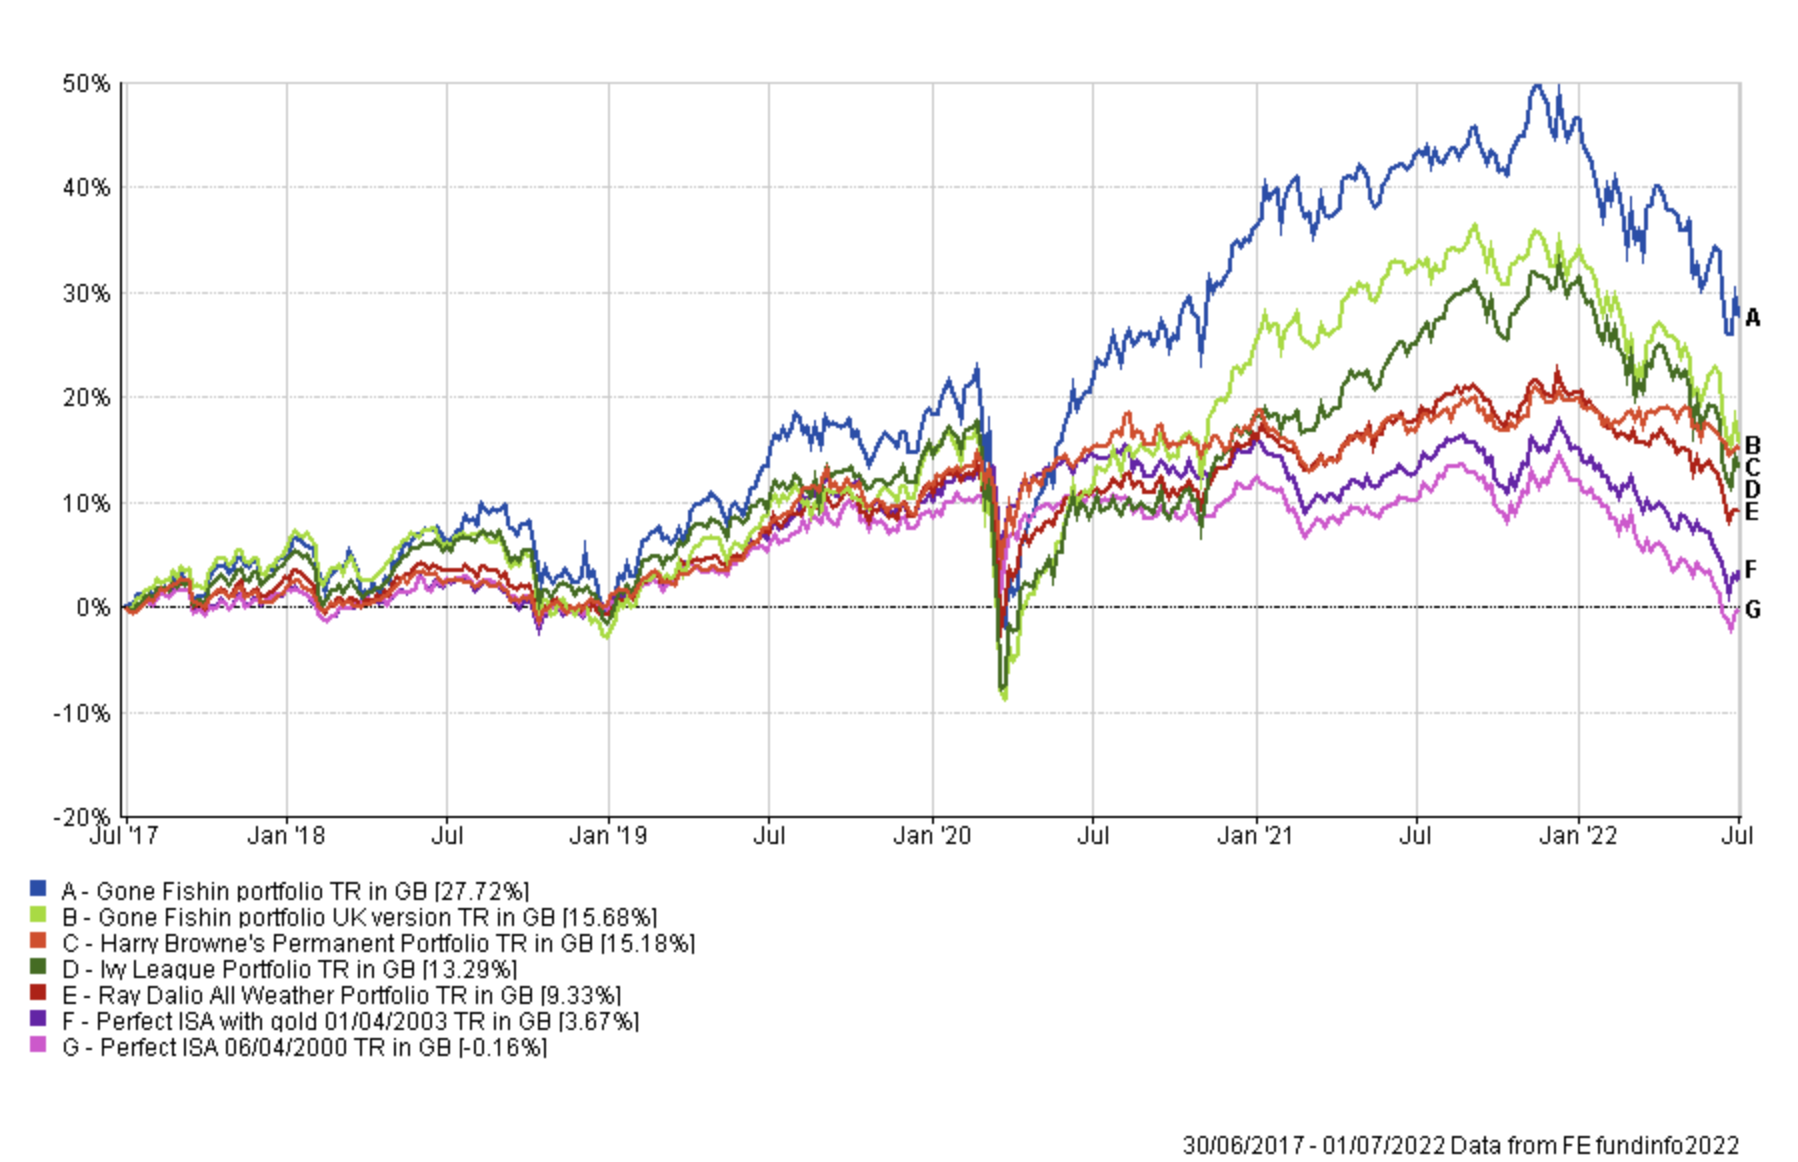
10 year performance
Part 2 - Perfect timing?
The 2022 performance figures for the perfect portfolios are largely consistent with what we saw in 2020. But what is interesting is that the exposure to UK gilts is usually what aids the most successful portfolios during a downtrend, but not in 2022. My previous Summer Portfolio analysis and the market timing analysis applied to my 50k portfolio highlighted that you can boost returns by switching into gilts, at key times. Switching into cash tended to hamper returns and the conclusion is that it pays to become more defensive, not disinvest entirely. But as gilts have been a drag on performance in 2022 what would happen if we used the 10 month moving average indicator to move in and out of the Gone Fishin UK Portfolio and into the more defensive Harry Browne Permanent Portfolio?
The first chart below compares the performance of the following portfolios over the last 10 years:
- Harry Browne Permanent Portfolio
- Gone Fishin' Portfolio UK
- Gone Fishin UK Portfolio & switching into cash
- Gone Fishin UK Portfolio & switching into gilts
- Gone Fishin UK Portfolio & switching into the Harry Browne Permanent Portfolio (Perfect-timed portfolio)
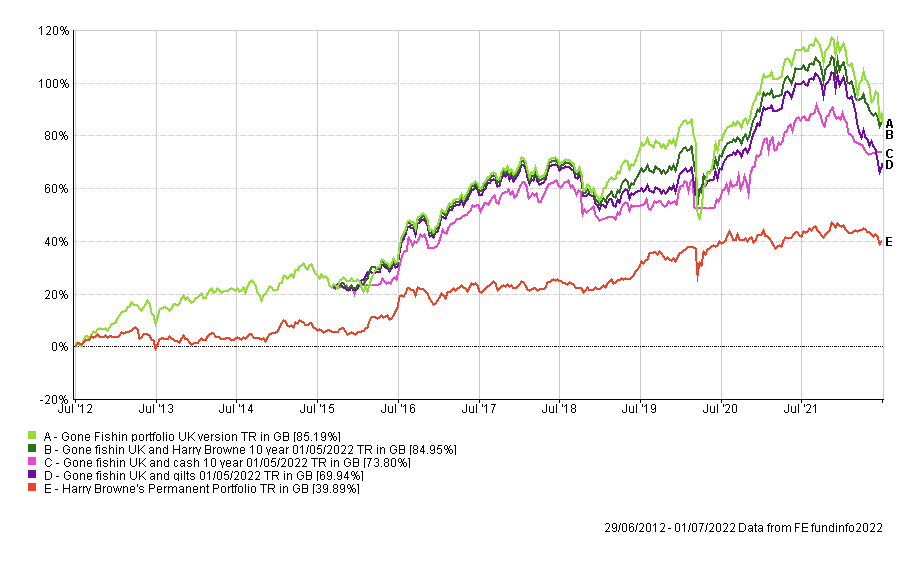
The result is very interesting. Essentially there is little difference between the Perfect-timed portfolio (moving in and out of the Gone Fishin UK Portfolio & switching into the Harry Browne Permanent Portfolio) and simply buying and holding the Gone Fishin UK Portfolio for the full 10 years. Initially you might say, what is the point of switching? And that is a valid observation. But on the other hand, timing the portfolio moves (using the 10 month moving indicator) acts like an insurance policy against a severe market crash. As such there is a price to pay, which is a performance lag versus simply remaining invested in the Gone Fishin UK Portfolio all the time. But for much of 2022, that insurance policy has been effectively paying out as going defensive would have protected your money. In fact as I write this the Perfect-timed portfolio (moving in and out of the Gone Fishin UK Portfolio & switching into the Harry Browne Permanent Portfolio) is still invested in the Harry Browne Permanent Portfolio and will continue to be so unless the S&P 500 finishes August above 4300.
The question then is, which would you rather be holding right now?
More interestingly if you look beyond performance and look at other key investing statistics the case for the Perfect-timed portfolio becomes even more compelling for those who are of a nervous disposition. The table below provides key summary statistics for each portfolio. The key metrics are colour coded in each column with dark green being the best and red being the worst. Below the table I explain what each key statistic represents. You can see that not only has the Perfect-timed Portfolio been one the best performing portfolios over the 10 year period but it also manages risk better than any other and generates more return for the risk being taken.
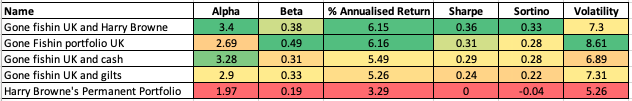
Alpha
Alpha is a figure which measures a manager’s apparent skill at picking winning investments versus their benchmark. Alpha is the excess return versus the return of a fund’s benchmark (i.e the market). So a fund with a positive alpha indicates that the fund manager has outperformed through skill. While a negative alpha figure would indicate underperformance. The higher the alpha figure the better
Beta
Beta measures a fund’s sensitivity to the general market in which it operates. The market always has a beta of 1 by definition. So if a fund also has a beta of 1 that would mean that if the market rose by 5% then so should the fund. If the fund has a beta of -1 then as the market rises so the fund falls. A well-managed index fund will have a beta of exactly 1. Funds that outperform the market when it does well but do even worse when the market is going down will have a beta above 1.
Maximum Drawdown
This is the biggest fall experienced in a given week.
Sharpe Ratio
The Sharpe Ratio is a measure of the excess return a manager is achieving for the risk they are taking. The higher the Sharpe Ratio the better.
Sortino Ratio
This is very similar to the Sharpe Ratio but places more emphasis on the manager's ability to manage on the downside.
Volatility
This is a measure of a fund's dispersion of returns, or in plain English the variability in those returns. Think of it as a measure of how much a building is prone to wobble. The more prone it is (the higher the volatility) the more it will sway in an earthquake.
Summary
So what does all this tell us? Well the first thing is that a perfect (all-weather) portfolio can't make money in all conditions but depending on the portfolio the outcomes are quite varied. Also over the last 10 years the most cautious portfolio (Harry Browne Permanent Portfolio) provides an annual return of 3.29%, little more than inflation. But this piece of research moves the conversation on with regard to summer/defensive/timed portfolios. If when we use the 10 month moving average indicator we don't just move into cash or gilts as we have done previously, but instead move into a more diversified combination of cash, gilts, equities and gold we can boost returns. 2022 exposed a weakness in many perfect/all-weather portfolios which is an over reliance on bonds/gilts. If you get a period where both equities and bonds move in tandem and fall for a prolonged period of time (such as 2022) then holding cash and gold helps.
While over the last 10 years the Perfect-timed Portfolio has produced a return in line with the Gone Fishin UK Portfolio we are in the midst of a period of market weakness. If we'd performed this analysis at the market top in 2021, then the buy and hold Gone Fishin UK Portfolio would have outperformed by a much greater margin. What I am highlighting is that right now, it's a bit like assessing whether having home insurance has been worth it, just at the point your house is on fire. Of course it is. But what we've learned is that:
- it's best to remain in the market over the long term (rather than cash) if you want to improve returns
- diversification remains key even if you go defensive as does asset allocation
- but going strategically defensive improves the risk vs return characteristics of your portfolio
Then it's about being in the right funds within those sectors which is where the BOTB and BFBS tables come in.

£200 Pension Cashback Offer
Make a qualifying deposit or transfer a pension to our partner Interactive Investor.
- Deposit or transfer a pension of at least £20k and you could earn £200 cashback
- Terms and Fees apply, Capital at risk
- New & Existing customers opening a SIPP
- Offer ends 31st July 2026
Before starting your transfer, check you won't lose any valuable benefits (such as guaranteed annuity rates or a lower protected pension age) and find out what exit fees you might have to pay
