

Two years ago I carried out a piece of research looking at how the high, medium or low risk selections from historic Best of the Best Selections would have fared in isolation. Or in other words, how would a notional high, medium or low risk 80 20 Investor portfolio have fared. You can read the original piece of research here.
Recently a number of 80-20 Investor members have asked about looking at how variations of the BOTB would have fared historically so I thought it was time to update this research. As I said previously, the aim is not to suggest that people buy all the funds but simply to give a graphical representation of how the 80 20 Investor algorithm is faring as a whole from a fund picking perspective. It also allows me to then benchmark the performance for users to see. However, 80-20 Investor is not prescriptive or dictatorial. It is about trying to enhance the decisions that subscribers make. So if they want to take more investment risk they can. If they want to take less risk then they can. Passive investment strategies and active funds don't in themselves allow this level of personalisation. They are simply the lego bricks to help you build the portfolio you want. 80-20 Investor helps you with the design and implementation.
Methodology
I spent a lot of time recreating how the low, medium and high risk 80-20 Investor portfolios would have fared. The three portfolios are only indicative as I've not invested money into them. To build the low risk portfolio I tracked the performance of the funds earmarked as low risk in each month's BOTB since launch in August 2014. I also created the medium and high risk portfolios in the same way. I had to assume that funds were switched immediately on the 1st of each subsequent month into the new funds with no switch delay. Of course I understand that is not reality but the assumption is made for a number of valid reasons, which I explain in the 80-20 Investor article 'Do fund switch delays hit your 80-20 investment returns?'
In addition, I also produced an accurate benchmark for each portfolio. These benchmarks provide the return from a portfolio with the same asset mix (as each 80-20 portfolio) but assuming it achieved the average fund performance for the relevant sectors. So if, for example, one of the 80-20 Investor risk portfolios had 10% in a specific UK All Companies fund then 10% of the corresponding benchmark would have achieved the average return for the UK All Companies sector as a whole. The aim is to show the added value that the 80-20 Investor algorithm provides by picking the right funds.
Low risk 80 20 Portfolio
Starting with the low-risk portfolio, the chart below pits it against a benchmark which was constructed as described above.
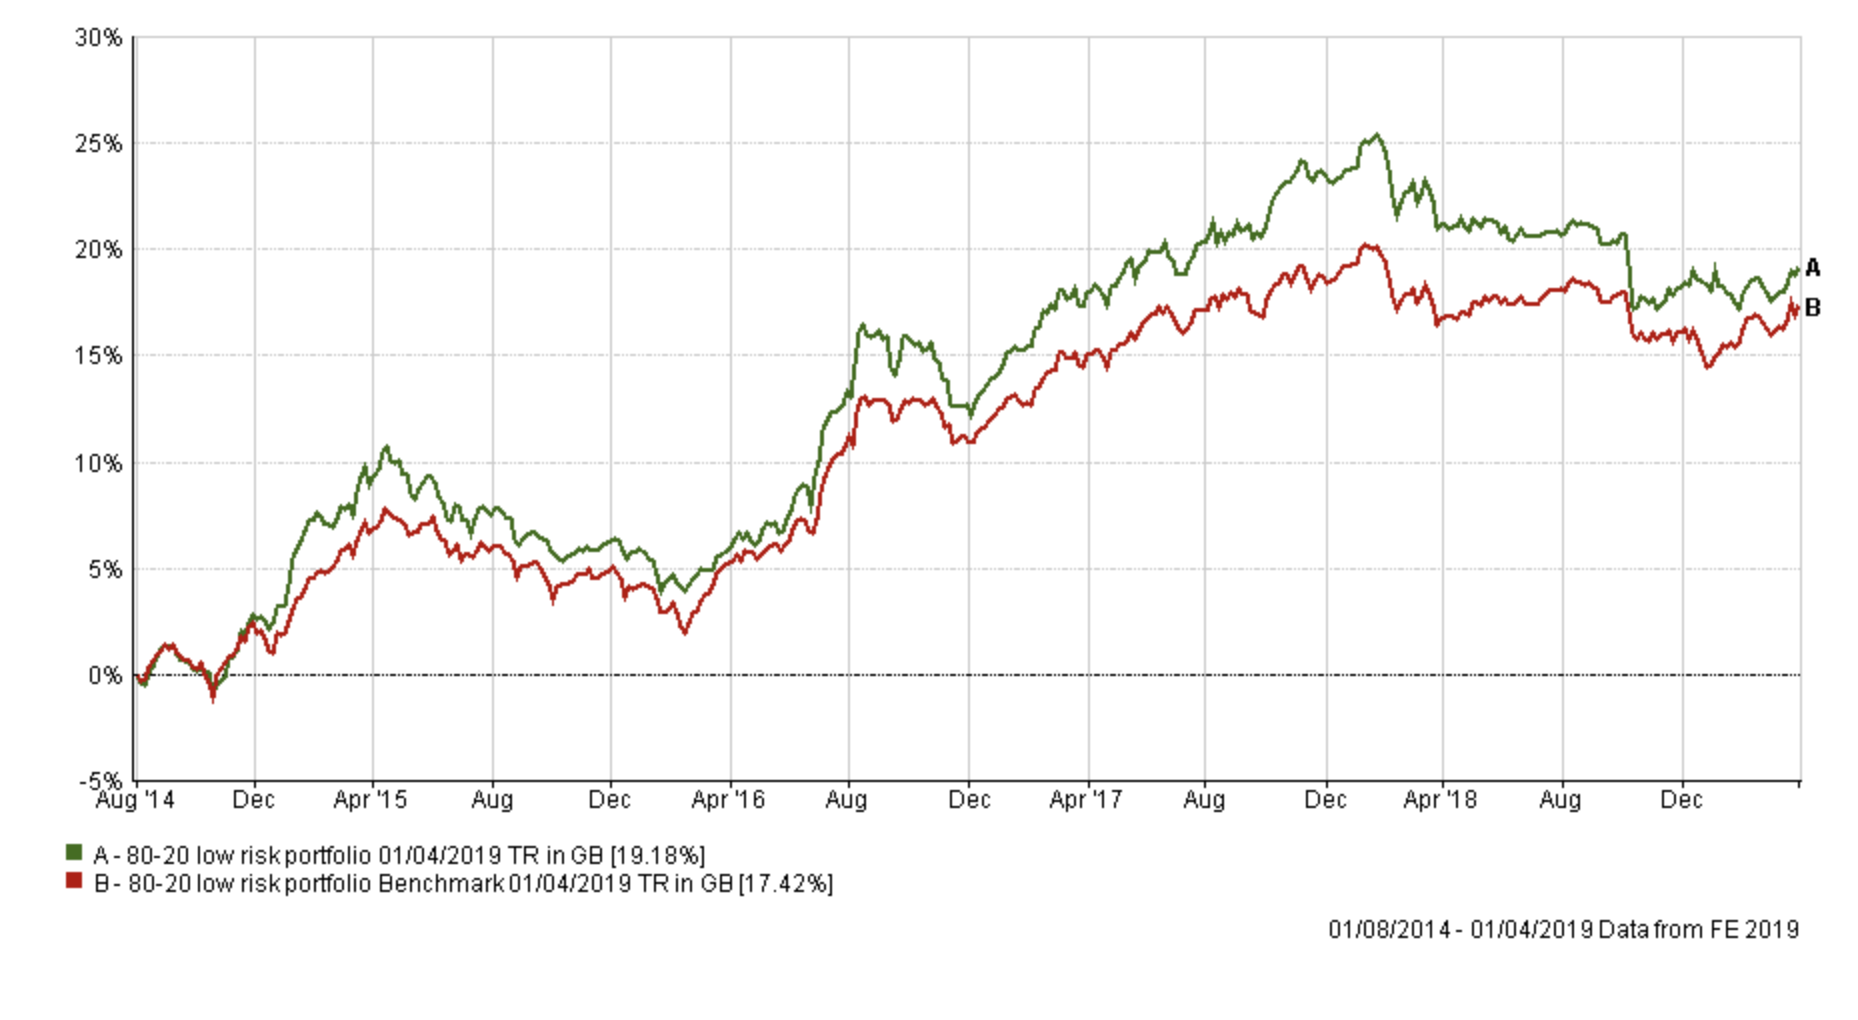
The low risk portfolio has continued to outperform, extending its lead over its benchmark into the start of 2018. The low risk portfolio then gave up some of that outperformance at the start of this year. However, it's performance versus its benchmark during November and December 2018, when stock markets plummeted, was impressive. While its benchmark continued to fall the low risk 80-20 portfolio actually made a positive return in the last two months of 2018.
Momentum investing with low risk funds is always going to have its limitations, due to the lack of volatility low risk funds inherently have. It's akin to trying to surf when there are no waves (or at least small ones). So while I wouldn't expect to blow the doors off in terms of performance, the portfolios annualised return of 3.94% per annum, with a volatility measure that is 60% of its benchmark's level of volatility, is a very strong outcome.
Also bear in mind that since the launch of 80 20 Investor (August 2014) various types of low risk funds have had their periods of outperformance, be they absolute return funds, high yield bonds, strategic bonds, corporate bonds or even property funds. The trouble is that at the start of the exercise in August 2014 there was no telling which would outperform. What 80-20 Investor does is to keep the portfolio nimble and move from one asset type to another. The table below shows how a typical fund from each of the traditional low risk sectors would have fared since August 2014.
| Sector average / portfolio | Total return since 1st August 2014 |
| Sterling Corporate Bond | 20.5 |
| 80-20 low risk portfolio | 19.18 |
| Mixed Investment 20-60% Shares | 17.1 |
| Global Bonds | 16.69 |
| Sterling High Yield | 15.21 |
| Sterling Strategic Bond | 14.31 |
| Targeted Absolute Return | 6.24 |
The Sterling Corporate Bond sector is the only sector that has outperformed the 80-20 low risk portfolio since August 2014. So with the benefit of hindsight you could argue that you would have been better off just investing in a Sterling Corporate Bond fund, but we don't have the benefit of hindsight when we are investing today.
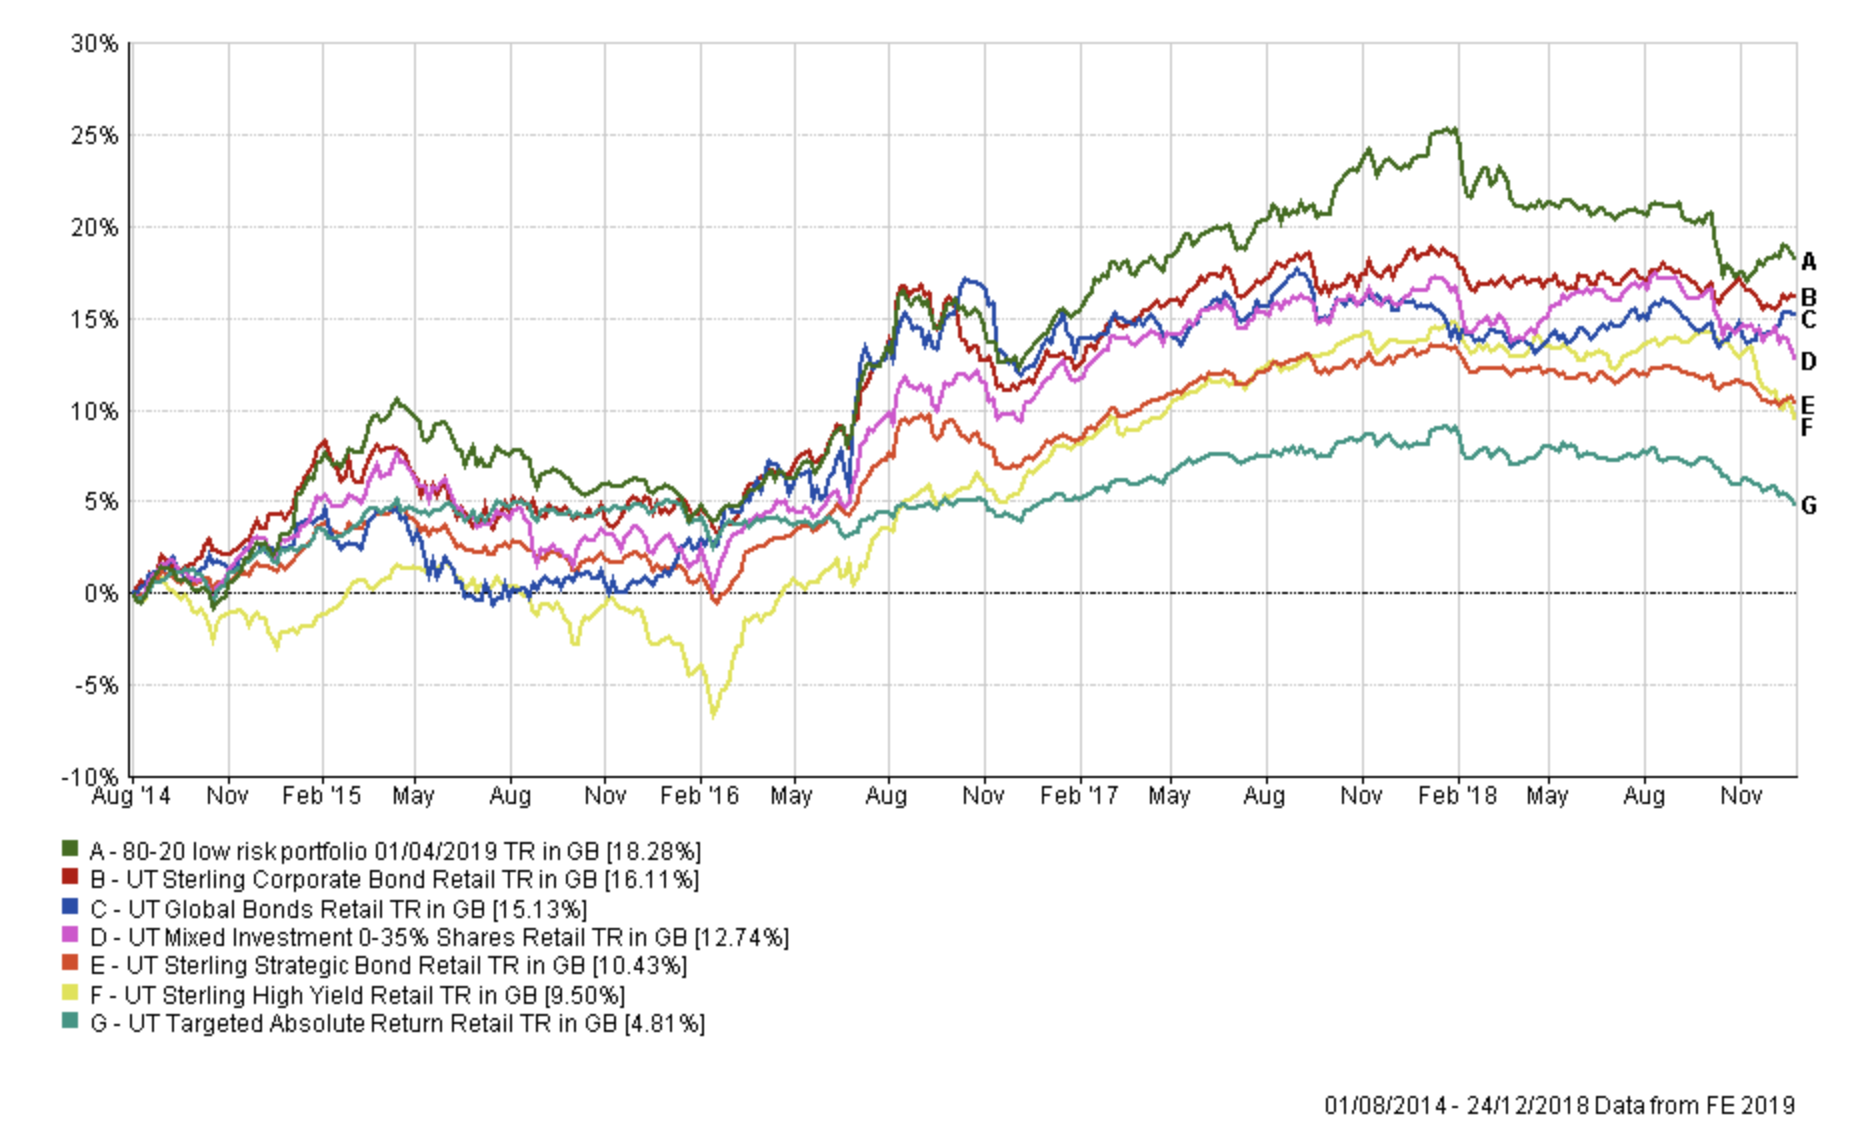
In any event, it was the rally in bond prices at the start of 2019 which has enabled the Sterling Corporate Bond sector to pip the low risk 80-20 portfolio to the top spot. This is demonstrated well in the two charts below. The first chart shows the performance of all six sectors versus that of the 80-20 low risk portfolio up until the stock market low of December 24th 2018. At this point the low-risk 80-20 Investor was still leading having given up an impressive lead.
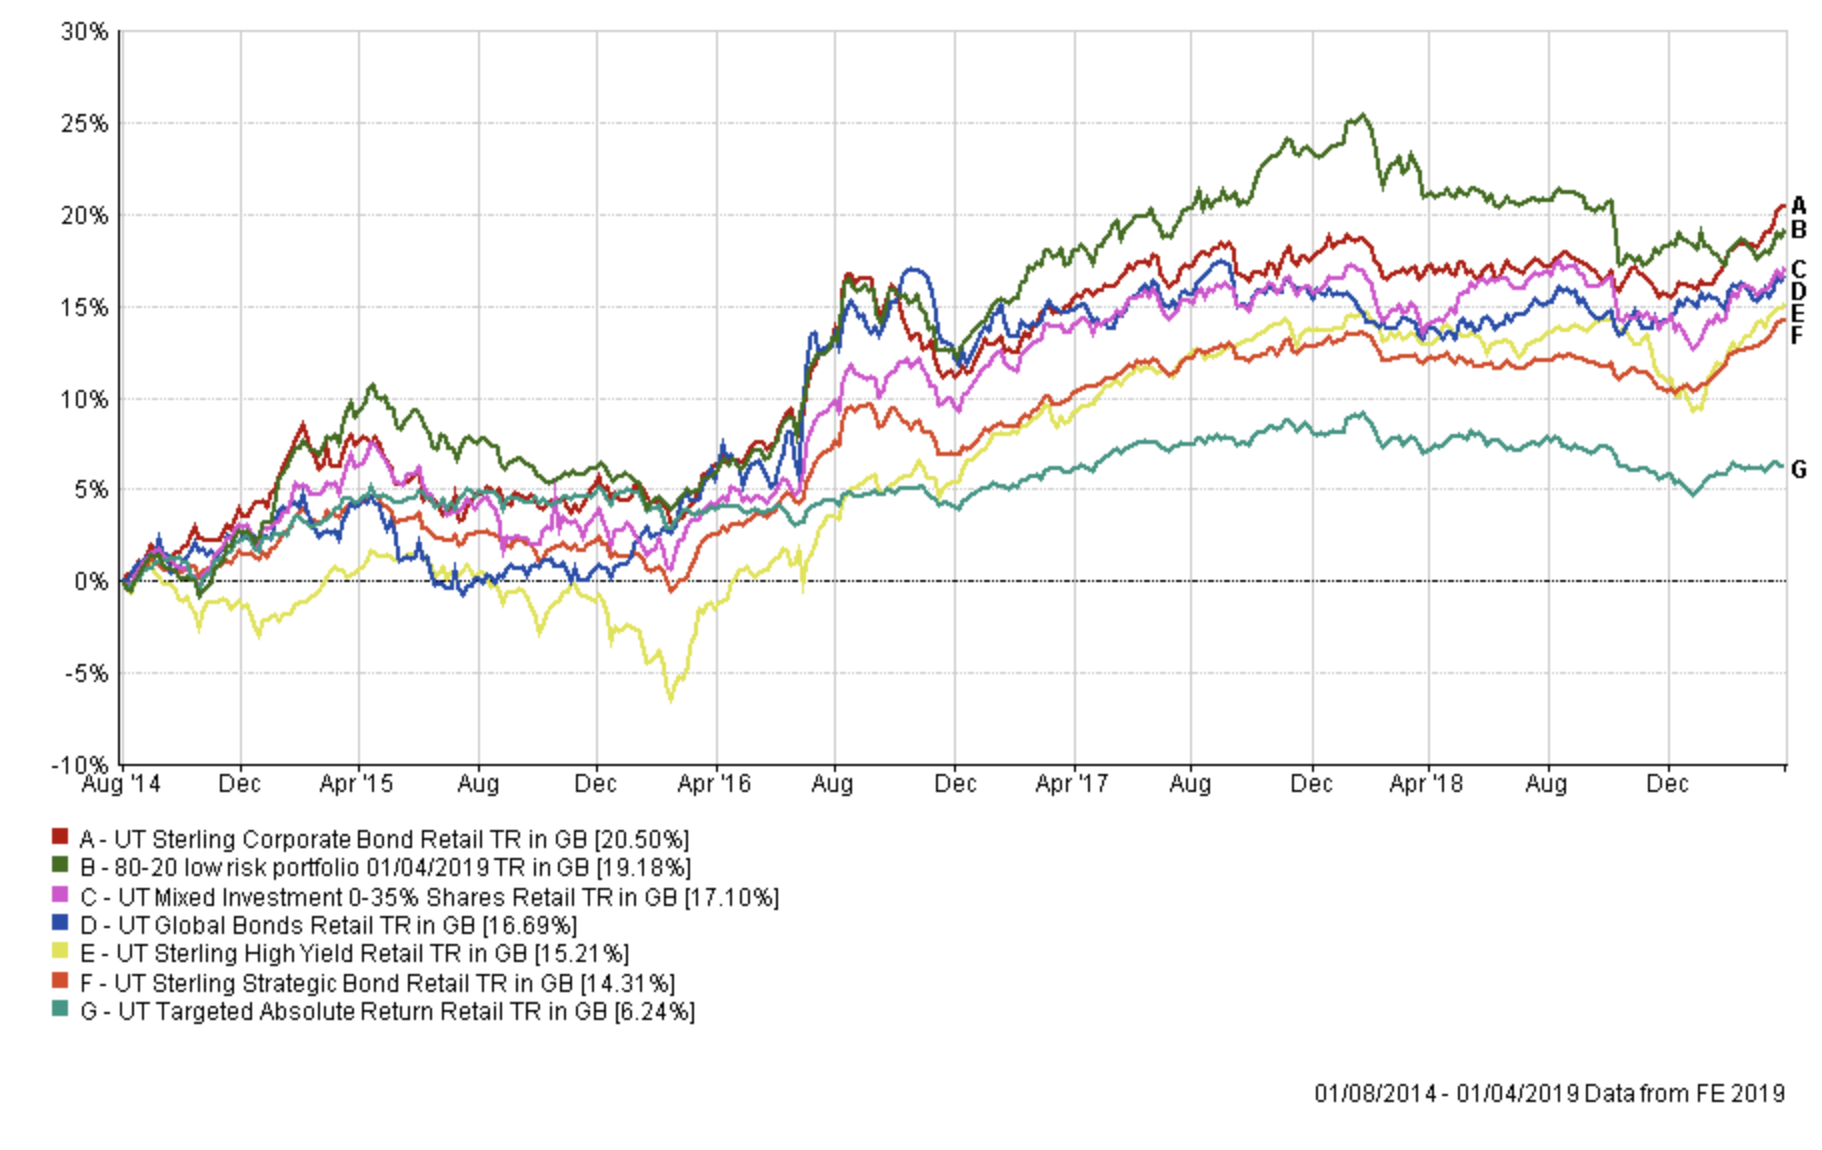
The second chart shows the performance right up until the start of April 2019. Comparing the two charts you can see how the 80-20 low-risk portfolio has consistently outperformed other sectors, especially when prospects were at their most bleak at the end of 2018. But once bond prices rallied globally at the start of 2019 the Sterling Corporate Bond sector got a boost.
The other interesting point to note from the first chart above is how the 80-20 Investor low risk portfolio outperformed both the average Mixed Investment 0-35% Shares and the Mixed Investment 20-60% Shares (the latter of which isn't shown in the chart but returned 15.82% over the period). The 80-20 Investor low risk portfolio has historically had no equity exposure, typically, but on the occasions that it has then it has had less than 15% exposure. To therefore outperform funds that have up to 60% exposure to equities, between August 2014 and December 2018, is amazing because they are taking way more investment risk. Of course since the equity rally of 2019 those funds within the Mixed Investment 20-60% Shares have since rallied strongly, outperforming the 80-20 Investor low risk portfolio with its lack of equity exposure, as you'd expect.
The key takeaway is that 80-20 Investor is not just about performance but about risk management. It's about trying to maximise returns from the level of risk you are willing to take.
Medium risk 80 20 Portfolio
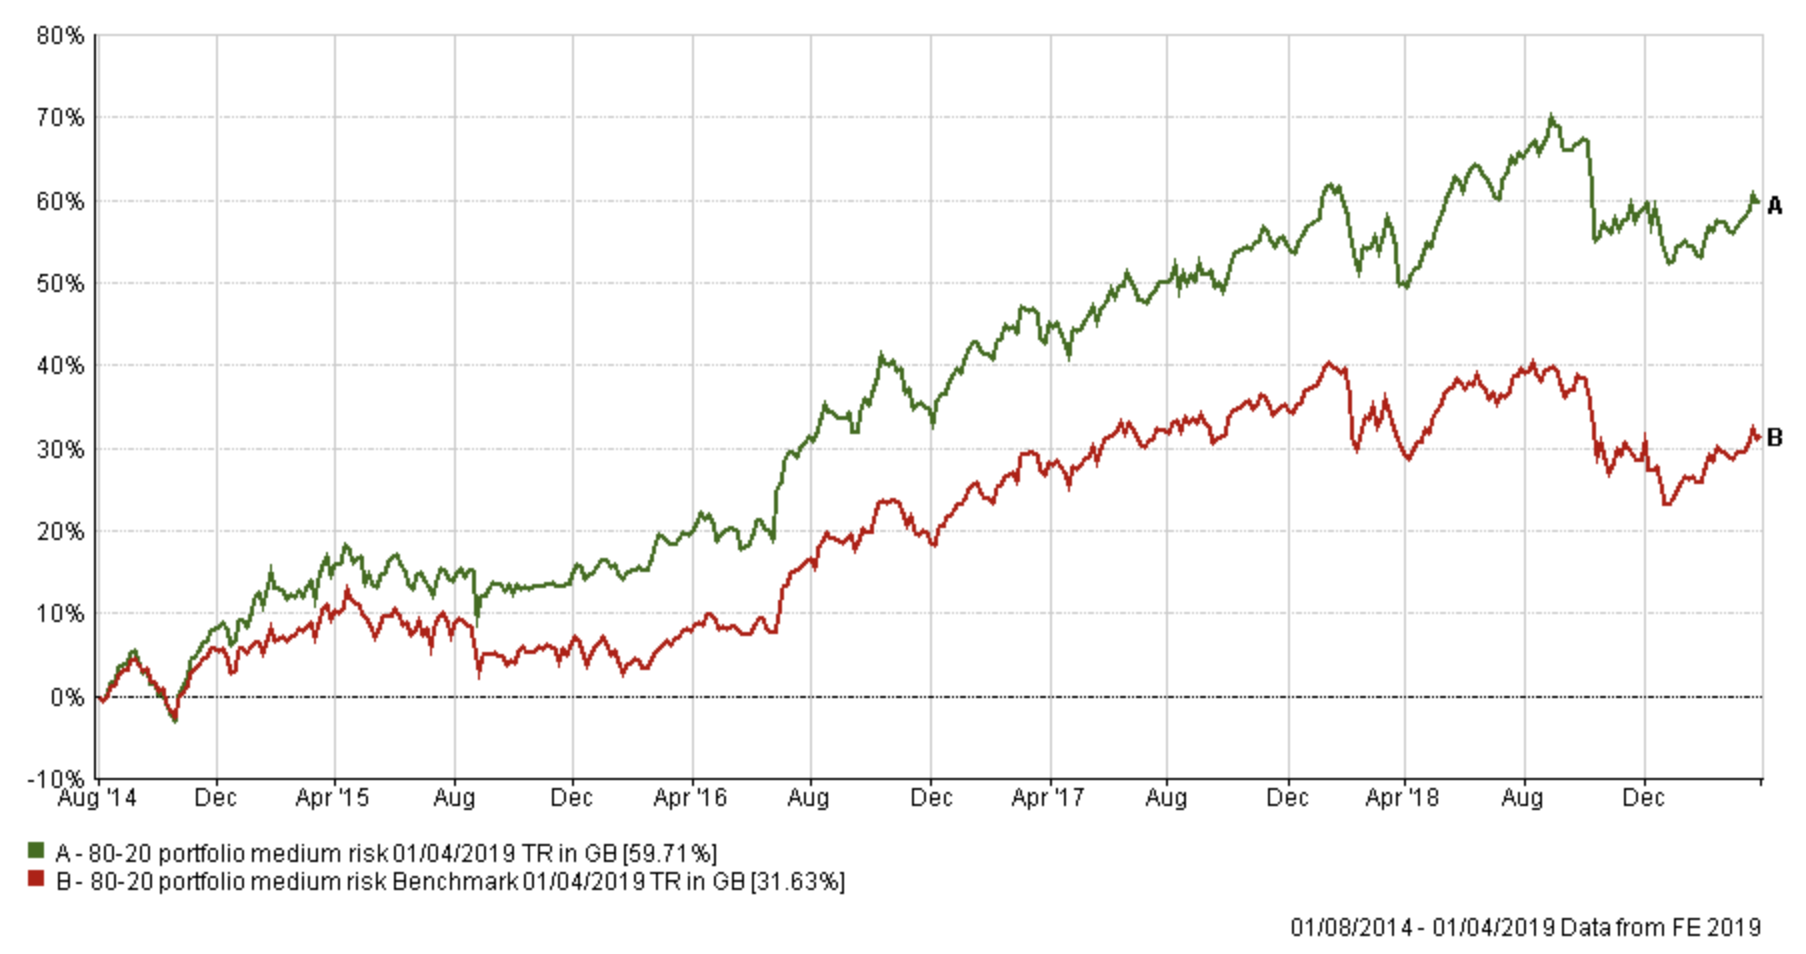
While the performance of the low-risk portfolio has been strong, momentum investing is best suited to more volatile assets classes (i.e. stocks). The chart below shows the performance of the medium risk funds from the BOTB versus a benchmark with exactly the same asset mix but taking the average return achieved by professional fund managers in the represented medium risk sectors.
Two years ago when I carried out this piece of research the 80-20 Investor medium risk portfolio had outperformed its benchmark by 17.9%. That lead has since extended to a whopping 28.08% as shown in the table below.
Last time I pointed out how pleased I was with how the portfolio performed during the summer of 2015. This time I want to highlight the performance since April 2017, see the chart below in which I also overlay the FTSE 100 return (click to enlarge).

2017 was a great year, especially for a momentum-based investment strategy. However, you will notice that from April 2017 its benchmark, for all its subsequent moves up and down, ended marginally down (-0.09%) while the 80-20 Investor medium risk portfolio gained 6.58%. Also, a particularly strong summer in 2018 resulted in the 80-20 Investor medium risk portfolio adopting a steadily rising uptrend, compared to the flattening trend of the FTSE 100 and the 80-20 Investor medium risk portfolio benchmark.
The outperformance in 2015 and the latter period through 2017 and 2018 are a result of the dynamism of the 80-20 medium risk portfolio. The medium risk portfolio is perhaps the most dynamic of the three risk portfolios because it can vary the range of investments which it invests in. It can theoretically have a 100% equity exposure while on other occasions it invests in managed funds as well as global bond funds. By way of example, back in autumn 2016 the medium risk portfolio had a 60% equity exposure while in the summer of 2018 this peaked at around 100%. Yet in the aftermath of the correction at the end of 2018 the portfolio's equity exposure dropped down to 30%.
High risk 80 20 Portfolio
The chart below shows how the high risk portfolio fared against its benchmark.
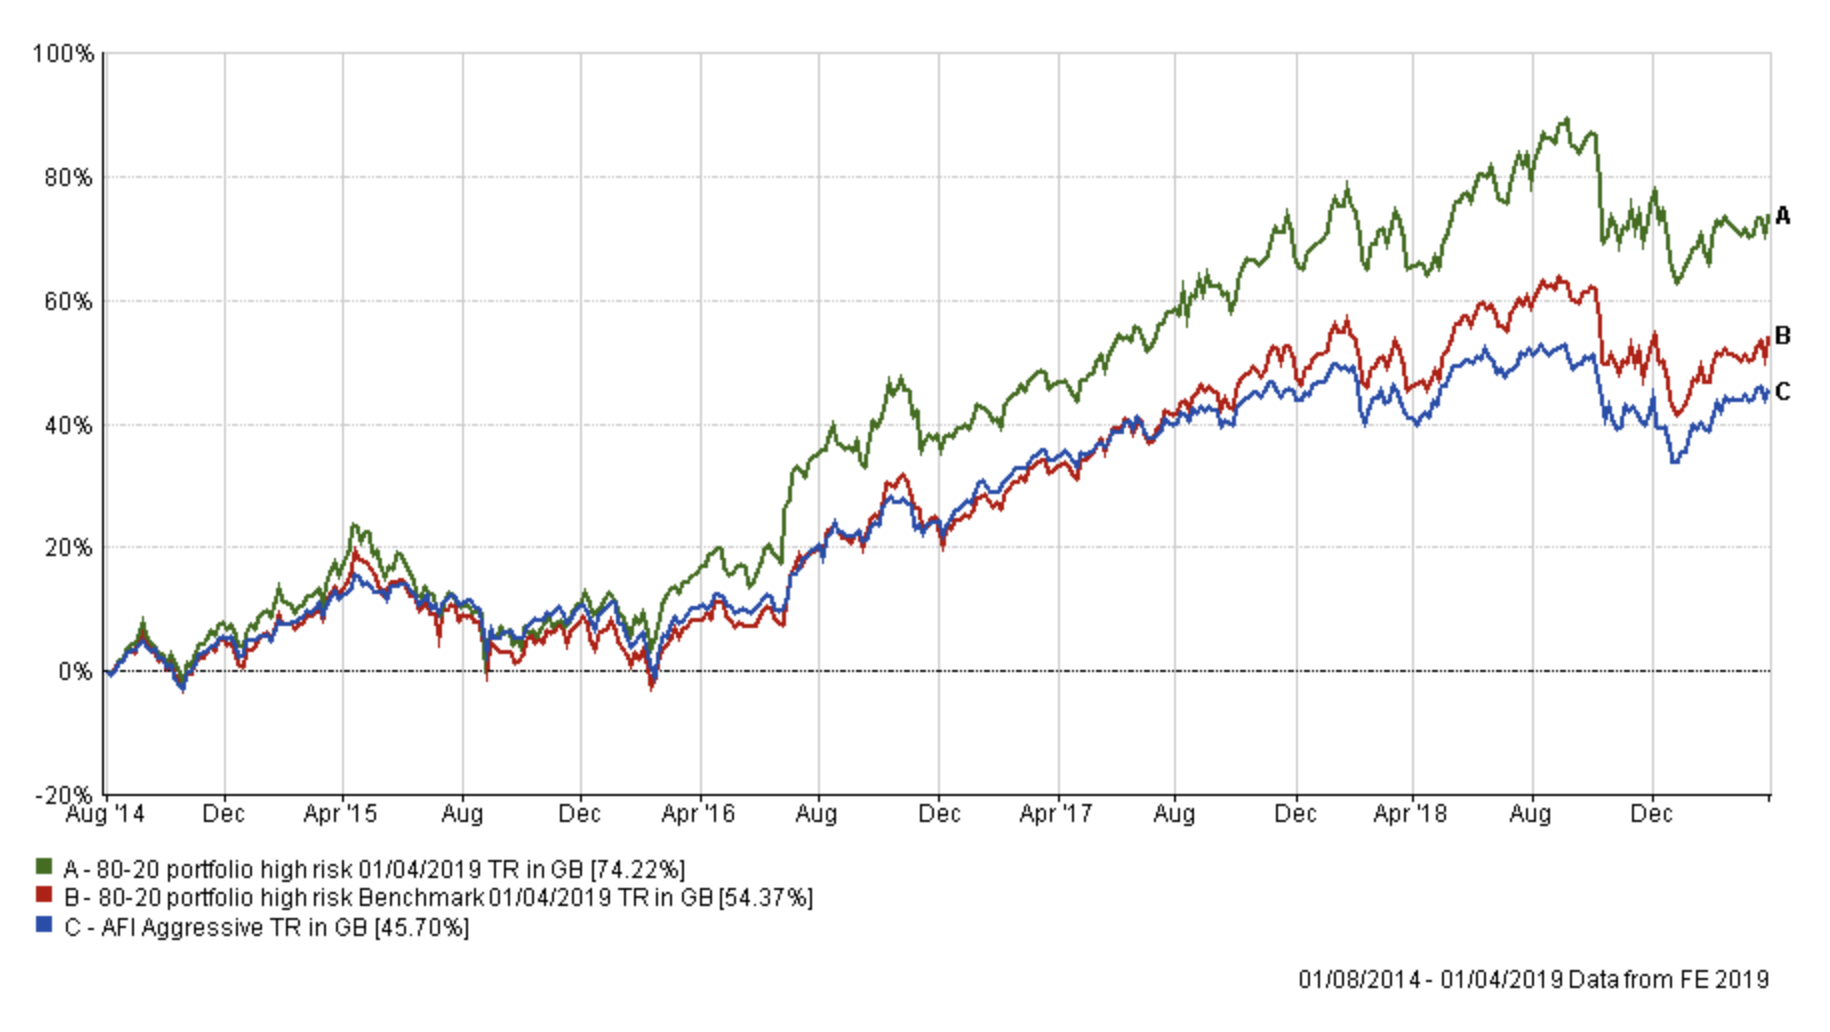
What is interesting is not only how much the portfolio has extended its lead over its benchmarks but how it has extended its lead over the 80-20 medium risk portfolio, obviously with a higher level of volatility. Two years ago the outperformance was marginal but since then (as shown in the chart below) the high risk portfolio has accelerated to the upside. It just goes to show that the success of a momentum-based investing approach is best judged over a longer time frame, rather than the short term.
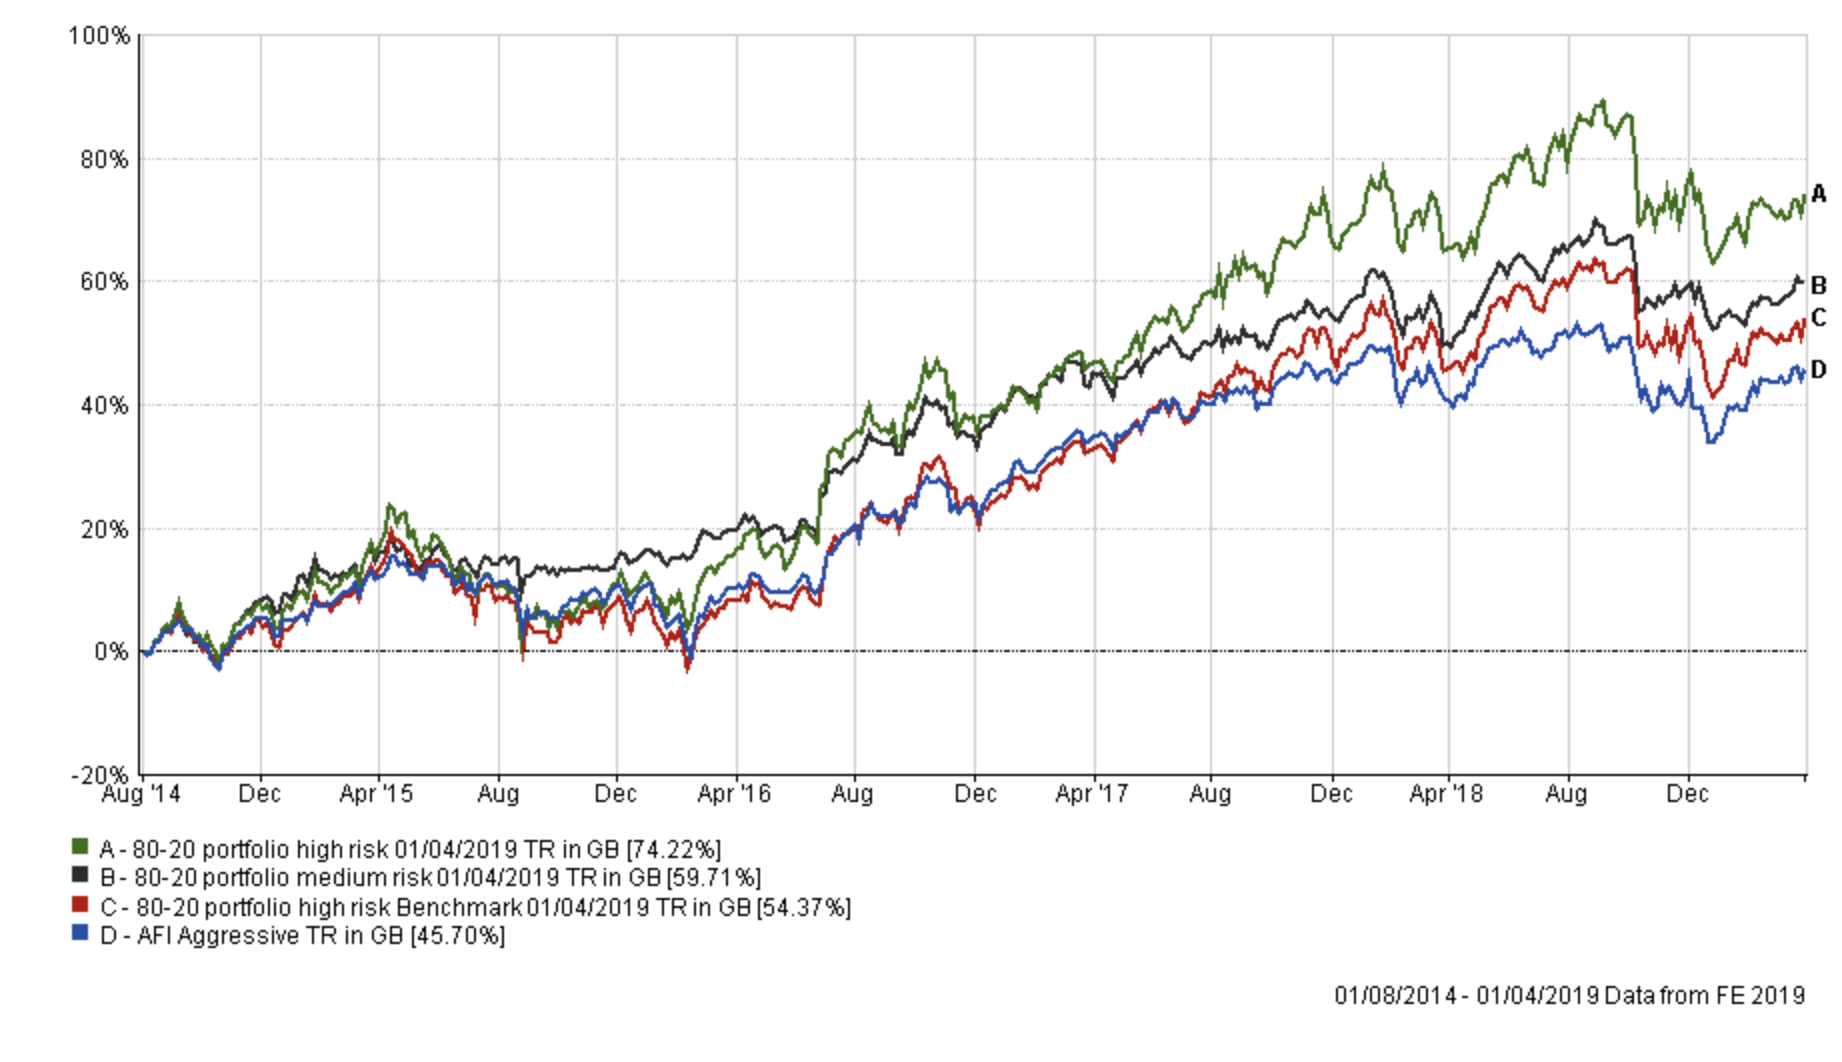
It is also interesting to see how the medium risk portfolio has outperformed both the 80-20 high risk portfolio benchmark and the AFI Aggressive portfolio (which is a 'portfolio based fund index chosen by the UK's leading financial advisers).
Another way of looking at the chart above is that the blue line is the benchmark showing the average return achieved by financial advisers taking the same level of risk with their portfolios. The red line shows what the average multi-asset fund with comparable equity content to that of the 80-20 high risk portfolio achieved. In other words, the red line shows the extra performance added by just the asset mix of the 80-20 high risk portfolio (where it was invested i.e European equities etc). While the green line shows the impact of being in the right funds at the right time, as identified by the 80-20 Investor algorithm.
Risk/return profile
As in the original piece of research, I have mapped the AFI equivalent high risk portfolio onto the earlier chart. This is the 'portfolio based funds index chosen by the UK's leading financial advisers'. You can view the panelists here but in short they are the people who you see quoted in the national press at the weekend. What is interesting is that their aggressive portfolio underperforms both the 80-20 Investor high risk benchmark and the 80 20 Investor medium risk portfolio (which takes much less risk). There are in fact three AFI indices produced namely Cautious, Balanced and Aggressive.
The table below summarises their annualised performance, volatility and Sharpe ratio. Volatility is the variability in the returns (so how wiggly the line is in the charts above) and Sharpe is a measure of how the risk being taken is being rewarded. So the higher the Sharpe ratio the better.
| Name | Annualised return | Sharpe | Volatility |
| 80-20 portfolio high risk | 12.74 | 0.67 | 13.8 |
| 80-20 portfolio medium risk | 10.77 | 0.74 | 9.85 |
| AFI Aggressive | 8.66 | 0.5 | 10.23 |
| AFI Balanced | 6.62 | 0.41 | 7.54 |
| AFI Cautious | 4.94 | 0.26 | 5.52 |
| 80-20 low risk portfolio | 3.94 | 0.11 | 3.85 |
The key points to highlight this time around are:
- that the medium and high risk 80-20 portfolios outperform all of the 'experts'' portfolios.
- for the medium and high risk 80-20 portfolios the Sharpe ratio numbers are far superior to those of the AFI. In each instance when you compare like for like portfolios (i.e AFI balanced with 80 20 medium risk) the 80 20 portfolios' ratios are always higher. What this means is that any extra risk taken is rewarded.
- this also means that the expert IFAs are still trying to boost returns by simply taking more risk but it isn't being rewarded.
- their returns are hugely inferior with the exception of the low risk portfolio where the AFI Cautious portfolio has marginally outperformed and it has a better sharpe ratio
- however bear in mind that the AFI Cautious portfolio takes more risk (reflected by the higher volatility number). The AFI cautious portfolio has around 40% in stocks whereas the 80-20 low risk portfolio barely has any as previously explained.
What are the takeaways of this research
First of all it's fair to say that a momentum-based strategy (such as the 80-20 Investor algorithm) really comes into its own when you are investing in medium and high risk funds. However it does still manage to boost performance in the low risk portfolio by managing risk, as highlighted by its low volatility measure and lack of equity exposure.
With more than 4 and a half years of data it is good to see the medium and high risk portfolio performing exactly as they should, with the latter now outperforming the former by a significant margin. Yet again the risk/return profiles of each portfolio are impressive compared to their professional 'expert' peers, making full use of their dynamism to change their asset allocation according to the prevailing market conditions. Bear in mind that the 'experts' would charge typically a 3% initial fee for implementing their tips along with up to a 1% annual charge. This isn't reflected in the return figures above, and neither is the cost of 80-20 Investor but that is minimal by comparison.
The results of this research piece highlight an important message that 80-20 Investor members should grasp. 80-20 Investor is about risk management as well as trying to optimise performance. It is possible to produce a range of outcomes using the 80-20 Investor research and therefore build a mind-boggling number of portfolios, as you see fit. The four hypothetical portfolios (the BOTB, the 80-20 high risk portfolio, the 80-20 medium risk portfolio and the 80-20 low risk portfolio) plus my real £50k portfolio are just five possible outcomes with varying degrees of risk. For example, my £50k portfolio historically has averaged around a 50% exposure to equity while the medium risk 80-20 portfolio has averaged roughly 75% exposure. The high risk 80-20 portfolio is almost always 100% equity.
That is why when people ask how does 80-20 Investor compare against certain indices or model portfolio the question should be which version of an 80-20 Investor portfolio are you talking about? That also explains why some of you will have outperformed my £50k portfolio with your own portfolios that you have built while others may have not.
The idea behind 80-20 Investor is that it is flexible and allows people to use it how they choose. However, bear in mind that the medium risk portfolio can vary its asset mix quite considerably. In the last year alone its equity content has varied from 90% to 30%. That means that the risk profile of a portfolio based solely on those funds would change significantly. So whichever portfolio you build make sure you look at the underlying asset mix (the 80-20 Investor asset allocation tool can help with that).
Ultimately 80-20 Investor is about the process and the above analysis shows that it's robustness has been proven in the field over the last four and half years whatever level of risk you wish to take within your portfolio.

£200 Pension Cashback Offer
Make a qualifying deposit or transfer a pension to our partner Interactive Investor.
- Deposit or transfer a pension of at least £20k and you could earn £200 cashback
- Terms and Fees apply, Capital at risk
- New & Existing customers opening a SIPP
- Offer ends 31st July 2026
Before starting your transfer, check you won't lose any valuable benefits (such as guaranteed annuity rates or a lower protected pension age) and find out what exit fees you might have to pay
