

The background to my portfolio
Back in March 2015 I decided to invest £50,000 of my own money using 80-20 Investor. The purpose was twofold, firstly to show how you can use 80-20 Investor to invest and outperform the market with only a few minutes effort every now and then. Secondly, no other investment commentator, journalist or research provider invests their own money for fear of failing. This is a sorry state of affairs and is precisely why I committed to openly running my own portfolio for 80-20 Investor members to see.
Since then I have periodically changed my portfolio using the fund suggestions provided by the 80-20 Investor algorithm and associated research. I always disclose the changes at the time they are made.
Performance update
As is usual in my portfolio reviews, the chart below shows how my portfolio has outperformed since I started the challenge in March 2015. The green line is the performance of my portfolio while the red line is the benchmark showing the average return achieved by professional fund managers given the same asset mix. To accurately calculate this I have used the average return for each sector in which my portfolio invested. The blue line shows what the average multi-asset fund with comparable equity content achieved. In other words, the red line would show the extra performance added by just the asset mix of my portfolio (where I was invested i.e European equities etc) over picking a typical multi-asset fund (the blue line). While the green line (which is my actual performance) shows the impact of being in the right funds at the right time, as identified by the 80-20 Investor algorithm.
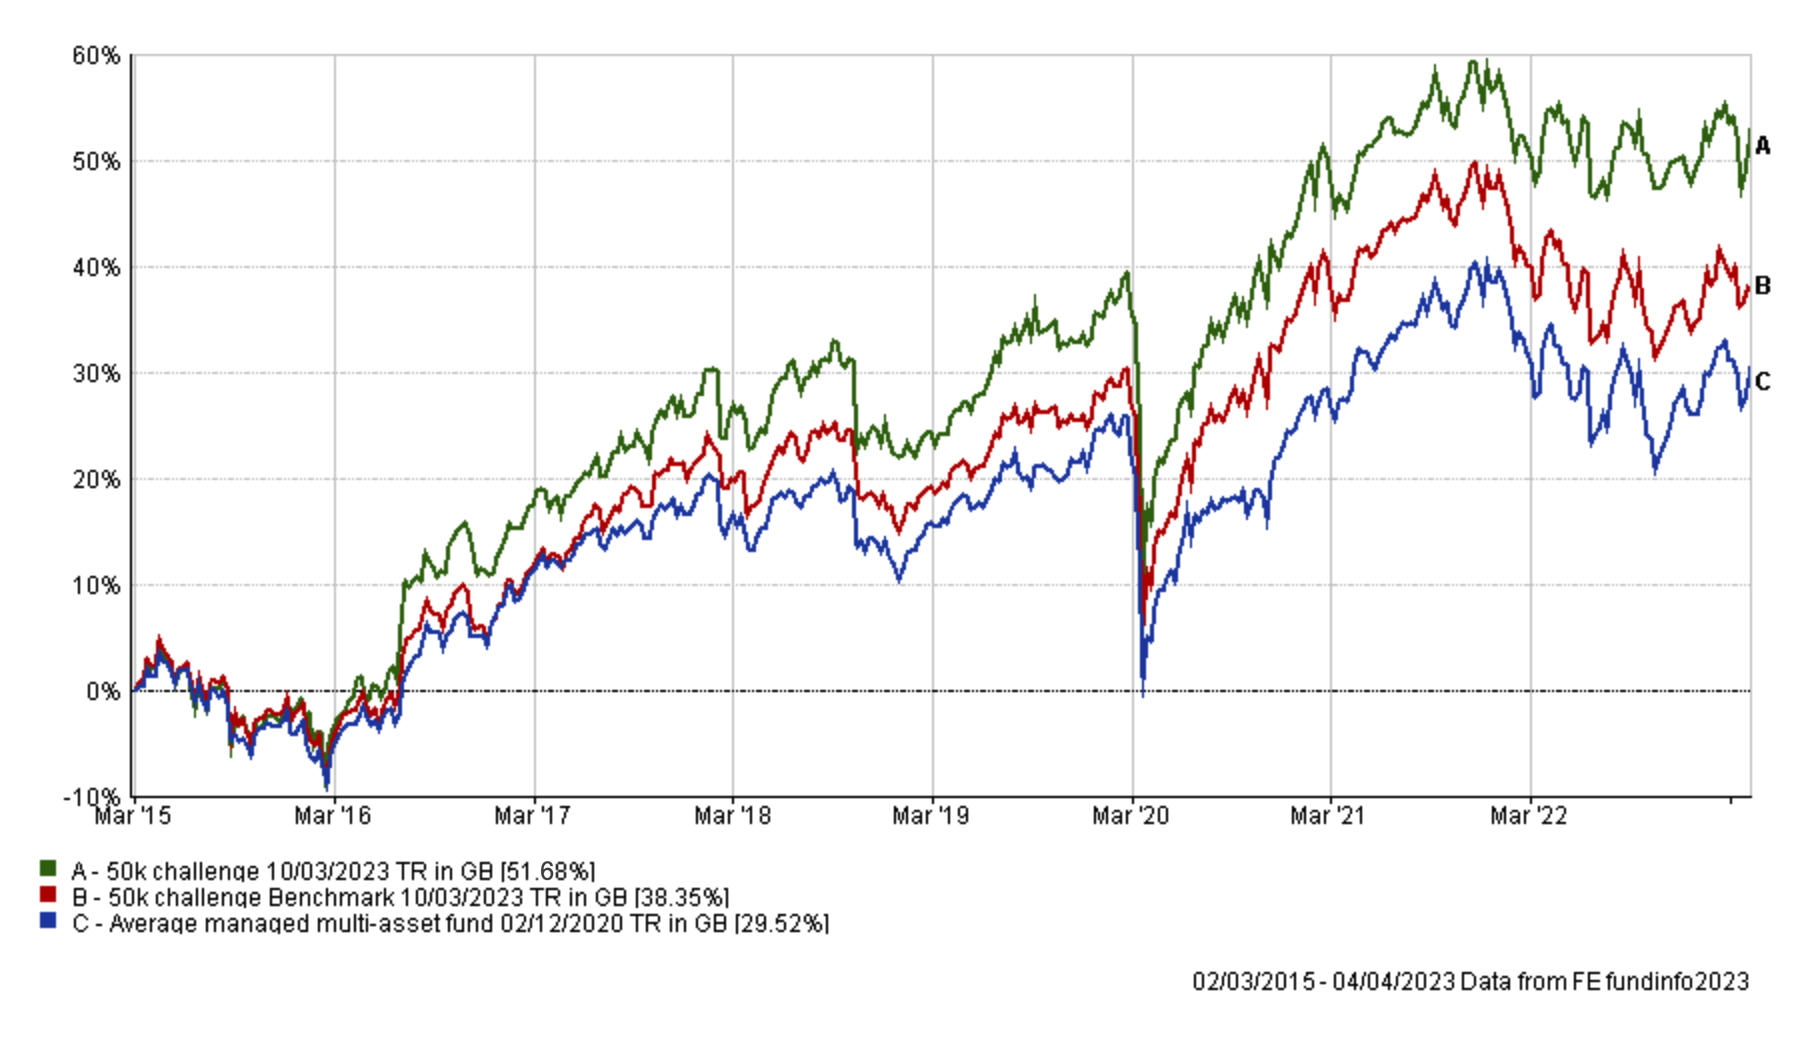
As the chart above shows, my portfolio continues to outperform its benchmarks over the last 8 years. However, March 2023 will be remembered historically as the month when a banking crisis threatened the US banking system (and by osmosis the entire global banking system) forcing governments, central banks and regulators to take emergency action to try and avoid a full-blown financial crisis.
If you've been reading my regular newsletters you will be well aware of the dramatic impact on equity and bond markets, with the epicentre being banking stocks. The crisis inspired both the research article 'Equity funds exposed to the 2023 banking crisis' as well as the latest update to the stress test tool.
If you look at the chart below, showing the performance of my portfolio since my last review, you can see how the stock market slump caused by the banking crisis initially hit my portfolio (the green line) before it eventually recovered as the crisis abated. However, it meant that my portfolio lagged its benchmark (in red), which is based upon my portfolio's actual asset mix, yet it still performed in line with the average managed multi-asset fund.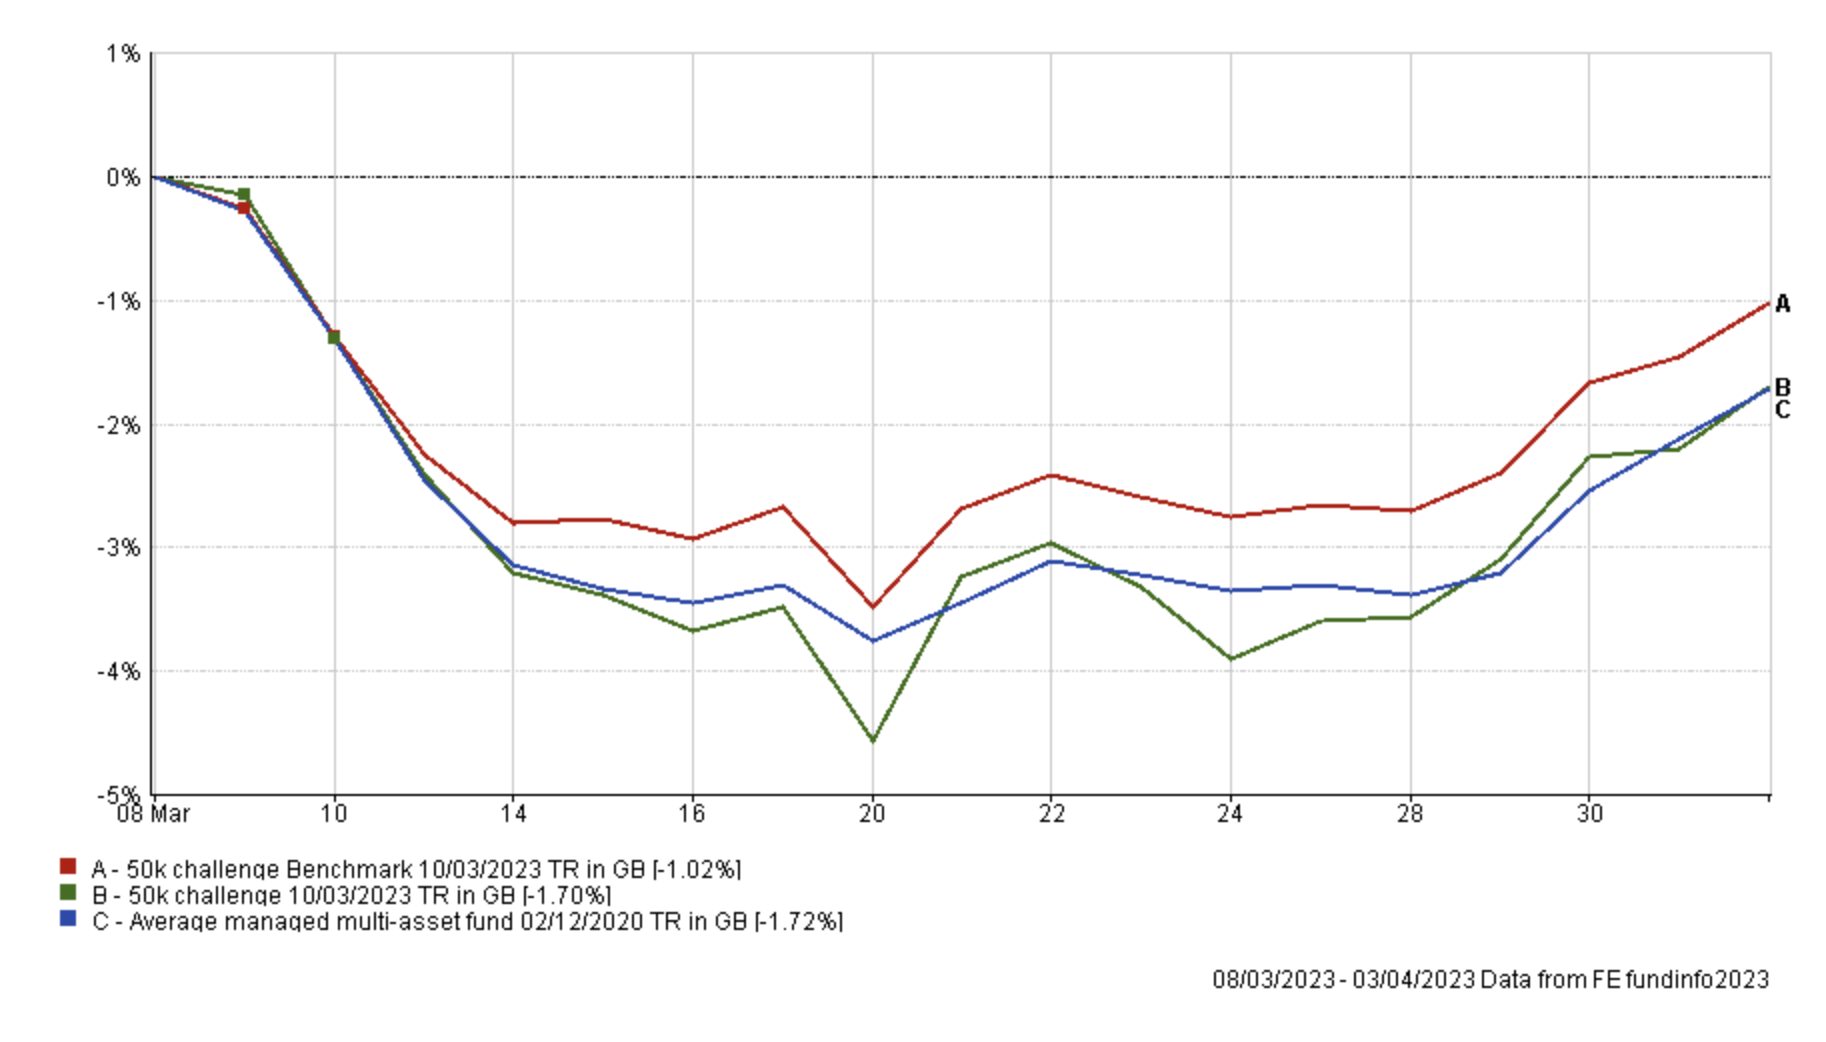
Interestingly banking stocks had strong momentum heading into 2023 and up until the start of March, as central banks continued to raise interest rates to combat inflation. As a result, the fact that my portfolio has exposure to banking stocks is not surprising. Having ridden the positive momentum when bank stocks rallied over the prior six months or so, the flip side was that when that momentum reversed over a 10 day period in March it impacted my portfolio's short term performance, as bank stocks gave up their 2023 gains. However, the diversified nature of the funds within my portfolio and the overall asset mix explains why my portfolio still finished the month in line with the professionally managed peer group average.
The table below shows the individual performance of each fund in my portfolio between the 8th March (when I carried out my last review) up until 4th April (which is the date of my latest portfolio valuation). The standout performer was gold, which benefited from the fall in the US dollar index as well as the demand for haven assets as investor fear increased. The latter was an integral reason why bonds also performed well in March (as shown by the 80-20 Investor growth heatmap), but the market's revised outlook for monetary policy (i.e that central banks would begin cutting interest rates later this year) also played its part in helping bonds to rally.
|
Fund |
Performance since last review on 8th March (up to 4th April) |
| iShares Physical Gold ETC | 4.64 |
| abrdn High Yield Bond | 0.52 |
| Cash | 0 |
| Thesis TM Tellworth UK Select | -0.4 |
| Invesco Global Bond (UK) | -0.95 |
| Jupiter Merlin Balanced Portfolio | -1.95 |
| BNY Mellon Global Income | -2.33 |
| M&G Global Dividend | -2.88 |
| BlackRock Natural Resources Growth & Income | -4.19 |
| FSSA Asia Focus | -4.23 |
| Jupiter Global Value Equity | -4.26 |
| TB Saracen Global Income & Growth | -4.44 |
| Jupiter Income Trust | -4.82 |
| LF Brook Continental European | -5.44 |
If you look at the funds propping up the table it was somewhat unfortunate that the bottom three were funds that I either introduced to my portfolio last time or increased my exposure to. It goes to show that you win some and you lose some. Having said that, Fidelity American Special Situations which I replaced last time lost 6.25% over the same period so it would have propped up the entire table above had I still held it. On another positive note, the banking crisis started on the 8th of March, which meant that the initial sharp drop in bank stocks occurred while last month's fund switches were being processed. This meant that money that ultimately was destined for the aforementioned funds was sat in cash during the first 24 hours of the banking crisis. This was fortunate as it ultimately meant that my portfolio marginally benefited as shown in the chart below, when compared to if I hadn't made the switches.
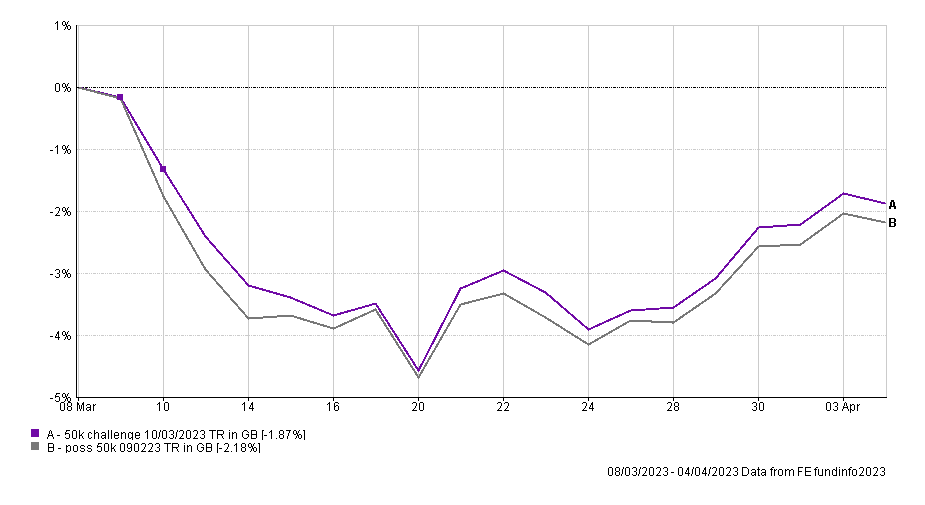
As the banking crisis escalated and fear peaked on 20th March my new portfolio underperformed my old portfolio. But then it rebounded more strongly when banking stocks began to recover. So I missed some of the downside in equity markets but captured all of the rebound with my new fund choices, which was fortunate timing. That is the risk when making fund switches, sometimes markets move against you, and sometimes for you. This time it was the latter.
So the question then is, has the banking crisis gone away? In truth no one knows the answer, but clearly there remain some signs of stress in regional US banks. There is no denying that if we have an escalation in the banking crisis then we would see those funds that struggled in March struggle once again. On the flip side if bank stocks rally hard then those funds in my portfolio that lagged in March will be the biggest beneficiaries.
Before I get into the fund changes I will make this month, as usual the table below shows which funds within my portfolio are in the current BOTB or BFBS tables and which are not. Those funds in blue are still in the BOTB while those in orange are not in the BOTB but remain in the BFBS list. Meanwhile, any funds in red have dropped out of both shortlists.
| Fund | Allocation | Risk | Sector | ISIN |
| abrdn High Yield Bond | 9 | Low | Sterling High Yield | GB00B79RR984 |
| BlackRock Natural Resources Growth & Income | 4.5 | High | Commodity/Natural Resource | GB00B6865B79 |
| BNY Mellon Global Income | 6.5 | Medium | Global Equity Income | GB00B7XK5M25 |
| Cash | 7 | Low | ||
| FSSA Asia Focus | 5 | High | Asia Pacific Excluding Japan | GB00BWNGXJ86 |
| Invesco Global Bond (UK) | 9 | Low | Global Bonds | GB00B3RW7B97 |
| iShares Physical Gold ETC | 5 | Medium | Commodity & Energy ETF | IE00B4ND3602 |
| Jupiter Global Value Equity | 10.5 | Medium | Global | GB00BF5DRF26 |
| Jupiter Income Trust | 5 | Medium | UK Equity Income | GB0004791389 |
| Jupiter Merlin Balanced Portfolio | 12.5 | Medium | Mixed Investment 40-85% Shares | GB0031845141 |
| LF Brook Continental European | 4 | High | Europe Excluding UK | GB0031831570 |
| M&G Global Dividend | 7 | Medium | Global Equity Income | GB00B46J9127 |
| TB Saracen Global Income & Growth | 9.5 | Medium | Global Equity Income | GB00B5B35X02 |
| Thesis TM Tellworth UK Select | 5.5 | Low | Targeted Absolute Return | GB00BNY7YM73 |
You can see that March had a dramatic effect on the momentum within investment markets. If you look at the BOTB for April only 13 funds remained from March's selection which is the fewest for some time. Ordinarily one month's performance data wouldn't have such a dramatic impact on momentum but March was a month where markets were turned on their head. Key equity indices struggled and bonds began outperforming, especially UK bonds as they didn't suffer the negative impact of currency moves which global bond funds endured as the US dollar tumbled.
Looking at the table above five funds have dropped out of the BOTB and BFBS tables. At the peak of investor fear during the banking crisis I benefited from not making any knee-jerk decisions which meant I was able to benefit from the subsequent rebound in equity markets. Now that there is a period of calm I plan to make a number of changes this month which will aim to reduce my portfolio's sensitivity to the fortunes of the banking sector.
First of all I plan to remove exposure to LF Brook Continental European and Jupiter Income Trust from my portfolio, so undoing some of last month's portfolio changes. If you use the latest stress test tool you can see that both get the lowest rating for the banking crisis stress test, while the LF Brook Continental European performs badly for the recession test too. While LF Brook Continental European is still in the BOTB the performance of my portfolio during March emphasises the need to reduce the bank stock exposure in my portfolio and LF Brook Continental European has by far the most significant exposure of any fund within my portfolio - see "Equity funds exposed to the 2023 banking crisis". Jupiter Income trust has fallen out of both the BOTB and BFBS tables and is coloured in red.
It is worth pointing out that TB Saracen Global Income & Growth (which is also in April's BOTB) also has exposure to bank stocks, but the reason I chose to change LF Brook Continental European & Jupiter Income trust is that they were the biggest drags on my portfolio during March, as shown in the earlier table.
Moving on to FSSA Asia Focus and Thesis TM Tellworth UK Select, both of these have recently fallen out of the BOTB and BFBS tables (and are coloured in red in the table above). Thesis TM Tellworth UK Select has been a star performer in the low-risk element of my portfolio since I first held it back in February 2022. The chart below shows the performance of the fund (in pink) versus the average UK corporate bond fund (brown line), the average global bond fund (green line) and the average Targeted Absolute Return fund (yellow line).
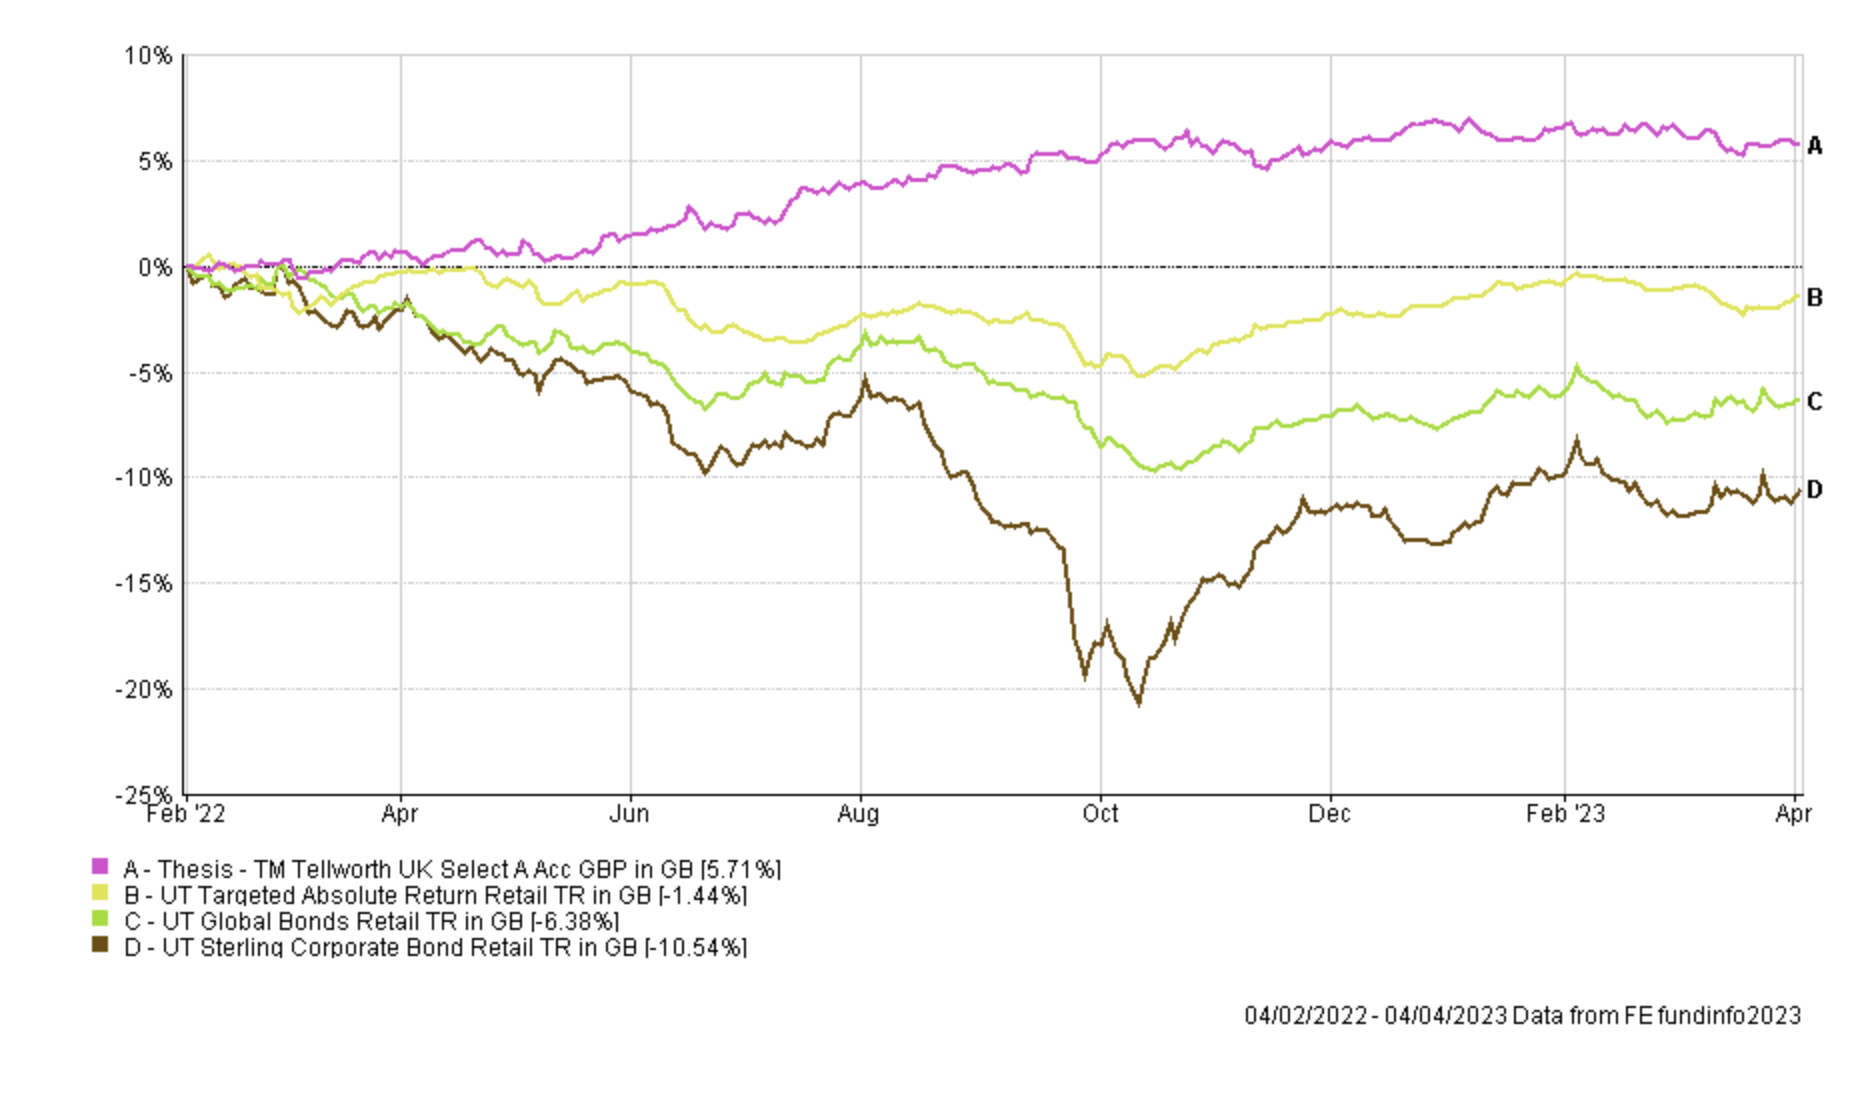
The fund made money in 2022, something of a rarity across any asset class or fund. For once it was an example of a Targeted Absolute Return that achieved an absolute return in a difficult market. However, as you can see from the chart above, the fund has gone nowhere for 4-6 months especially when compared to the momentum we've seen in some of its peers from the same sector as well as bond funds. However, I will give it a stay of execution for now as I will be making a number of other fund switches this month, meaning the fund is now on my watchlist.
FSSA Asia Focus has marginally underperformed the average of its peers since I've held it, as shown below.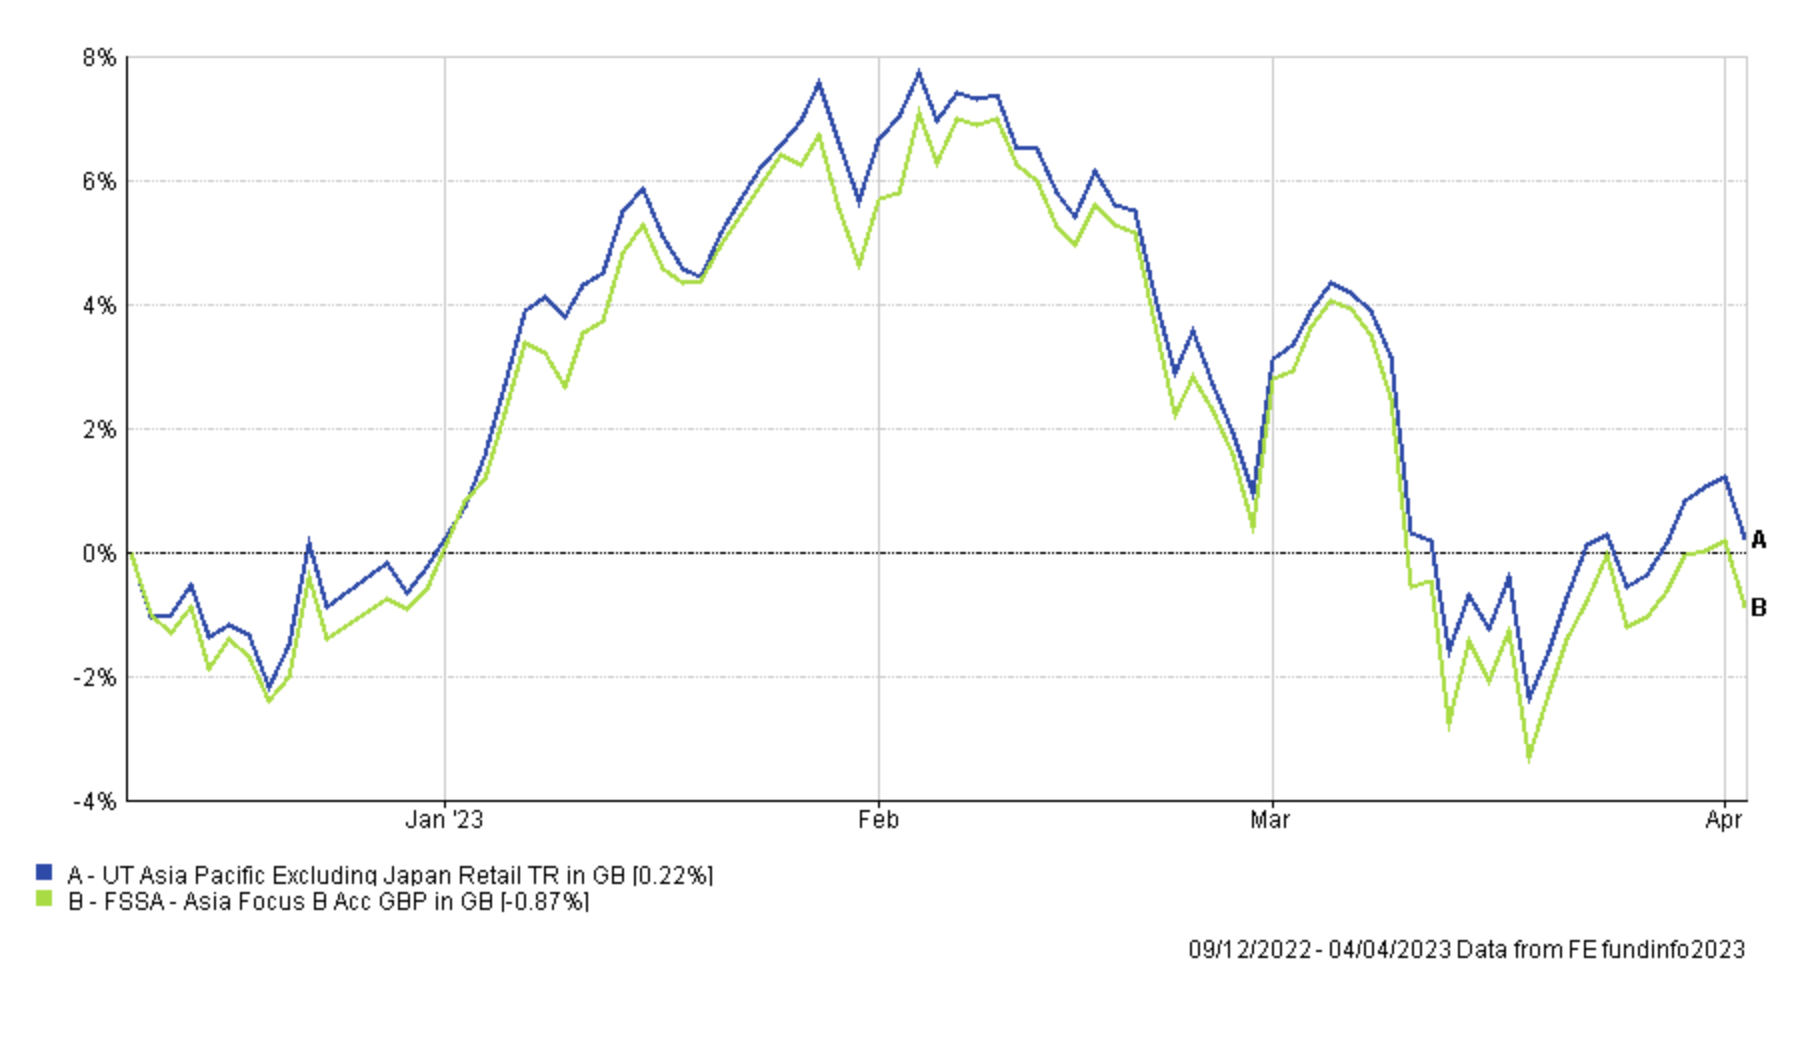
While not a disaster I plan to make a like-for-like switch (i.e with a fund from the same sector) that is now in the BOTB and BFBS tables.
The other two funds that are highlighted red in the earlier table are Jupiter Merlin Balanced Portfolio and Invesco Global Bond (UK). Both of these were among the strongest performers during March so I will put them on my watchlist rather than remove them this time. Again, this is because I plan to make another fund switch elsewhere so I want to keep further changes to my portfolio to a minimum.
The chart below shows the performance of BlackRock Natural Resources Growth & Income since I first held it back in 2021.
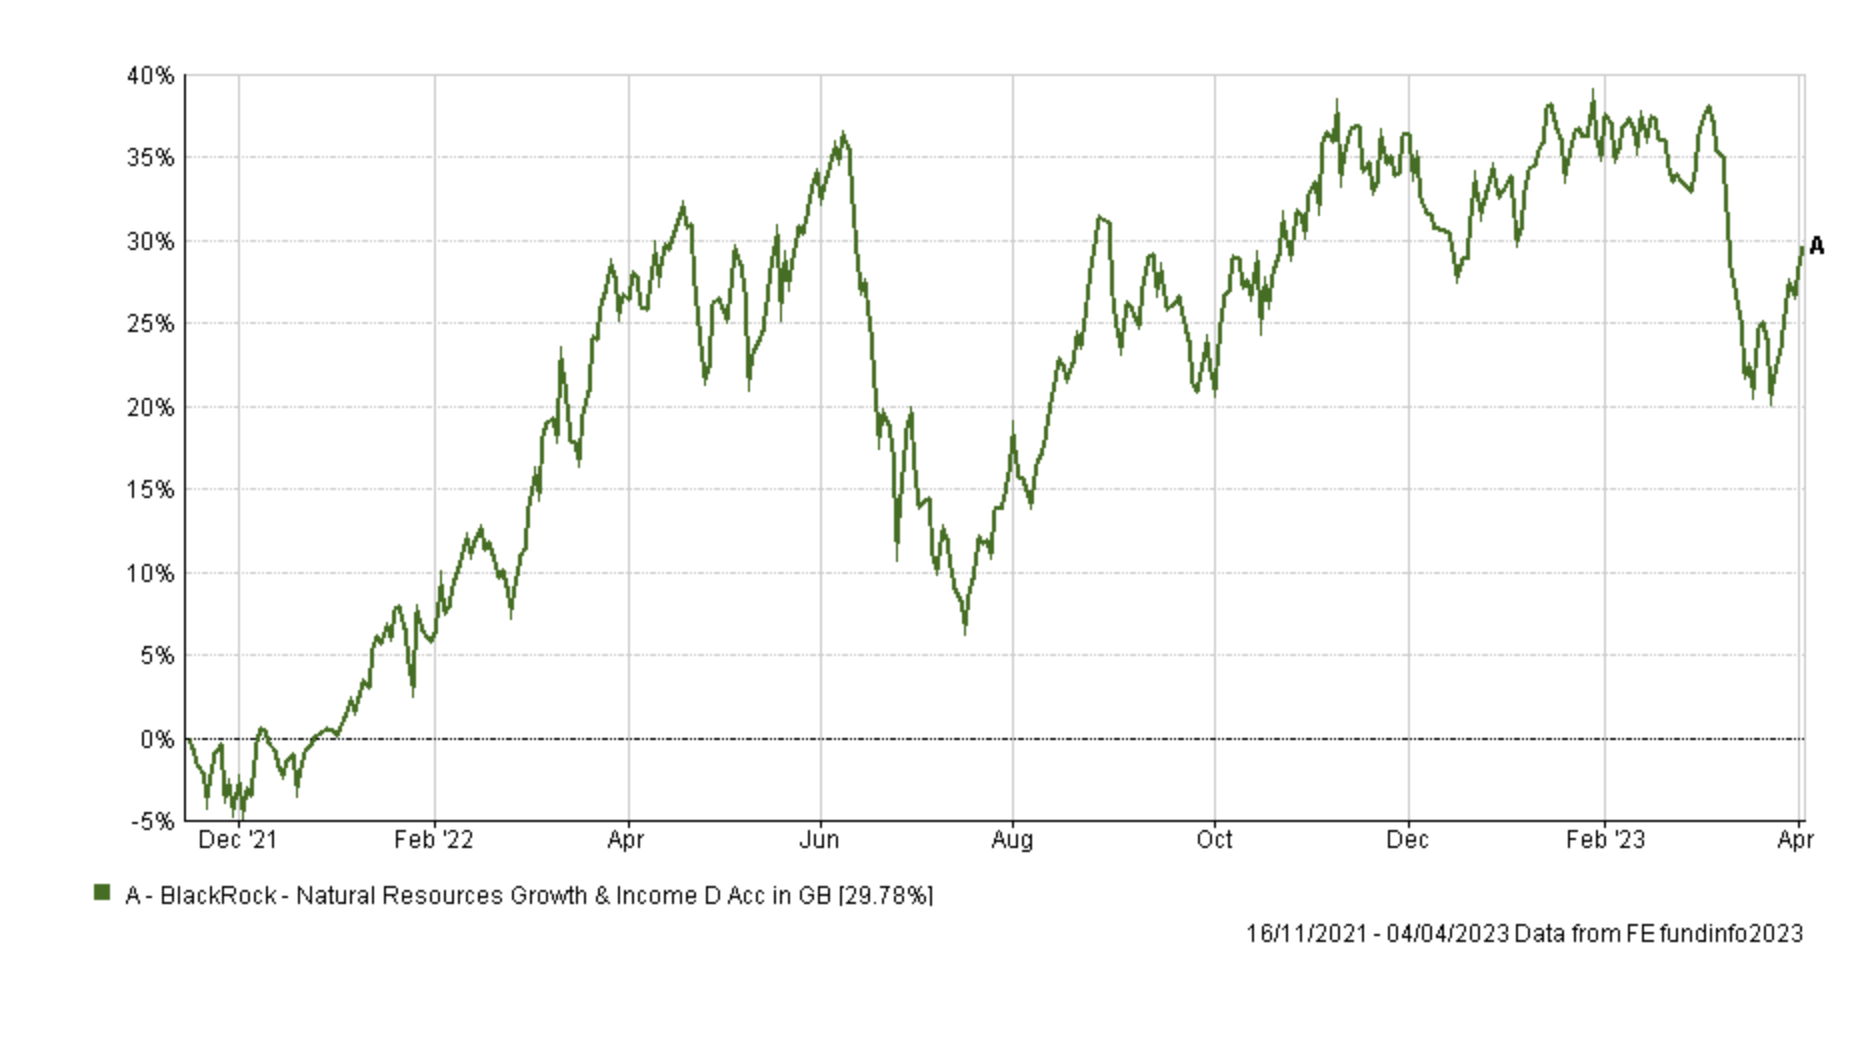
The fund performed fantastically well during 2022, after recovering from a significant fall mid-year. The fund benefited from the rapid rise in inflation, driven by soaring energy prices. However the fund has made little headway since late summer of 2022 as markets began betting that inflation had peaked and that global economic growth might falter. In fact, despite the rebound in the second half of 2022 the fund remains below its June high-point and is only just hanging onto its place in the BFBS tables. It has not become a bad fund but other momentum opportunities lie elsewhere, particularly in equities. Interestingly, BlackRock Natural Resources Growth & Income also performed badly during the banking crisis, largely a result of fear that the crisis would escalate into a financial crisis which in turn would hit global growth and therefore the demand for commodities. So by removing this fund I am also reducing the portfolio's risks associated with a banking crisis escalation.
In summary, the planned transactions impact 19% of my portfolio which includes all of the high risk funds within my portfolio. The fund switches are listed below and in most instances are like-for-like swaps for funds that are in the same sector which are also in April's BOTB and fared better in the banking crisis stress test. The exception is where I will switch out of BlackRock Natural Resources Growth & Income into CT European Select. This switch increases my European equity exposure more in line with that of the BOTB and removes my commodity exposure (with the exception of my gold holding).
Fund switches
- 100% out of BlackRock Natural Resources Growth & Income and 100% into CT European Select
- 100% out of LF Brook Continental European and 100% into CT European Select
- 100% out of Jupiter Income Trust and 100% into AXA Framlington UK Equity Income
- 100% out of FSSA Asia Focus and into Invesco Asian Equity Income (UK)
The fund changes this month impact approximately 19% of my portfolio and reduce the number of holdings within my portfolio by one.
My portfolio
My portfolio now looks like this:
| Fund | Allocation | Risk | Sector | ISIN |
| abrdn High Yield Bond | 9 | Low | Sterling High Yield | GB00B79RR984 |
| AXA Framlington UK Equity Income | 5 | Medium | UK Equity Income | GB00B7KBNV36 |
| BNY Mellon Global Income | 6.5 | Medium | Global Equity Income | GB00B7XK5M25 |
| Cash | 7 | Low | ||
| CT European Select | 8.5 | High | Europe Excluding UK | GB00B8BC5H23 |
| Invesco Asian Equity Income (UK) | 5 | High | Asia Pacific Excluding Japan | GB00B4JR4R48 |
| Invesco Global Bond (UK) | 9 | Low | Global Bonds | GB00B3RW7B97 |
| iShares Physical Gold ETC | 5 | Medium | Commodity & Energy ETF | IE00B4ND3602 |
| Jupiter Global Value Equity | 10.5 | Medium | Global | GB00BF5DRF26 |
| Jupiter Merlin Balanced Portfolio | 12.5 | Medium | Mixed Investment 40-85% Shares | GB0031845141 |
| M&G Global Dividend | 7 | Medium | Global Equity Income | GB00B46J9127 |
| TB Saracen Global Income & Growth | 9.5 | Medium | Global Equity Income | GB00B5B35X02 |
| Thesis TM Tellworth UK Select | 5.5 | Low | Targeted Absolute Return | GB00BNY7YM73 |
My Portfolio asset mix
My portfolio asset mix has around 60% exposure to equities. Last month's figures are shown in brackets.
-
- UK Equities 19% (18%)
- North American Equities 13% (11%)
- Asian/Emerging Market Equities 5% (5%)
- Japanese Equities 0% (0%)
- European Equities 19% (13%)
- Chinese equities 0% (0%)
- Other equity 4% (13%)
- Commodities and energy 5% (8%)
- UK Fixed Interest 0% (0%)
- Global Fixed Interest 17% (17%)
- Cash 7% (7%)
- Alternative Investment Strategies 11% (8%)
- Property 0% (0%)
Damien's higher risk and lower risk portfolios
Using the logic described in my post: Update to Damien’s alternative risk portfolios I created hypothetical higher and lower risk versions of my portfolio below:
Lower risk
| Fund | Allocation % |
| abrdn High Yield Bond | 10 |
| AXA Framlington UK Equity Income | 6 |
| BNY Mellon Global Income | 8 |
| Cash | 9 |
| Invesco Global Bond (UK) | 10 |
| iShares Physical Gold ETC | 6 |
| Jupiter Global Value Equity | 12 |
| Jupiter Merlin Balanced Portfolio | 14 |
| M&G Global Dividend | 8 |
| TB Saracen Global Income & Growth | 11 |
| Thesis TM Tellworth UK Select | 7 |
Higher risk
| Fund | Allocation % |
| AXA Framlington UK Equity Income | 8 |
| BNY Mellon Global Income | 9 |
| CT European Select | 12 |
| Invesco Asian Equity Income (UK) | 7 |
| iShares Physical Gold ETC | 7 |
| Jupiter Global Value Equity | 15 |
| Jupiter Merlin Balanced Portfolio | 18 |
| M&G Global Dividend | 10 |
| TB Saracen Global Income & Growth | 14 |

£200 Pension Cashback Offer
Make a qualifying deposit or transfer a pension to our partner Interactive Investor.
- Deposit or transfer a pension of at least £20k and you could earn £200 cashback
- Terms and Fees apply, Capital at risk
- New & Existing customers opening a SIPP
- Offer ends 31st July 2026
Before starting your transfer, check you won't lose any valuable benefits (such as guaranteed annuity rates or a lower protected pension age) and find out what exit fees you might have to pay
