

The background to my portfolio
Back in March 2015 I decided to invest £50,000 of my own money using 80-20 Investor. The purpose was twofold, firstly to show how you can use 80-20 Investor to invest and outperform the market with only a few minutes effort every now and then. Secondly, no other investment commentator, journalist or research provider invests their own money for fear of failing. This is a sorry state of affairs and is precisely why I committed to openly running my own portfolio for 80-20 Investor members to see.
Since then I have periodically changed my portfolio using the fund suggestions provided by the 80-20 Investor algorithm and associated research. I always disclose the changes at the time they are made.
Performance update
As is usual in my portfolio reviews, the chart below shows how my portfolio has outperformed since I started the challenge in March 2015, which is over six years ago. The green line is the performance of my portfolio while the red line is the benchmark showing the average return achieved by professional fund managers given the same asset mix. To accurately calculate this I have used the average return for each sector in which my portfolio invested. The blue line shows what the average multi-asset fund with comparable equity content achieved. In other words, the red line would show the extra performance added by just the asset mix of my portfolio (where I was invested i.e European equities etc) over picking a typical multi-asset fund (the blue line). While the green line (which is my actual performance) shows the impact of being in the right funds at the right time, as identified by the 80-20 Investor algorithm.
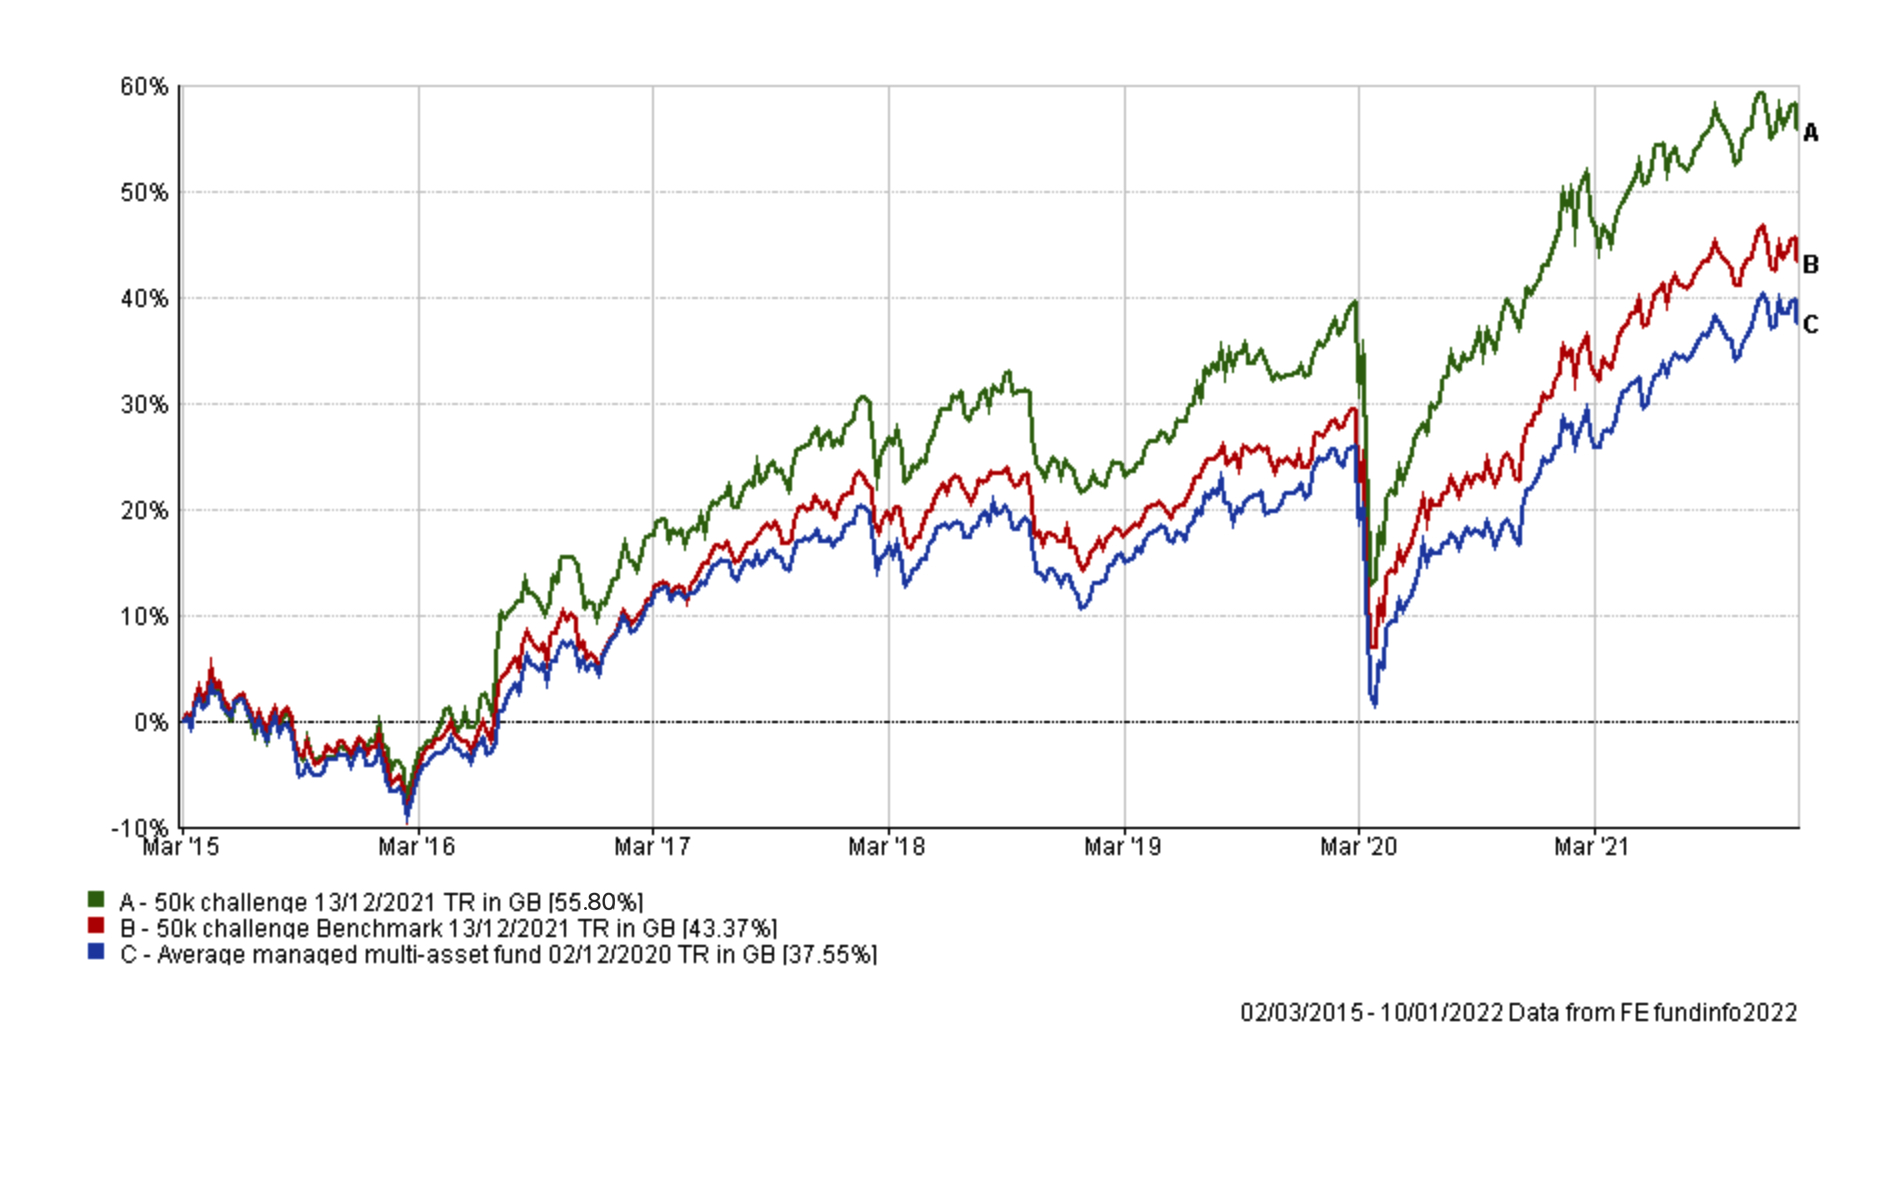
As you can see, my £50k portfolio still sits just below its all-time high, and the chart below shows how my portfolio performed versus its benchmarks during the last month (and since my last review). In the end it performed broadly in line with both benchmarks.
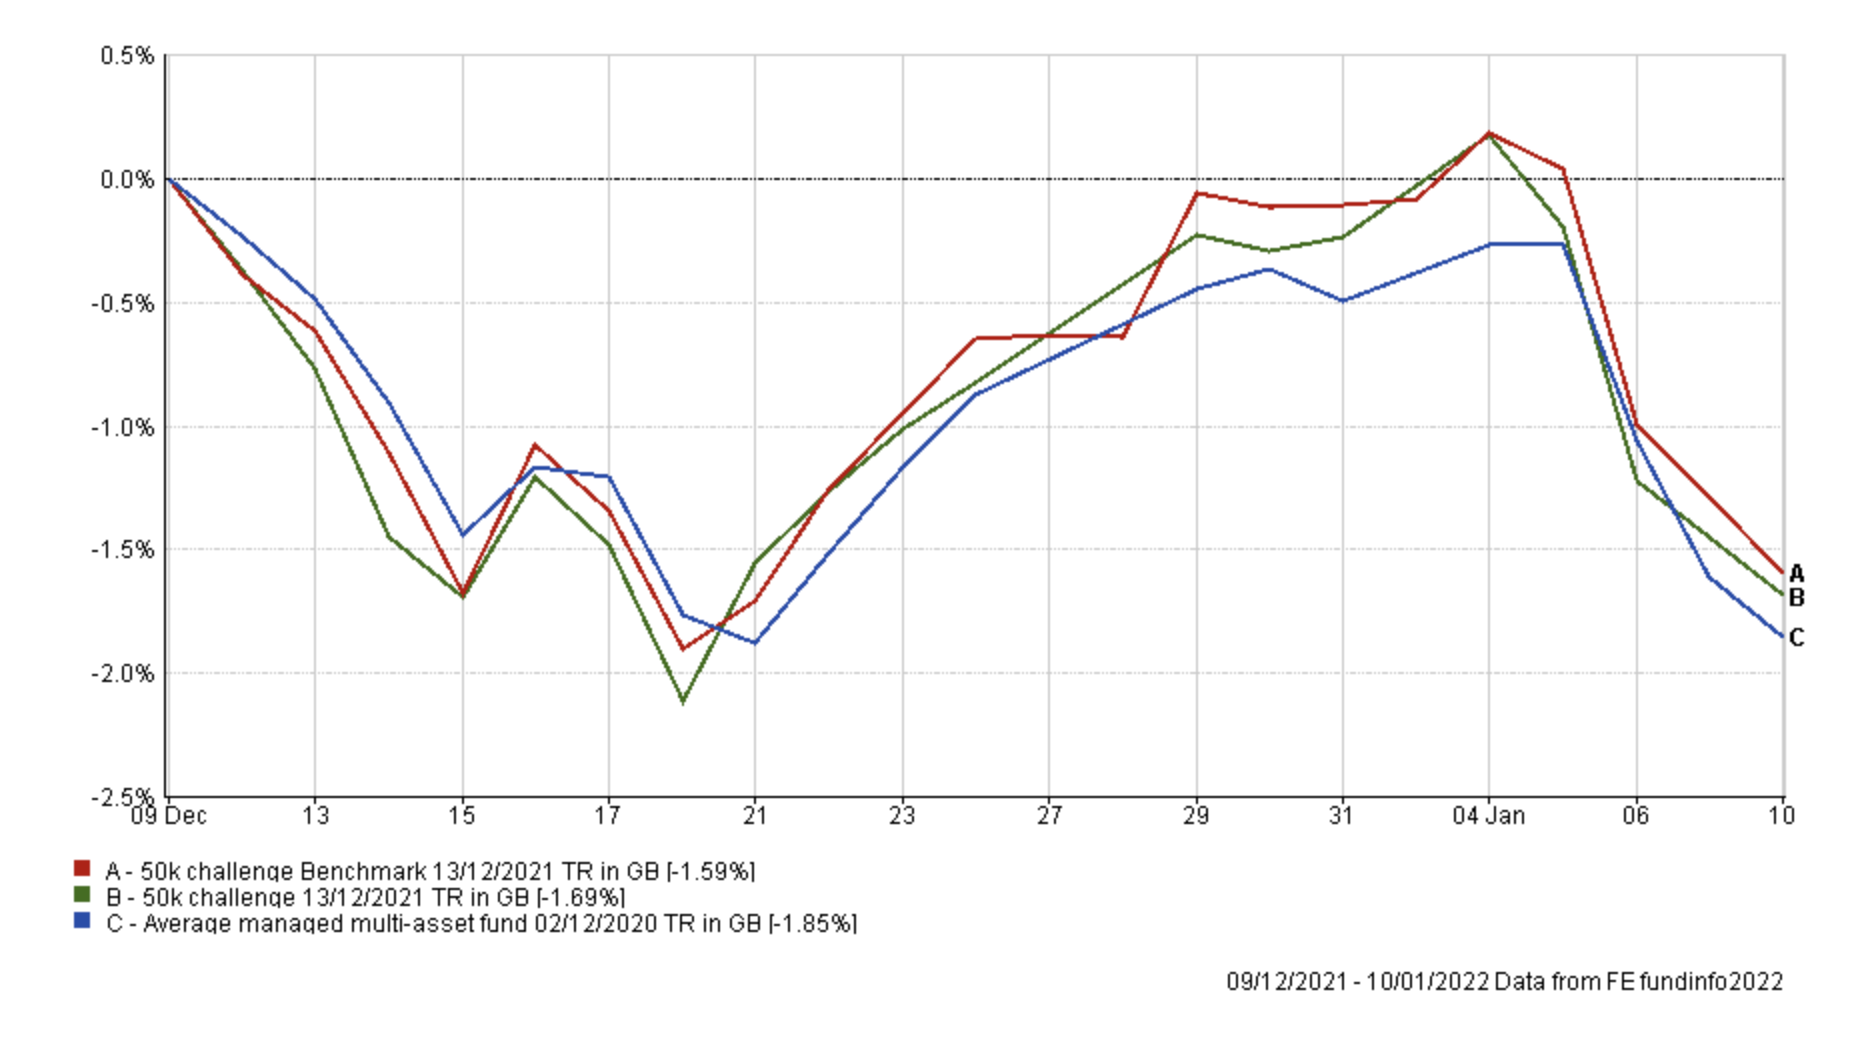
As I wrote in January's monthly newsletter, December was an incredibly volatile month as markets wrestled with rising Omicron cases and the future path of central bank monetary policy, particularly in the US. Eventually, the Santa rally came to the rescue in the days before Christmas, as can be seen in the chart above. However, markets started 2022 on a negative note, as investors aggressively rotated into reflation assets as they bet on higher interest rates, tighter monetary policy and the reflation trade.
The table below shows the performance of the funds within my portfolio since my last review in December. As concerns around Omicron started to dissipate we saw a rally in commodities and domestically focused smaller companies stocks. Also, don't forget we are entering a seasonally strong period for UK smaller companies funds. One factor that my portfolio did benefit from was a lack of bond fund exposure as yields exploded higher in the new year, meaning that bond funds dropped in value. Looking at the worst-performing funds, the performance of the two North American equity funds (Fidelity Index US & SVS Sanlam North American Equity) is a reflection of the weakness we've seen in US equities so far in 2022. However, Fidelity Emerging Europe Middle East and Africa again props up the performance table, as it did in the lead up to my last review.
| Fund | % return over 1 month since the last review |
| BlackRock Natural Resources Growth & Income | 3.03 |
| Fidelity UK Smaller Companies | 2.03 |
| Wise Funds Limited TB Wise Multi-Asset Growth | 0.96 |
| SVS SVS Brooks Macdonald Defensive Capital | 0.19 |
| Invesco High Yield (UK) | 0.19 |
| iShares Physical Gold ETC | -1.63 |
| Premier Miton Diversified Growth | -1.85 |
| IFSL Marlborough European Special Situations | -2.53 |
| Fidelity Index US | -3.33 |
| Fidelity Global Property | -3.94 |
| SVS Sanlam North American Equity | -5.54 |
| Fidelity Emerging Europe Middle East and Africa | -6.62 |
As usual, the table below shows which funds within my current portfolio are in the current BOTB or BFBS tables and which are not. Those funds in green are still in the BOTB while those in orange are not in the BOTB but remain in the BFBS list. Meanwhile, any funds in red have dropped out of both shortlists.
| Name | Allocation % (rounded) | Risk | Sector | ISIN Code |
| BlackRock Natural Resources Growth & Income | 5 | High | Commodity/Natural Resource | GB00B6865B79 |
| BM Brooks Macdonald Defensive Capital | 14.5 | Low | Targeted Absolute Return | GB00B61MR835 |
| Fidelity Emerging Europe Middle East and Africa | 9 | High | Specialist | GB00B87Z7808 |
| Fidelity Global Property | 5 | Medium | Property Other | GB00B7K2NZ09 |
| Fidelity UK Smaller Companies | 10 | High | UK Smaller Companies | GB00B7VNMB18 |
| Fidelity US Index | 8.5 | Medium | North America | GB00BJS8SH10 |
| Invesco High Yield (UK) | 7.5 | Low | Sterling High Yield | GB00B3RW7649 |
| iShares Physical Gold ETC | 4 | Medium | Commodity & Energy ETF | IE00B4ND3602 |
| Marlborough European Multi-Cap | 10 | High | Europe Excluding UK | GB0001719730 |
| Premier Miton Diversified Growth | 7 | Medium | Mixed Investment 40-85% Shares | GB00B8BJV423 |
| SVS Sanlam North American Equity | 11 | Medium | North America | GB0007655698 |
| Wise Multi-Asset Growth | 8.5 | Medium | Flexible Investment | GB0034272533 |
The first thing to point out is that the following three funds once again remain outside of the BOTB and BFBS and are highlighted in red:
- Premier Diversified Growth
- Wise Multi-Asset Growth
- Marlborough European Multi-Cap (now called - IFSL Marlborough European Special Situations)
These have now been joined by Fidelity Emerging Europe Middle East and Africa. Interestingly, last time I wrote that I would be keeping an eye on Fidelity Emerging Europe Middle East and Africa going forward, as it had been adversely affected by market uncertainties.
The chart below shows the performance of the Fidelity Emerging Europe Middle East and Africa (EEMEA) fund since I've held it in my portfolio. It performed wonderfully until November when it gave up all its gains, as the dollar rallied and commodities slumped as fears over Omicron spread, which in turn hit Russian equities. The fund's biggest geographical exposures are to Russian and South African equities, which explains its poor performance of late. In addition, the geopolitical tensions in eastern Europe haven't helped Russian equities either.
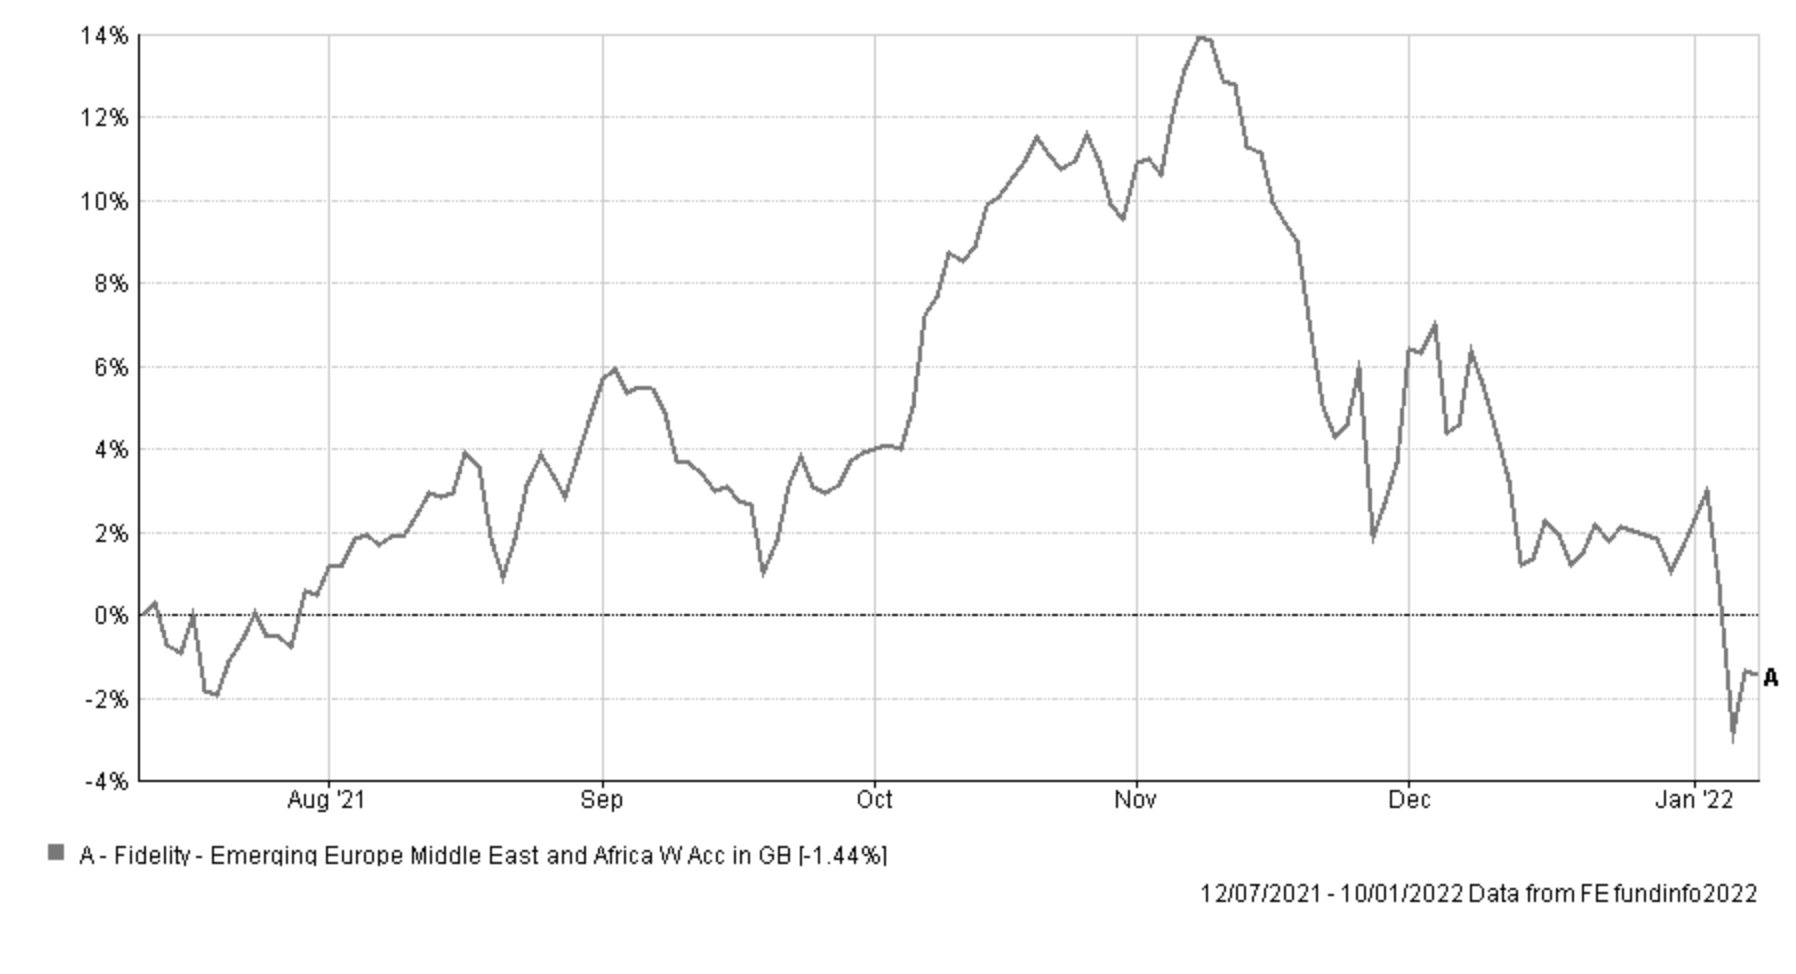
Given the performance over recent months, it's time to remove the fund from my portfolio, as its momentum has clearly stalled. That's not to say that it can't bounce from here but there are likely better investment opportunities elsewhere.
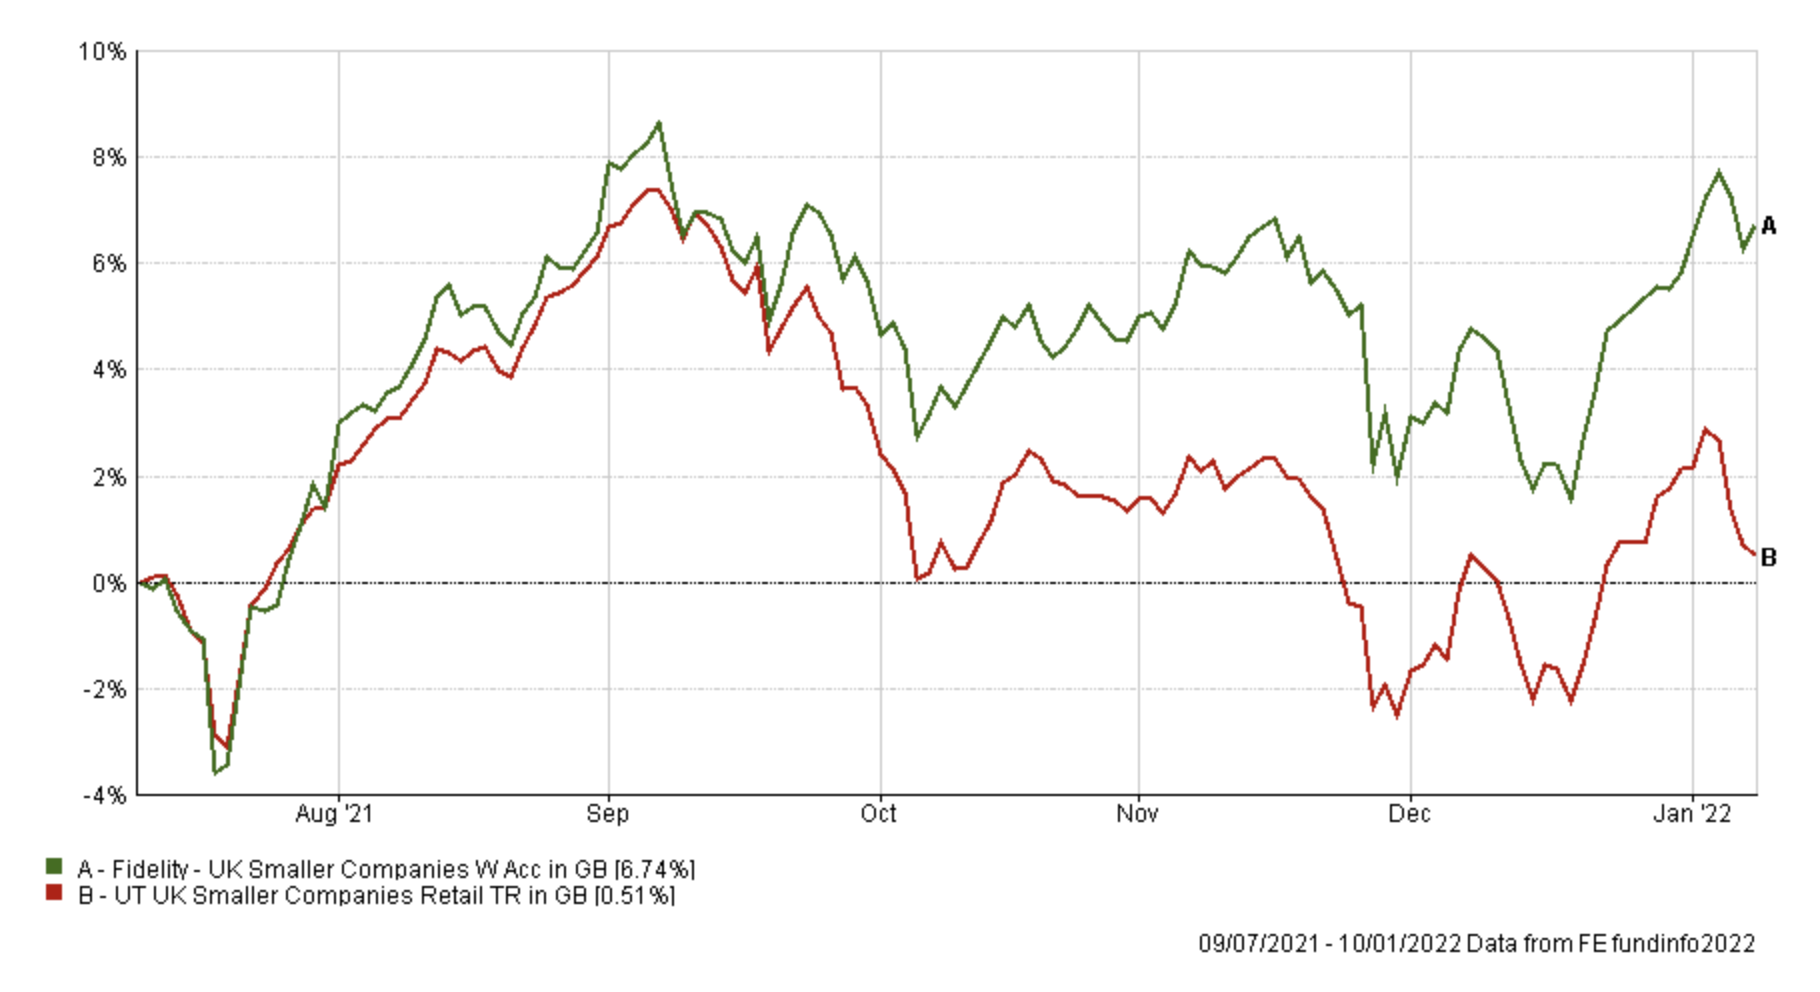
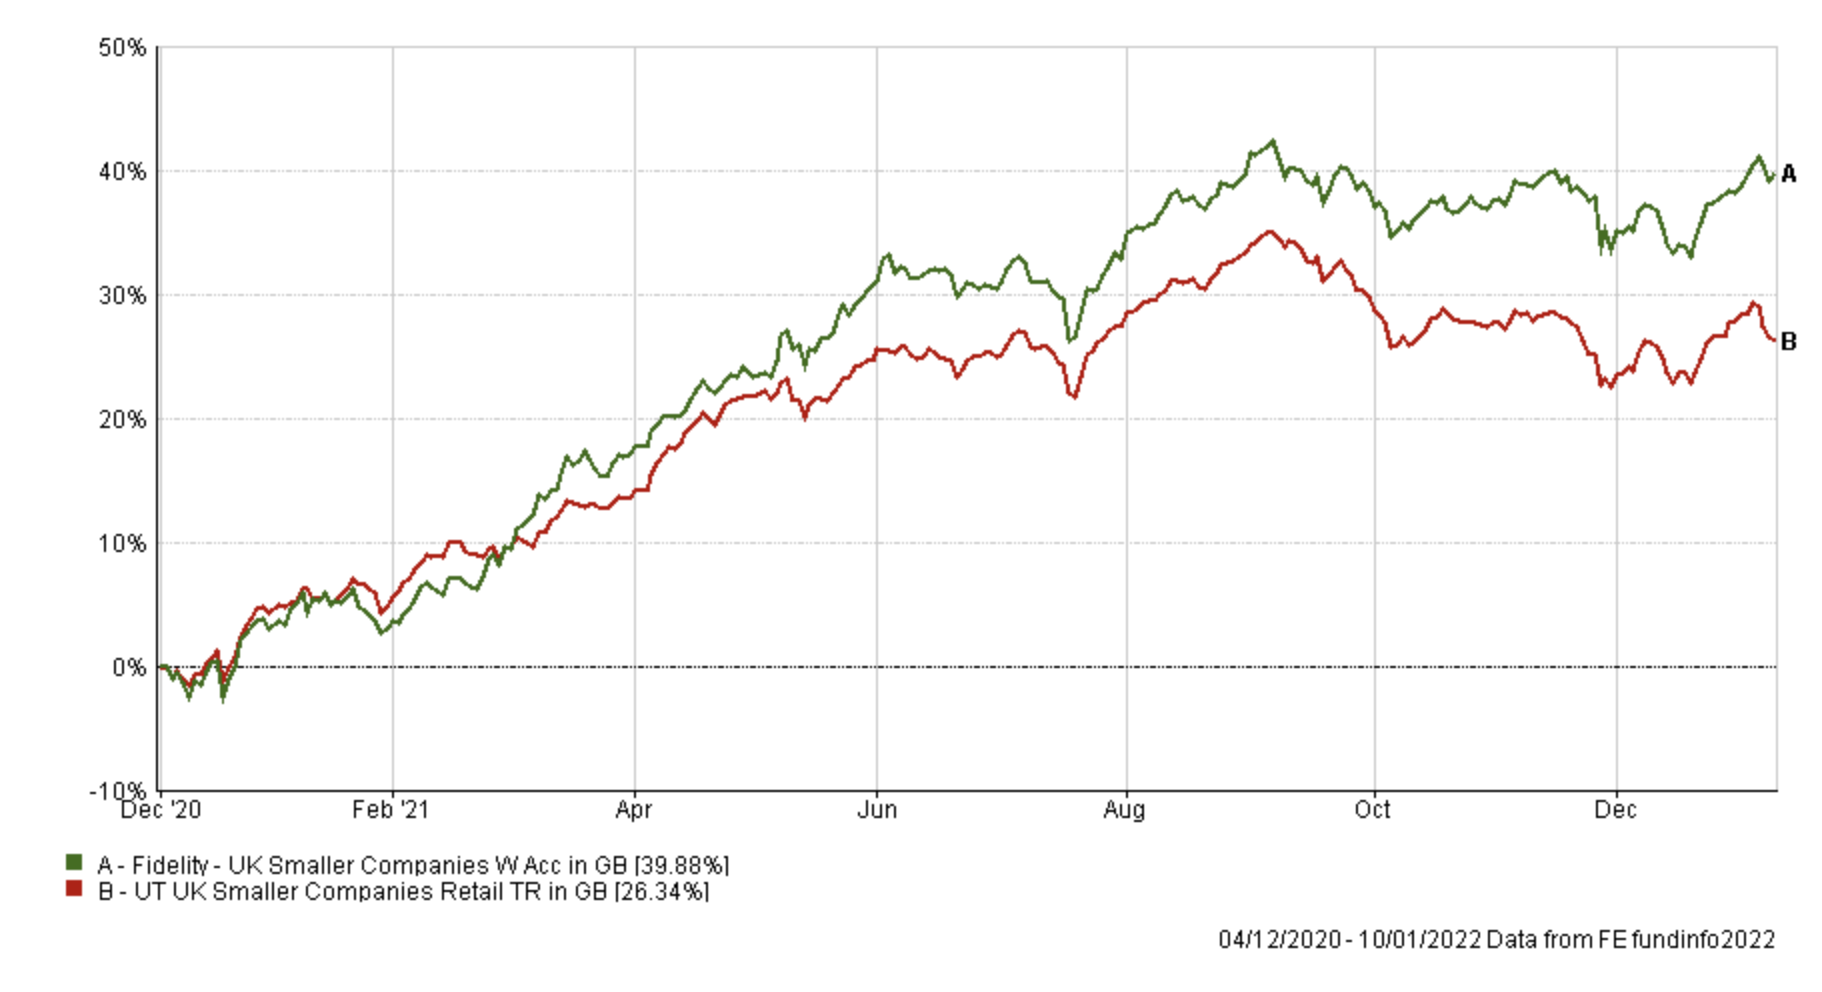
Fidelity UK Smaller Companies was also on my watchlist last month, but it has since proved much more resilient than its peer group. The charts below show the strong performance of the fund over the last 6 months and since I first included it in my portfolio back in December 2020. The charts also include the performance of the fund's peer group average. The fund also remains in the BFBS tables and seems to be enjoying the historically strong winter-period for the sector and the fund itself (see my Winter Portfolio update 2021). So for now I will maintain my holding in the fund.
The chart below shows the performance of the fund since it's been in my portfolio.
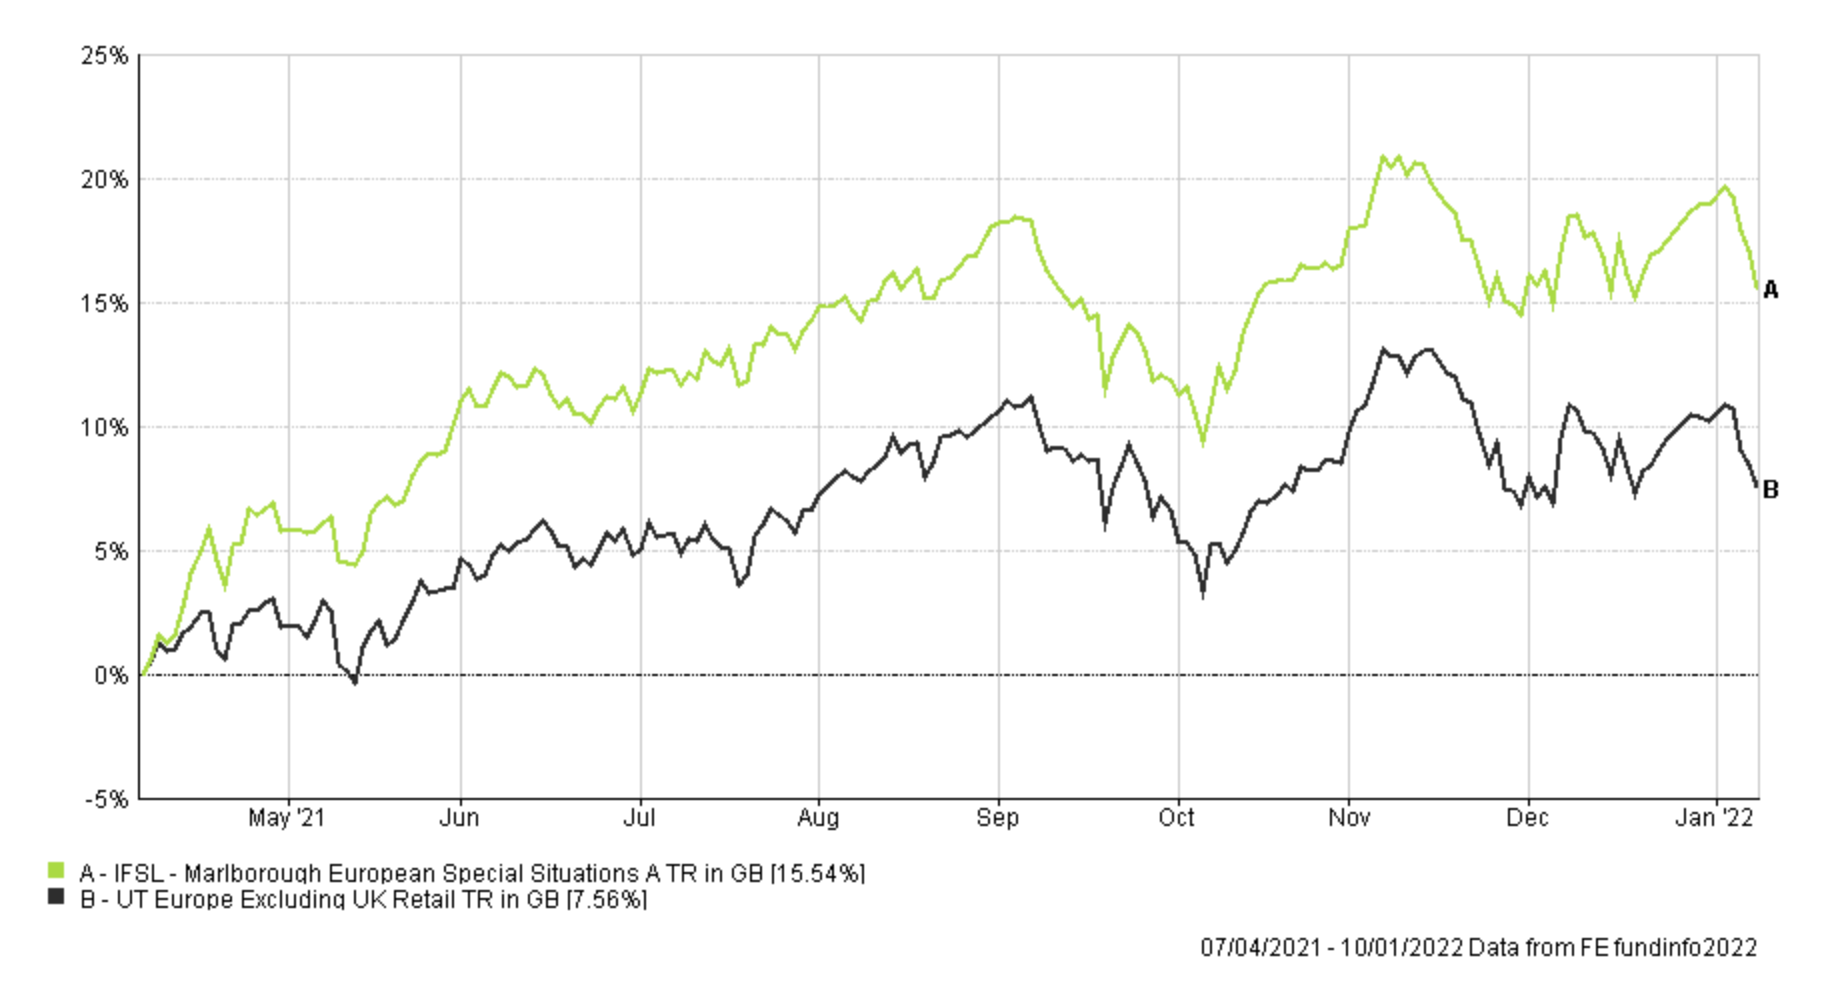
Last month IFSL Marlborough European Special Situations (formerly named Marlborough European Multi-Cap) lost momentum and fell out of the BOTB and BFBS tables. The charts below show the performance of the fund since I have held it along with the performance over the last few months. You can see that it has been a standout performer over the longer term In fact, only two funds out of the 81 in the European equity sector have outperformed the Marlborough fund.
You can see even over the short term, despite a loss of momentum it is still (just) outperforming the average of its peer group.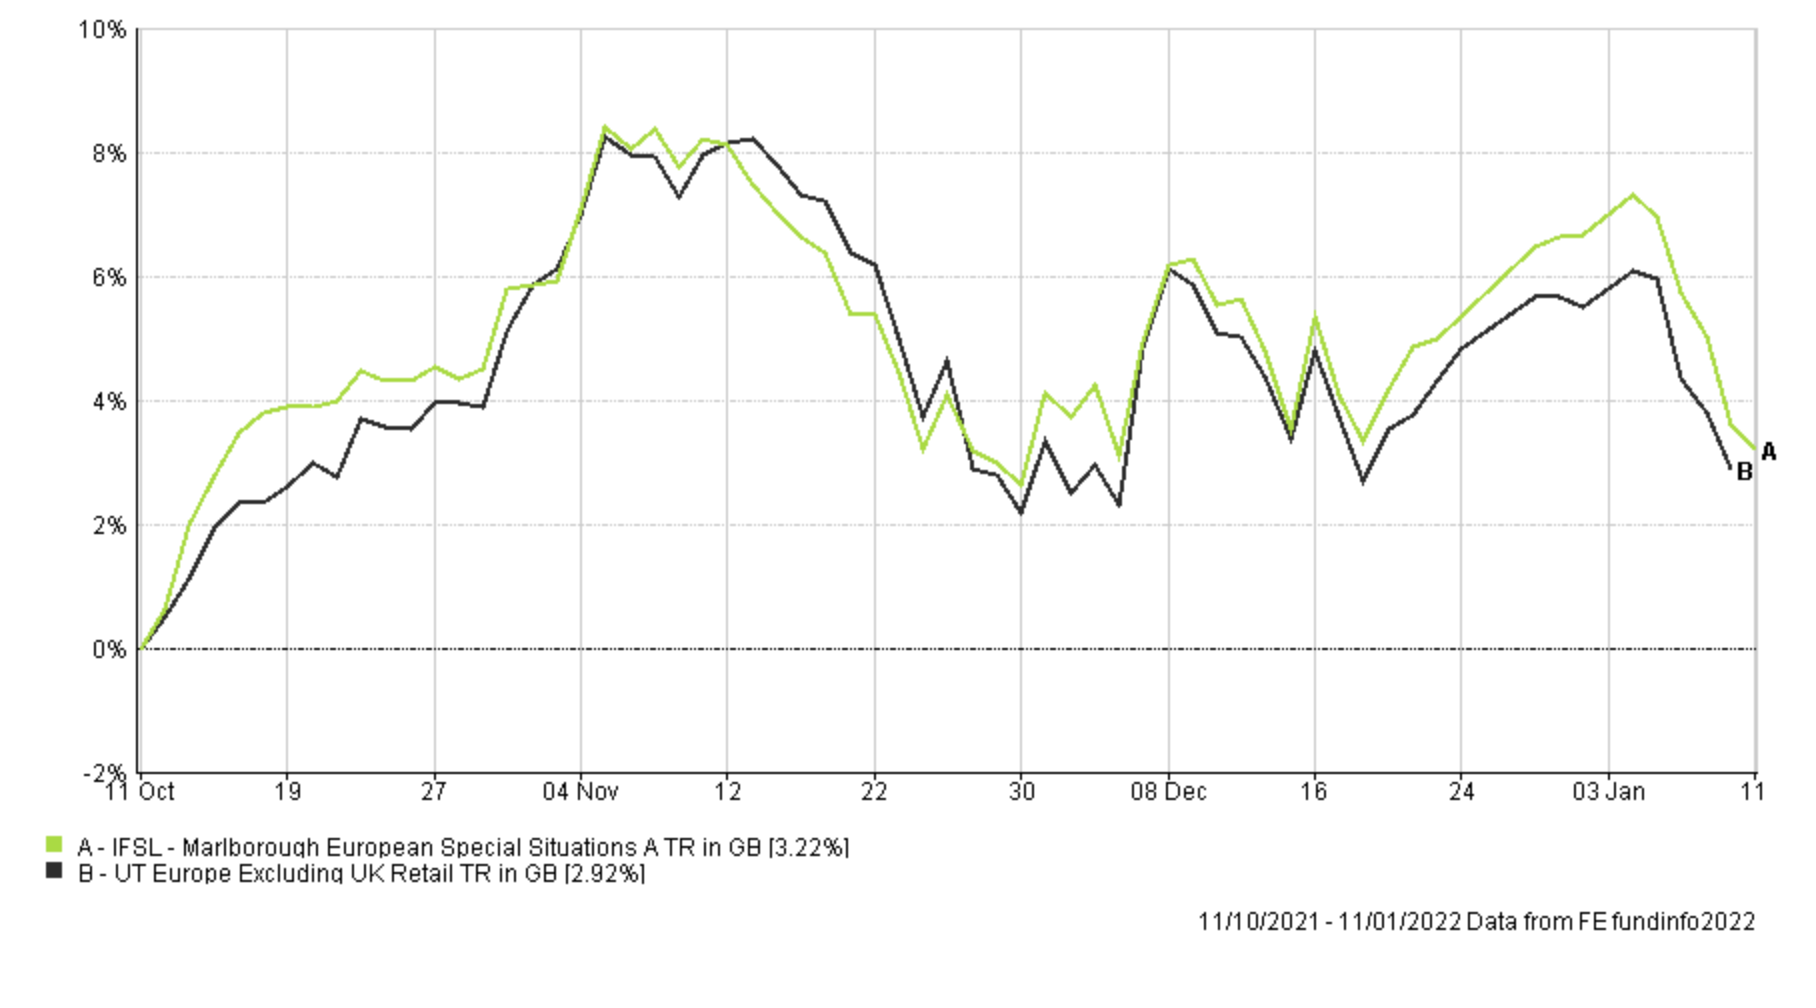
For now, I will keep the fund on my watchlist, as it does feel premature to throw it out of the portfolio, especially as it sits only just outside of the BFBS list and given the volatility we are experiencing in markets I am aiming to keep fund changes to a minimum while maintaining exposure to European equities.
Turning my attention to the other funds that have fallen outside of the BOTB, Wise Multi-Asset Growth continues to outperform as bond yields rise. The chart shows how it has performed in recent months compared to the typical multi-asset funds with varying equity exposure.
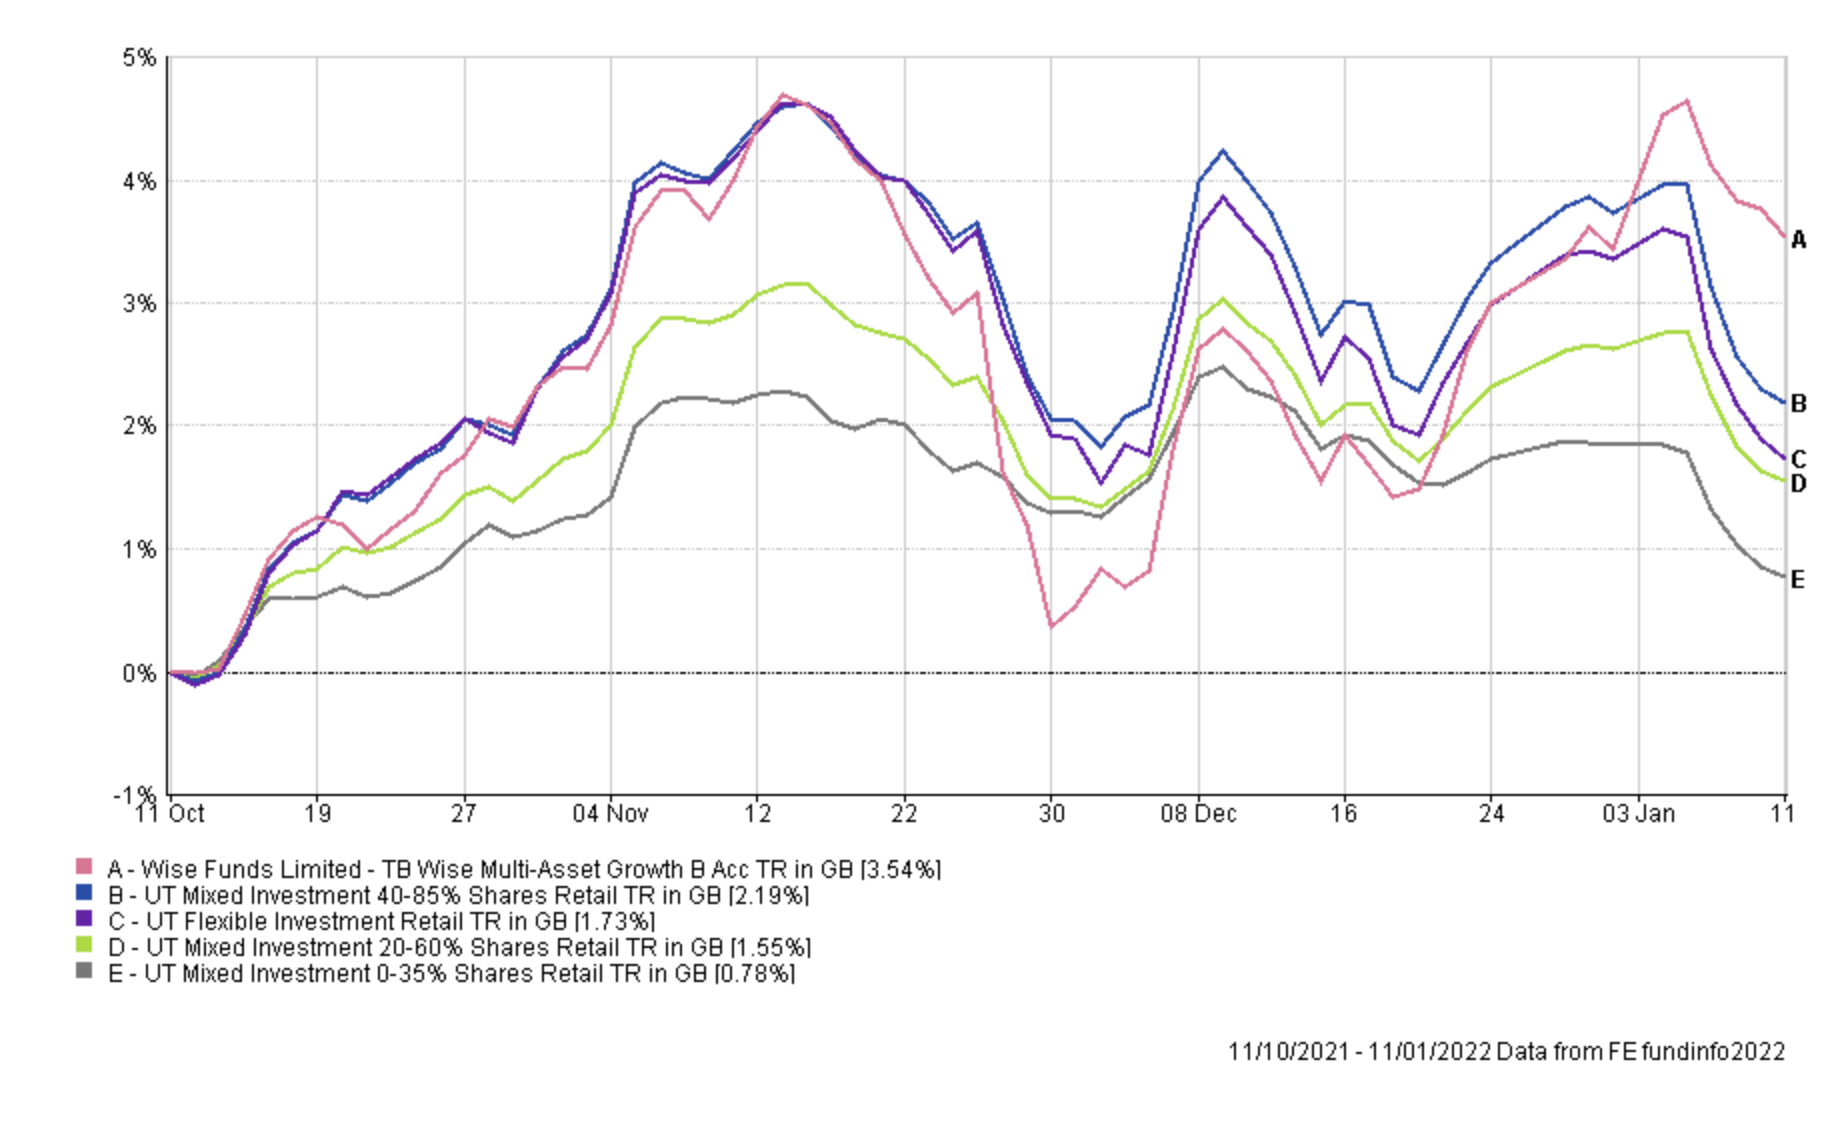
Also in this year's aggressive rotation into reflation assets it is one of the top-performing multi-asset funds across all sectors, even making a profit so far in 2022.
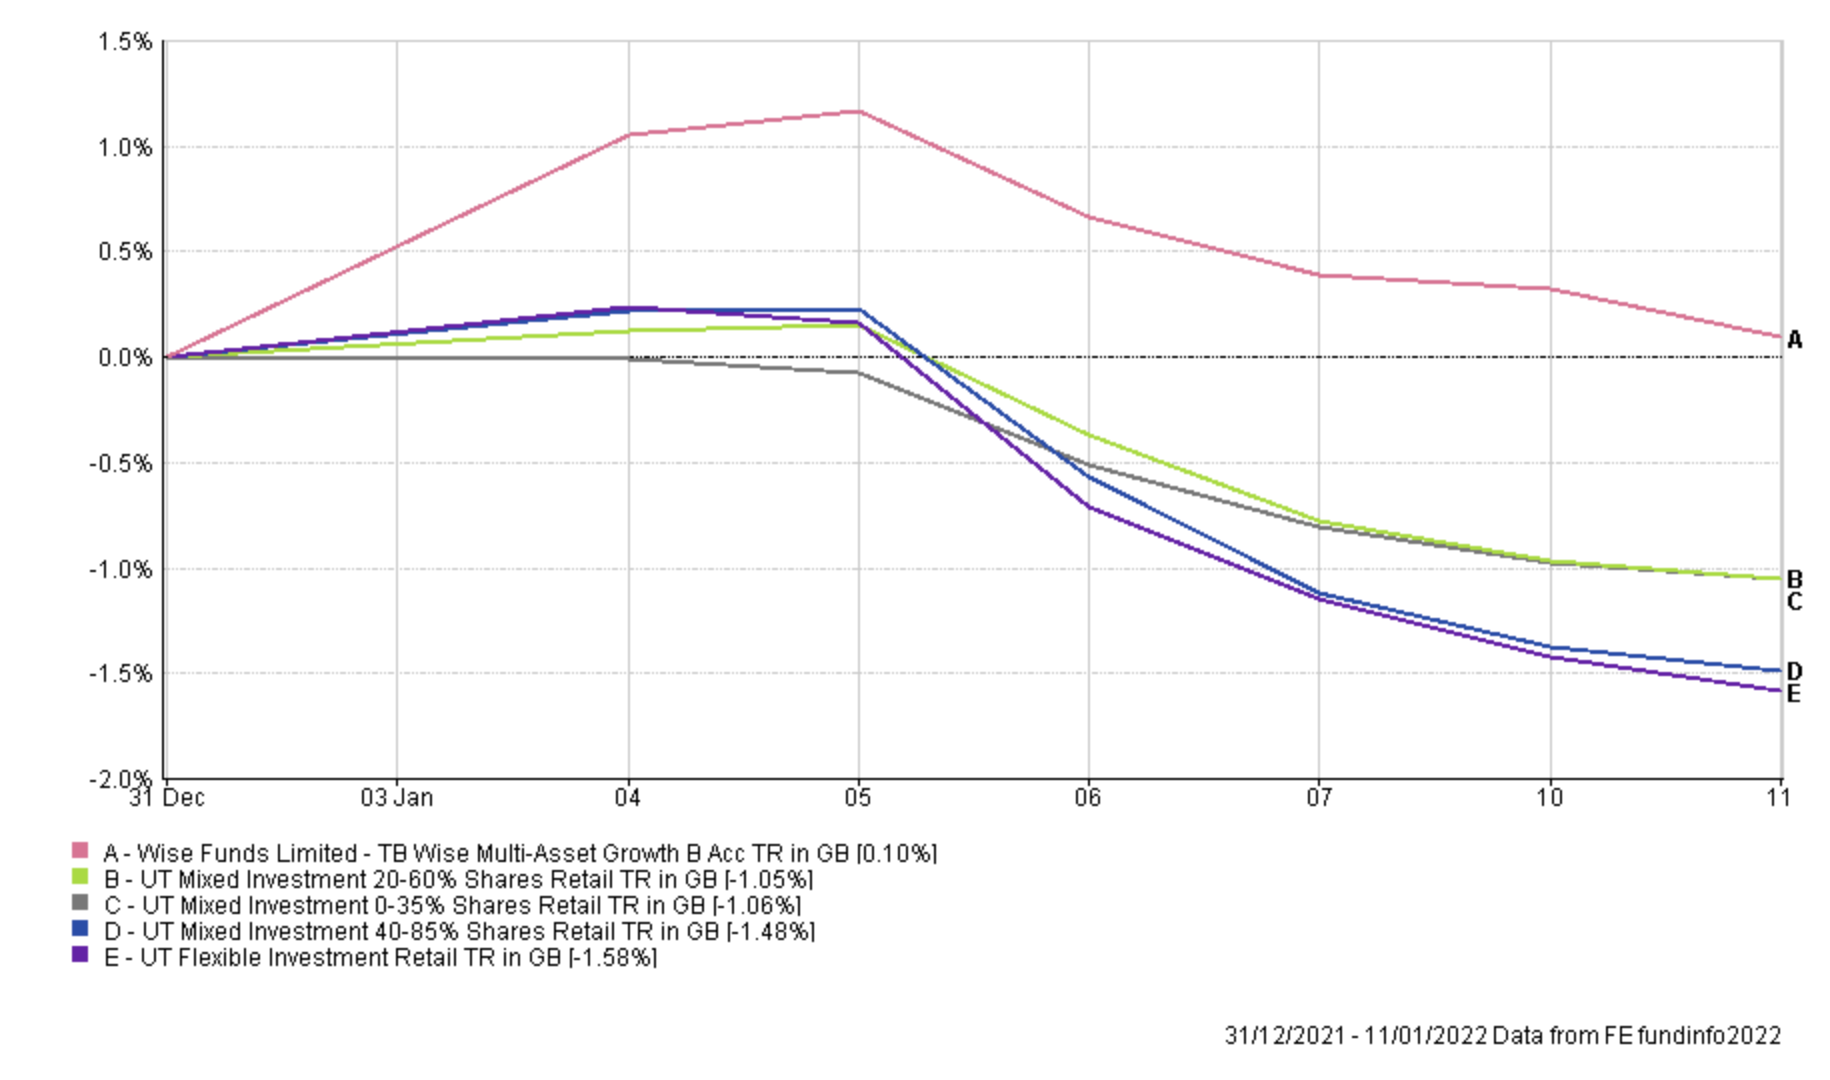
But this should not be surprising as it was highlighted as one of the funds for the reflation trade in my research piece in early 2021. So I think it is prudent to maintain exposure to the fund for now.
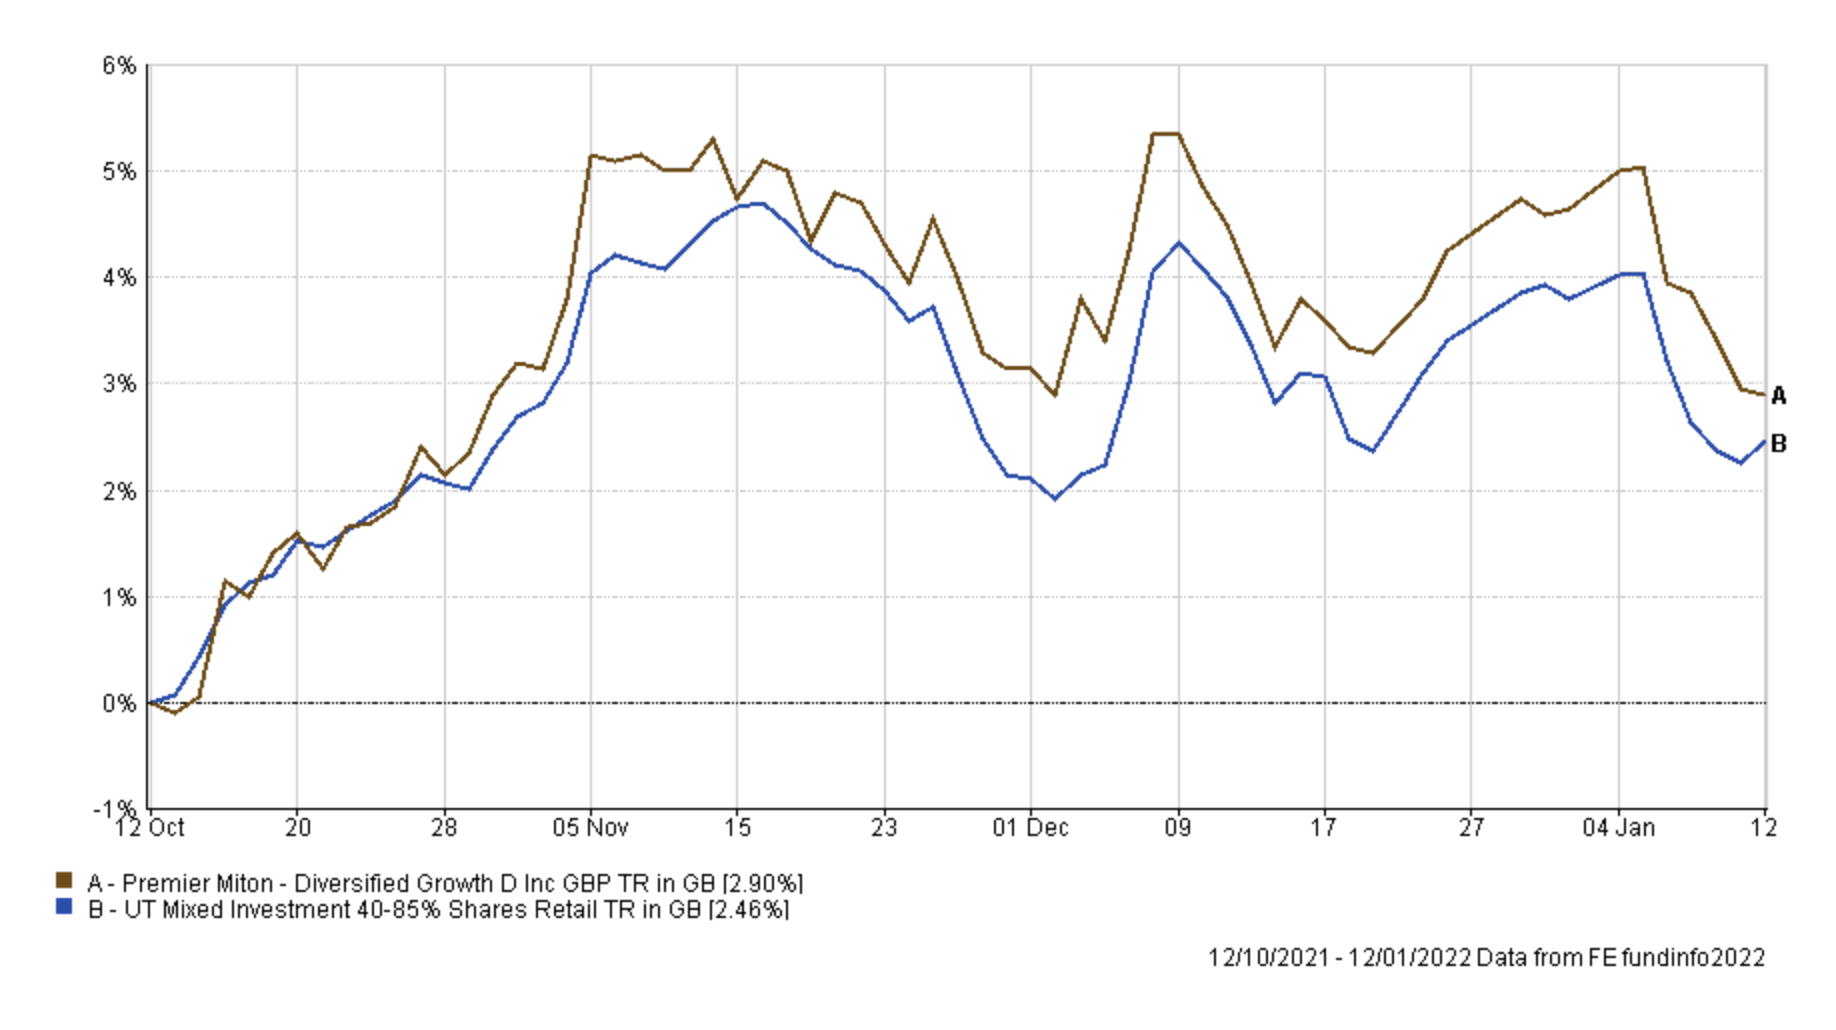
In recent months I have been slowly reducing my exposure to the Premier Diversified Growth fund as it tends to lag in a rising bond yield environment, and I will continue to reduce its allocation this month. Having said that, it is still performing in line with its peer group average (see below), so its performance is far from bad plus it was highlighted as a potential Covid core fund (along with the Wise fund) in my recent research article. If the threat from Covid continues to reduce then it makes sense to continue to drip out of the Premier fund.
Finally, I am looking to diversify my US equity exposure. The SVS Sanlam North American Equity has struggled as bond yields burst higher. Plus it triggered a stop loss alert on 12th January. While I don't tend to make knee-jerk changes to my portfolio in response to these alerts I took it as a sign to diversify my US exposure even more away from a reliance on tech stocks into a fund that has greater exposure to financials
The other funds within my portfolio are either still in the BOTB or BFBS tables. Again, given the performance of the portfolio and the volatility of markets, there is no need for any drastic changes right now.
Fund switches
The fund switches below bring my portfolio in line with the BOTB, in terms of UK and US equity exposure. The fund switches move money into the Fidelity US Index and Invesco UK Opportunities, both of which are in January's BOTB. But I have also selected Fidelity American Special Situations from the BFBS, as it is a fund that was identified in my previous research into funds that might benefit from a higher interest rate environment. The fund switches I have made this time are:
- 100% out of Fidelity Emerging Europe Middle East and Africa and 50% into Fidelity American Special Situations and 50% into Invesco UK Opportunities
- 33% out of Premier Miton Diversified Growth and 100% into Fidelity US Index
- 33% out of SVS Sanlam North American Equity and 100% into Fidelity American Special Situations
Overall it means that the equity exposure within my portfolio has marginally increased to around 68%, while the number of holdings has increased by one. The changes affect just over 14% of my portfolio.
My portfolio
My portfolio now looks like this:
| Name | Allocation % (rounded) | Risk | Sector | ISIN Code |
| BlackRock Natural Resources Growth & Income | 5 | High | Commodity/Natural Resource | GB00B6865B79 |
| BM Brooks Macdonald Defensive Capital | 15 | Low | Targeted Absolute Return |
GB00B61MR835
|
| Fidelity American Special Situations | 7.5 | Medium | North America | GB00B89ST706 |
| Fidelity Global Property | 5 | Medium | Property Other |
GB00B7K2NZ09
|
| Fidelity UK Smaller Companies | 10 | High | UK Smaller Companies |
GB00B7VNMB18
|
| Fidelity US Index | 11 | Medium | North America |
GB00BJS8SH10
|
| Invesco High Yield (UK) | 7.5 | Low | Sterling High Yield |
GB00B3RW7649
|
| Invesco UK Opportunities (UK) | 4 | Medium | UK All Companies |
GB00B1W7HM62
|
| iShares Physical Gold ETC | 4 | Medium | Commodity & Energy ETF | IE00B4ND3602 |
| IFSL Marlborough European Special Situations | 10 | High | Europe Excluding UK | GB0001719730 |
| Premier Miton Diversified Growth | 5 | Medium | Mixed Investment 40-85% Shares | GB00B8BJV423 |
| SVS Sanlam North American Equity | 7.5 | Medium | North America | GB0007655698 |
| Wise Multi-Asset Growth | 8.5 | Medium | Flexible Investment | GB0034272533 |
My Portfolio asset mix
My portfolio asset mix is now as shown below which remains around 67% exposure to equities. Last month's figures are shown in brackets
-
- UK Equities 13% (10%)
- North American Equities 27% (22%)
- Asian/Emerging Market Equities 2% (8%)
- Japanese Equities 0% (0%)
- European Equities 9% (9%)
- Chinese equities 0% (0%)
- Other equity 5% (7%)
- Commodities and energy 11% (11%)
- UK Fixed Interest 0% (0%)
- Global Fixed Interest 10% (12%)
- Cash 5% (4%)
- Alternative Investment Strategies 12% (11%)
- Property 6% (6%)
Damien's higher risk and lower risk portfolios
Using the logic described in my post: Update to Damien’s alternative risk portfolios I created hypothetical higher and lower risk versions of my portfolio below:
Lower risk
| Fund | Allocation % |
| BM Brooks Macdonald Defensive Capital | 20 |
| Fidelity American Special Situations | 10 |
| Fidelity Global Property | 7 |
| Fidelity US Index | 15 |
| Invesco High Yield (UK) | 10 |
| Invesco UK Opportunities (UK) | 5 |
| iShares Physical Gold ETC | 5 |
| Premier Miton Diversified Growth | 7 |
| SVS Sanlam North American Equity | 10 |
| Wise Multi-Asset Growth | 11 |
Higher risk
| Fund | Allocation % |
| BlackRock Natural Resources Growth & Income | 7 |
| Fidelity American Special Situations | 10 |
| Fidelity Global Property | 6 |
| Fidelity UK Smaller Companies | 13 |
| Fidelity US Index | 14 |
| Invesco UK Opportunities (UK) | 5 |
| iShares Physical Gold ETC | 5 |
| IFSL Marlborough European Special Situations | 13 |
| Premier Miton Diversified Growth | 6 |
| SVS Sanlam North American Equity | 10 |
| Wise Multi-Asset Growth | 11 |

£200 Pension Cashback Offer
Make a qualifying deposit or transfer a pension to our partner Interactive Investor.
- Deposit or transfer a pension of at least £20k and you could earn £200 cashback
- Terms and Fees apply, Capital at risk
- New & Existing customers opening a SIPP
- Offer ends 31st July 2026
Before starting your transfer, check you won't lose any valuable benefits (such as guaranteed annuity rates or a lower protected pension age) and find out what exit fees you might have to pay
