

The background to my portfolio
Back in March 2015 I decided to invest £50,000 of my own money using 80-20 Investor. The purpose was twofold, firstly to show how you can use 80-20 Investor to invest and outperform the market with only a few minutes effort every now and then. Secondly, no other investment commentator, journalist or research provider invests their own money for fear of failing. This is a sorry state of affairs and is precisely why I committed to openly running my own portfolio for 80-20 Investor members to see.
Since then I have periodically changed my portfolio using the fund suggestions provided by the 80-20 Investor algorithm and associated research. I always disclose the changes at the time they are made.
Performance update
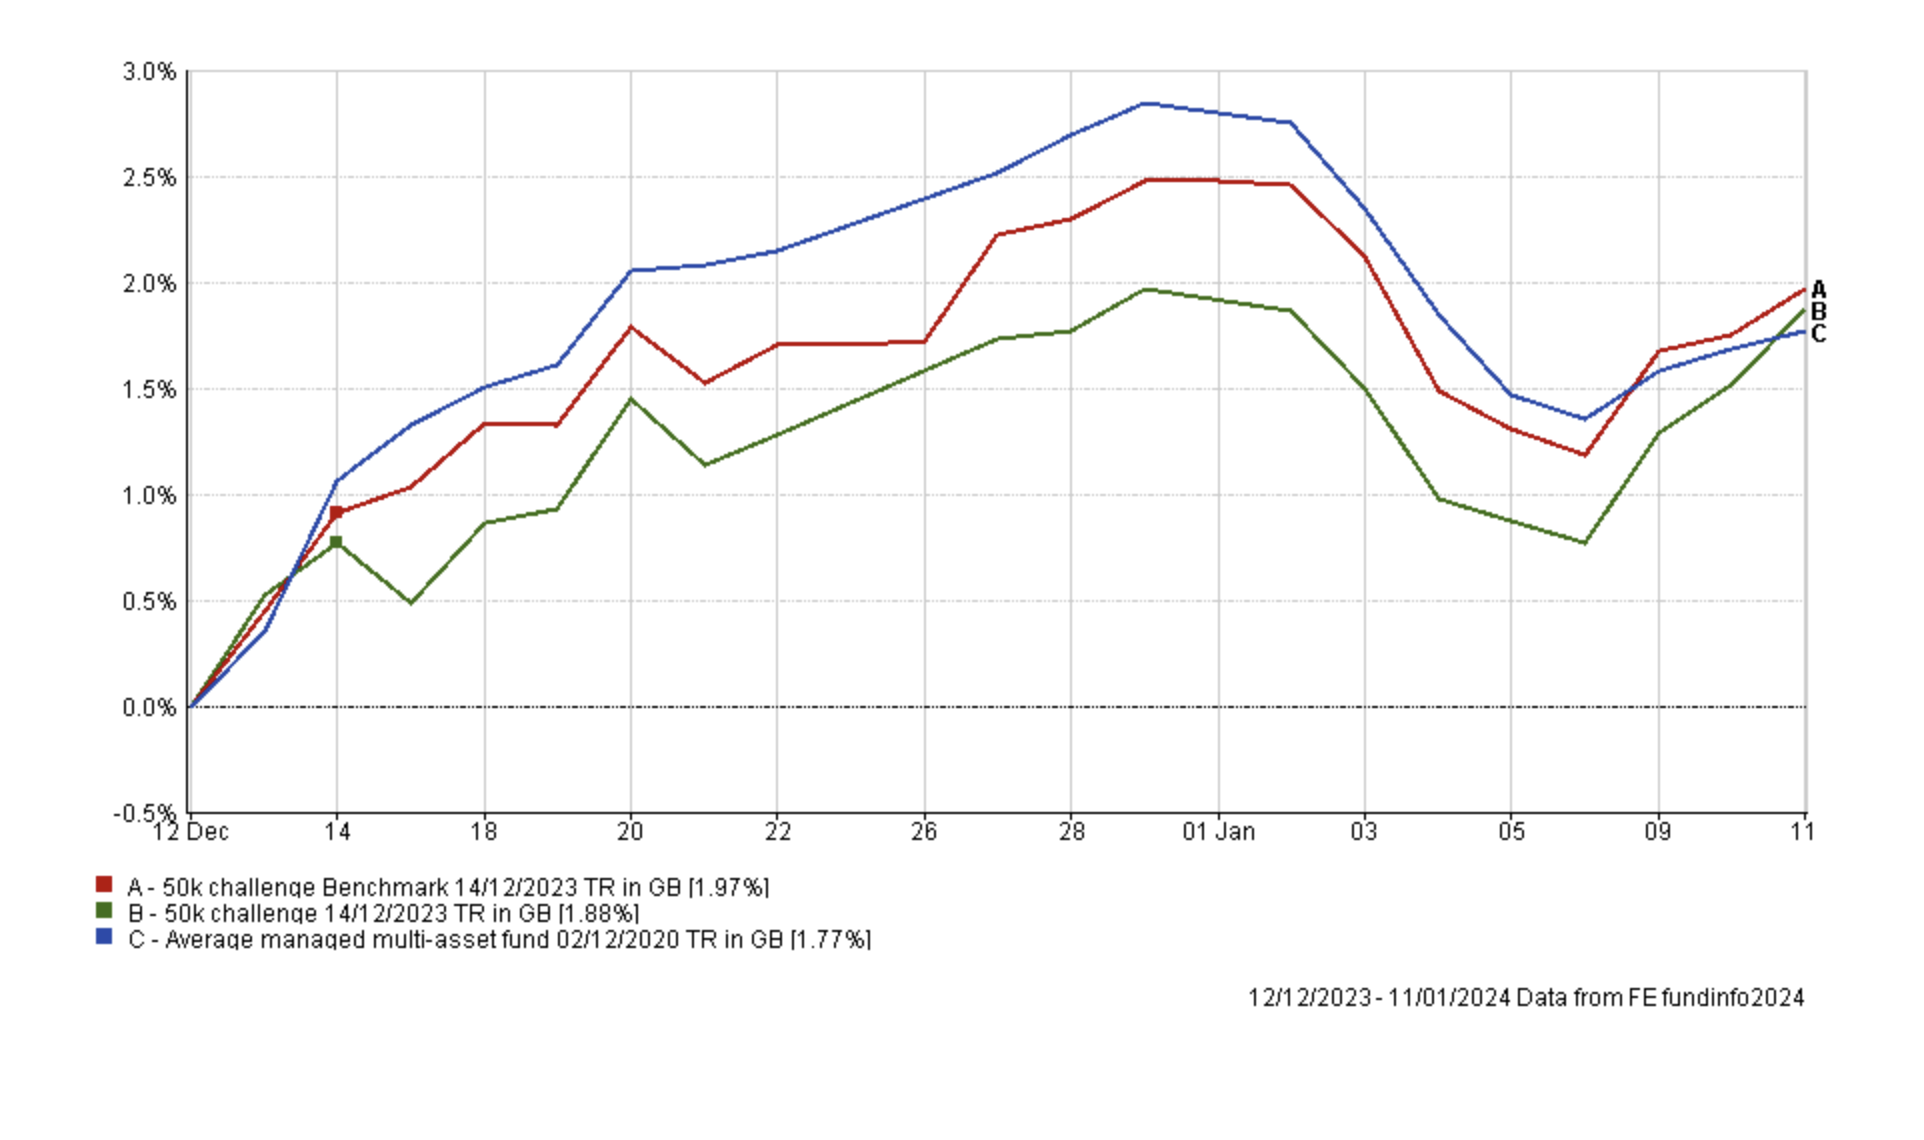
As is usual in my portfolio reviews, the chart below shows how my portfolio has outperformed since I started the challenge in March 2015. The green line is the performance of my portfolio while the red line is the benchmark showing the average return achieved by professional fund managers given the same asset mix. To accurately calculate this I have used the average return for each sector in which my portfolio invested. The blue line shows what the average multi-asset fund with comparable equity content achieved. In other words, the red line would show the extra performance added by just the asset mix of my portfolio (where I was invested i.e European equities etc) over picking a typical multi-asset fund (the blue line). While the green line (which is my actual performance) shows the impact of being in the right funds at the right time, as identified by the 80-20 Investor algorithm.
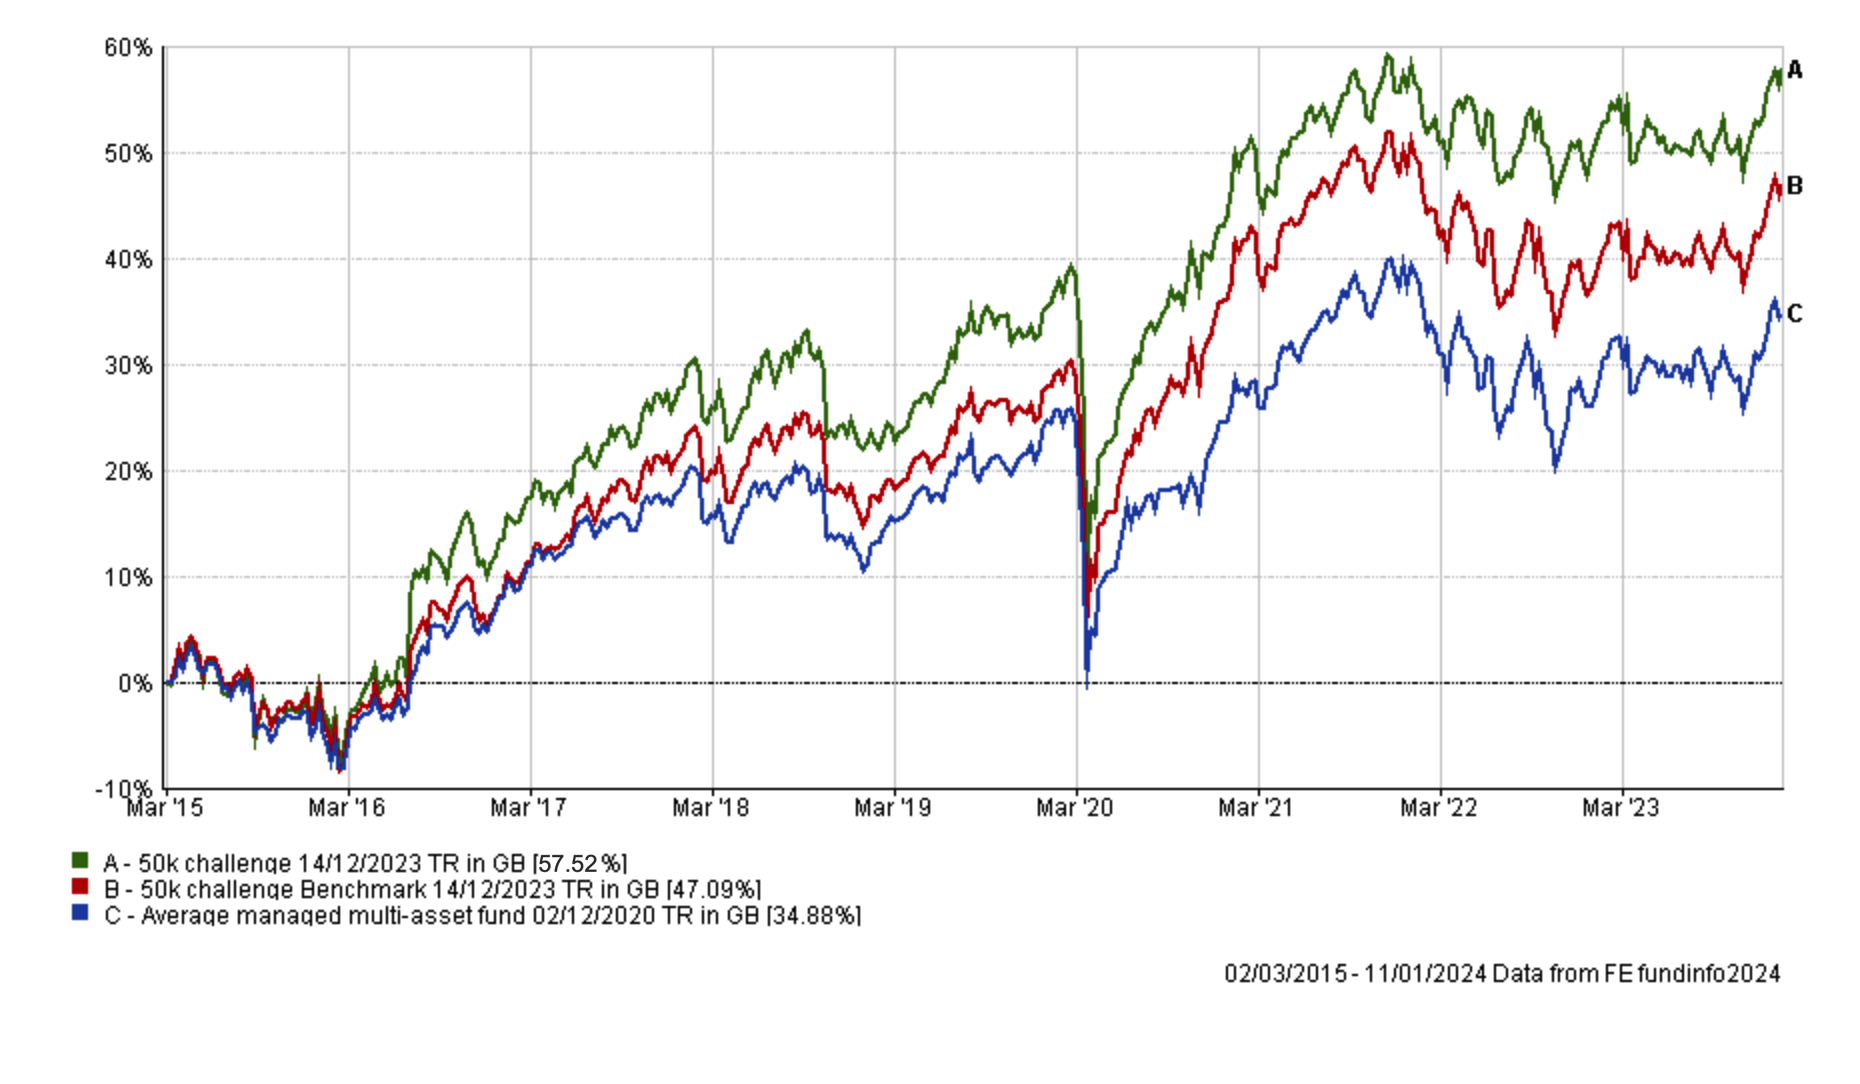
As you can see my portfolio struggled through December and into the year end, relative to its benchmarks. However, the weakness we saw in US stocks over the festive period, particularly tech stocks, dissipated and investors piled back in causing US stocks to explode higher, along with my own portfolio (the green line).
The table below shows the performance of the individual funds within my portfolio since my last review a month ago. As you can see. Indian and Japanese equities led the charge. However, there have been impressive performances across the board with the exception of the Thesis fund. Had I carried out this review a week ago the situation for the likes of L&G Global 100 Index and Fidelity American would have looked less rosy, with the latter rebounding around 1%, only in the last few days, to finish the month in positive territory
| Name | % return over the last month (since December's review) |
| Liontrust India | 5.05 |
| Fidelity Index Japan | 4.21 |
| T. Rowe Price US Large Cap Growth Equity | 2.8 |
| Troy Asset Management Ltd Trojan Global Equity | 2.1 |
| WS Saracen Global Income and Growth | 2.1 |
| abrdn High Yield Bond | 2.06 |
| L&G Global 100 Index Trust | 1.88 |
| Schroder Strategic Credit | 1.73 |
| BNY Mellon Multi-Asset Balanced | 1.34 |
| iShares Physical Gold ETC | 1.22 |
| Fidelity American | 0.41 |
| Thesis TM Tellworth UK Select | -0.23 |
As usual the table below shows which funds within my portfolio are in the current BOTB or BFBS tables and which are not. Those funds in blue are still in the BOTB while those in orange are not in the BOTB but remain in the BFBS list. Meanwhile, any funds in red have dropped out of both shortlists.
| Fund | Allocation | Risk | Sector | ISIN |
| abrdn High Yield Bond | 14.5 | Lower | Sterling High Yield | GB00B79RR984 |
| BNY Mellon Multi-Asset Balanced | 8.5 | Medium | Mixed Investment 40-85% Shares | GB00B8K9JZ06 |
| Fidelity American | 10 | Medium | North America | GB00B8GPC429 |
| Fidelity Index Japan | 5.5 | Medium | Japan | GB00BHZK8872 |
| iShares Physical Gold ETC | 5 | Medium | Commodity & Energy ETF | IE00B4ND3602 |
| T. Rowe Price US Large Cap Growth Equity | 5.5 | Higher | North America | GB00BD5FHW12 |
| L&G Global 100 Index Trust | 10 | Medium | Global | GB00B0CNH056 |
| Liontrust India | 5.5 | Higher | India/Indian Subcontinent | GB00B1L6DV51 |
| Schroder Strategic Credit | 8.5 | Lower | Sterling Strategic Bond | GB00BJZ2ZC09 |
| Thesis TM Tellworth UK Select | 6 | Lower | Targeted Absolute Return | GB00BNY7YM73 |
| Troy Asset Management Ltd Trojan Global Equity | 11 | Medium | Global | GB00B0ZJ5S47 |
| WS Saracen Global Income & Growth | 10 | Medium | Global Equity Income | GB00B5B35X02 |
This month five funds have once again fallen outside out the BOTB and BFBS tables and are coloured in red. These are:
- Troy Asset Management Ltd Trojan Global Equity
- BNY Mellon Multi-Asset Balanced
- Fidelity American
- L&G Global 100 Index Trust
- Schroder Strategic Credit
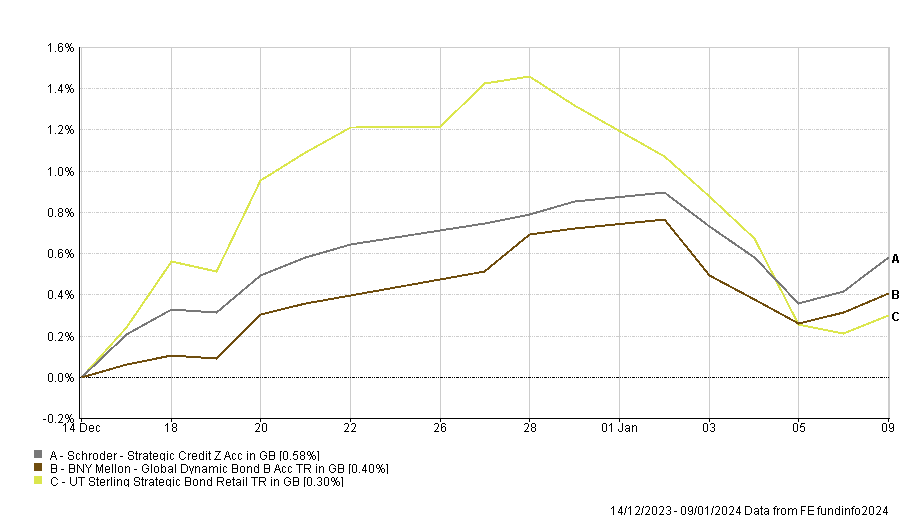
These five funds account for just under 50% of my portfolio and the first four funds were also outside of the BOTB and BFBS tables last month. The last fund, Schroder Strategic Credit, has actually outperformed it's peer group average since its been in my portfolio, as shown below, although it did lag for some time. As it is a new addition, it is still too early to decide whether to remove it from my portfolio. However, it has so far outperformed both cash and BNY Mellon Global Dynamic Bond, which were the holdings it replaced following my portfolio review last month. So for now I will maintain my holding in Schroder Strategic Credit.
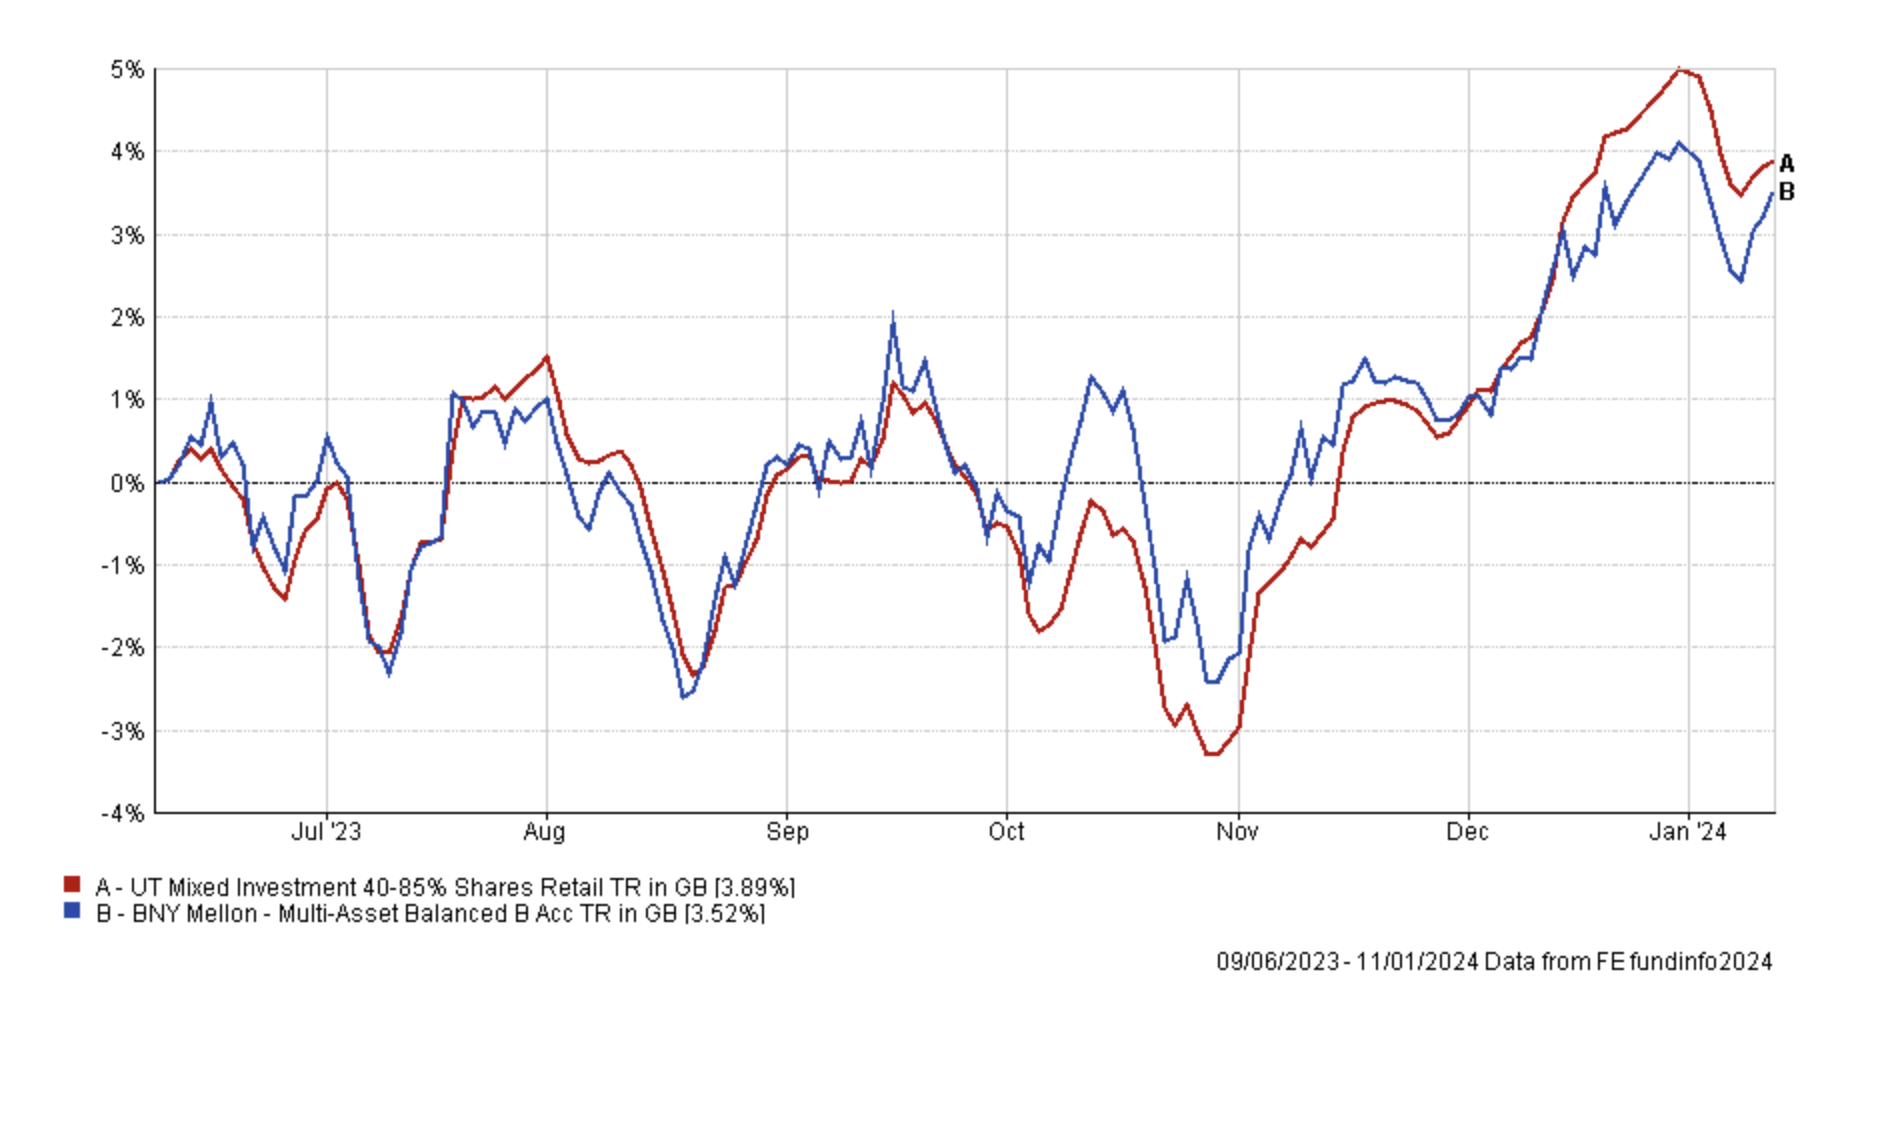
Last time I also planned to switch out of BNY Mellon Multi-Asset Balanced but decided against it at the last minute due to the market volatility at the time. Despite being out of the BOTB and BFBS tables for some time it has performed broadly in line with its sector average since June 2023, when the fund first entered my portfolio. However, the performance has lagged more recently, but having said that it has rebounded strongly since the new year. While I do want to replace the fund within my portfolio, if there was one out of the funds on my watchlist to leave for now, it would be this one as it hasn't been a disaster performance-wise, plus it is in the latest consistent funds selection.
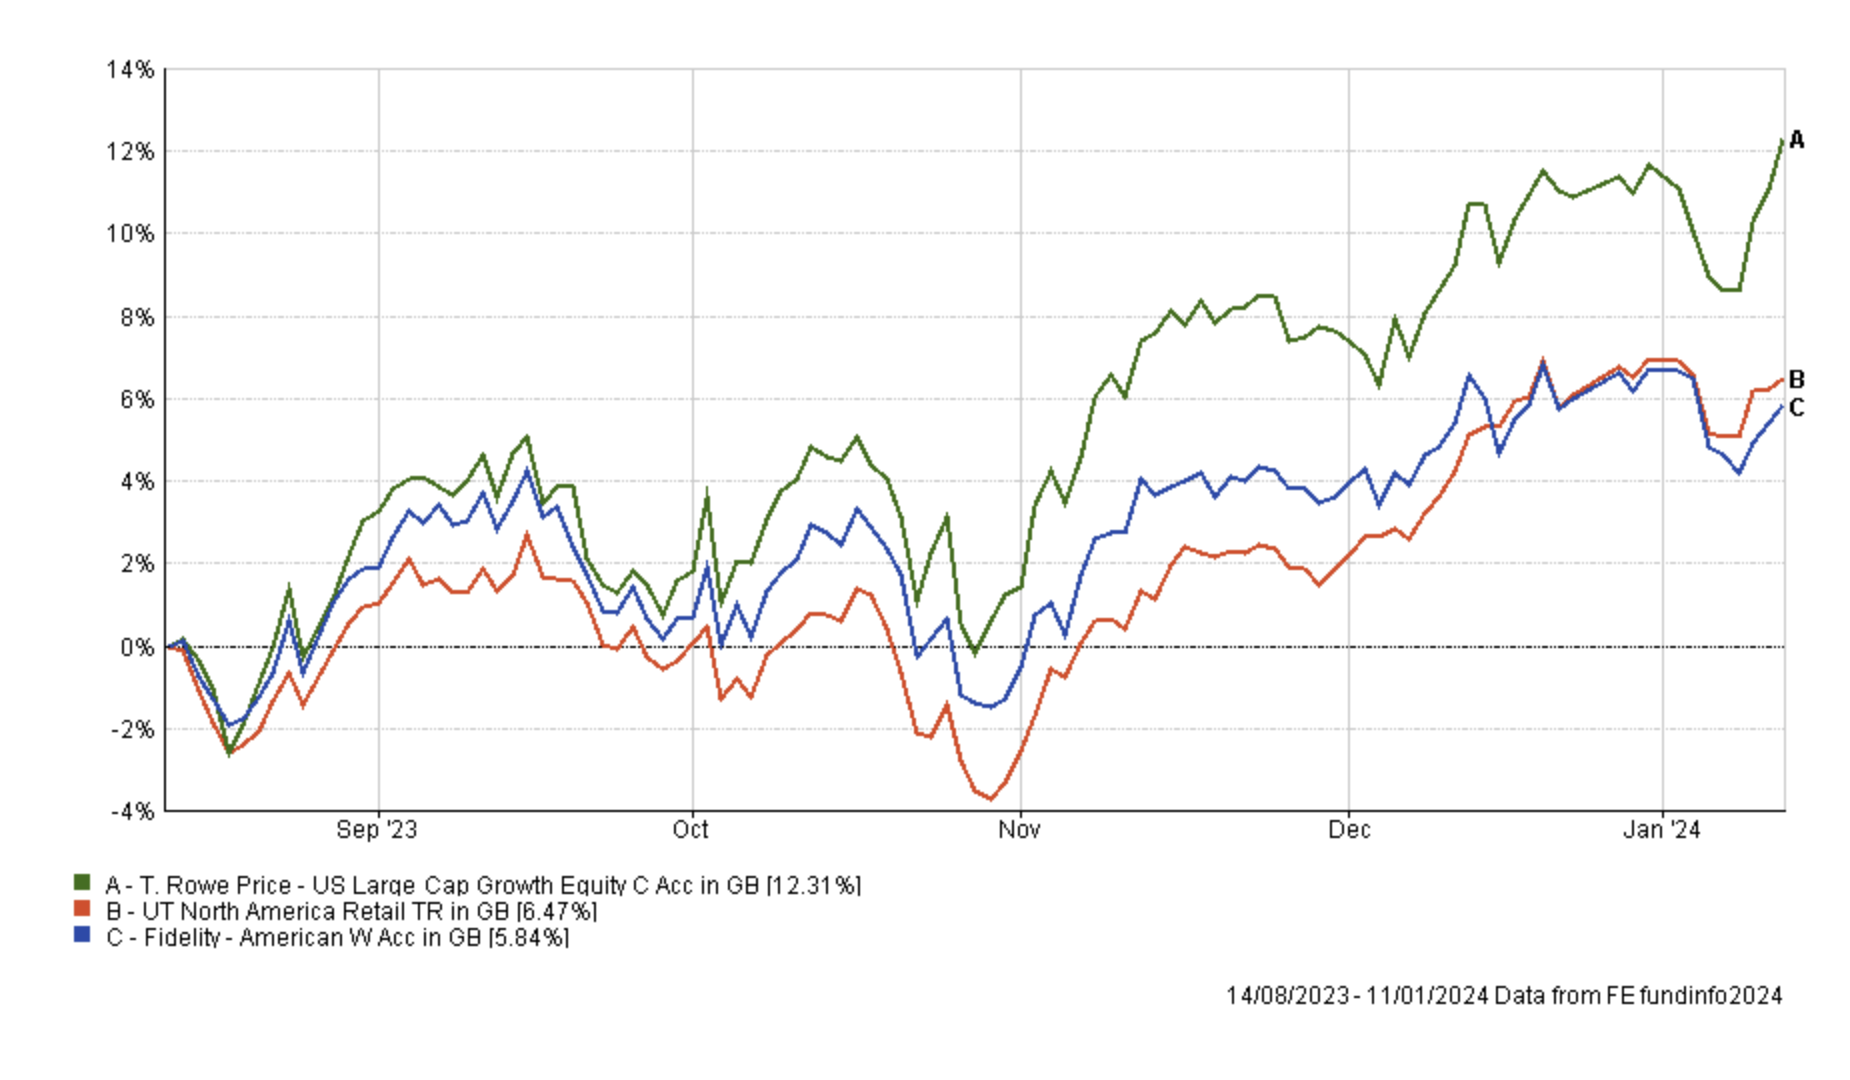
So that leaves me with Troy Trojan Global Equity, L&G Global 100 Index Trust and Fidelity American. These three funds still account for around 31% of my portfolio which is a significant figure. The chart below shows the performance of Fidelity American since I've held the fund in my portfolio. As you can see, the fund (the blue line) performed strongly versus its sector average (the orange line) up until the first week of December when its performance took a dip, partly a result of the breather we saw in tech stocks. By comparison you can see that the T. Rowe Price US Large Cap Growth Equity (the green line) has performed very strongly. It too was hit by the slump in tech stocks, thanks to its even greater exposure to them, but it has since rebounded.
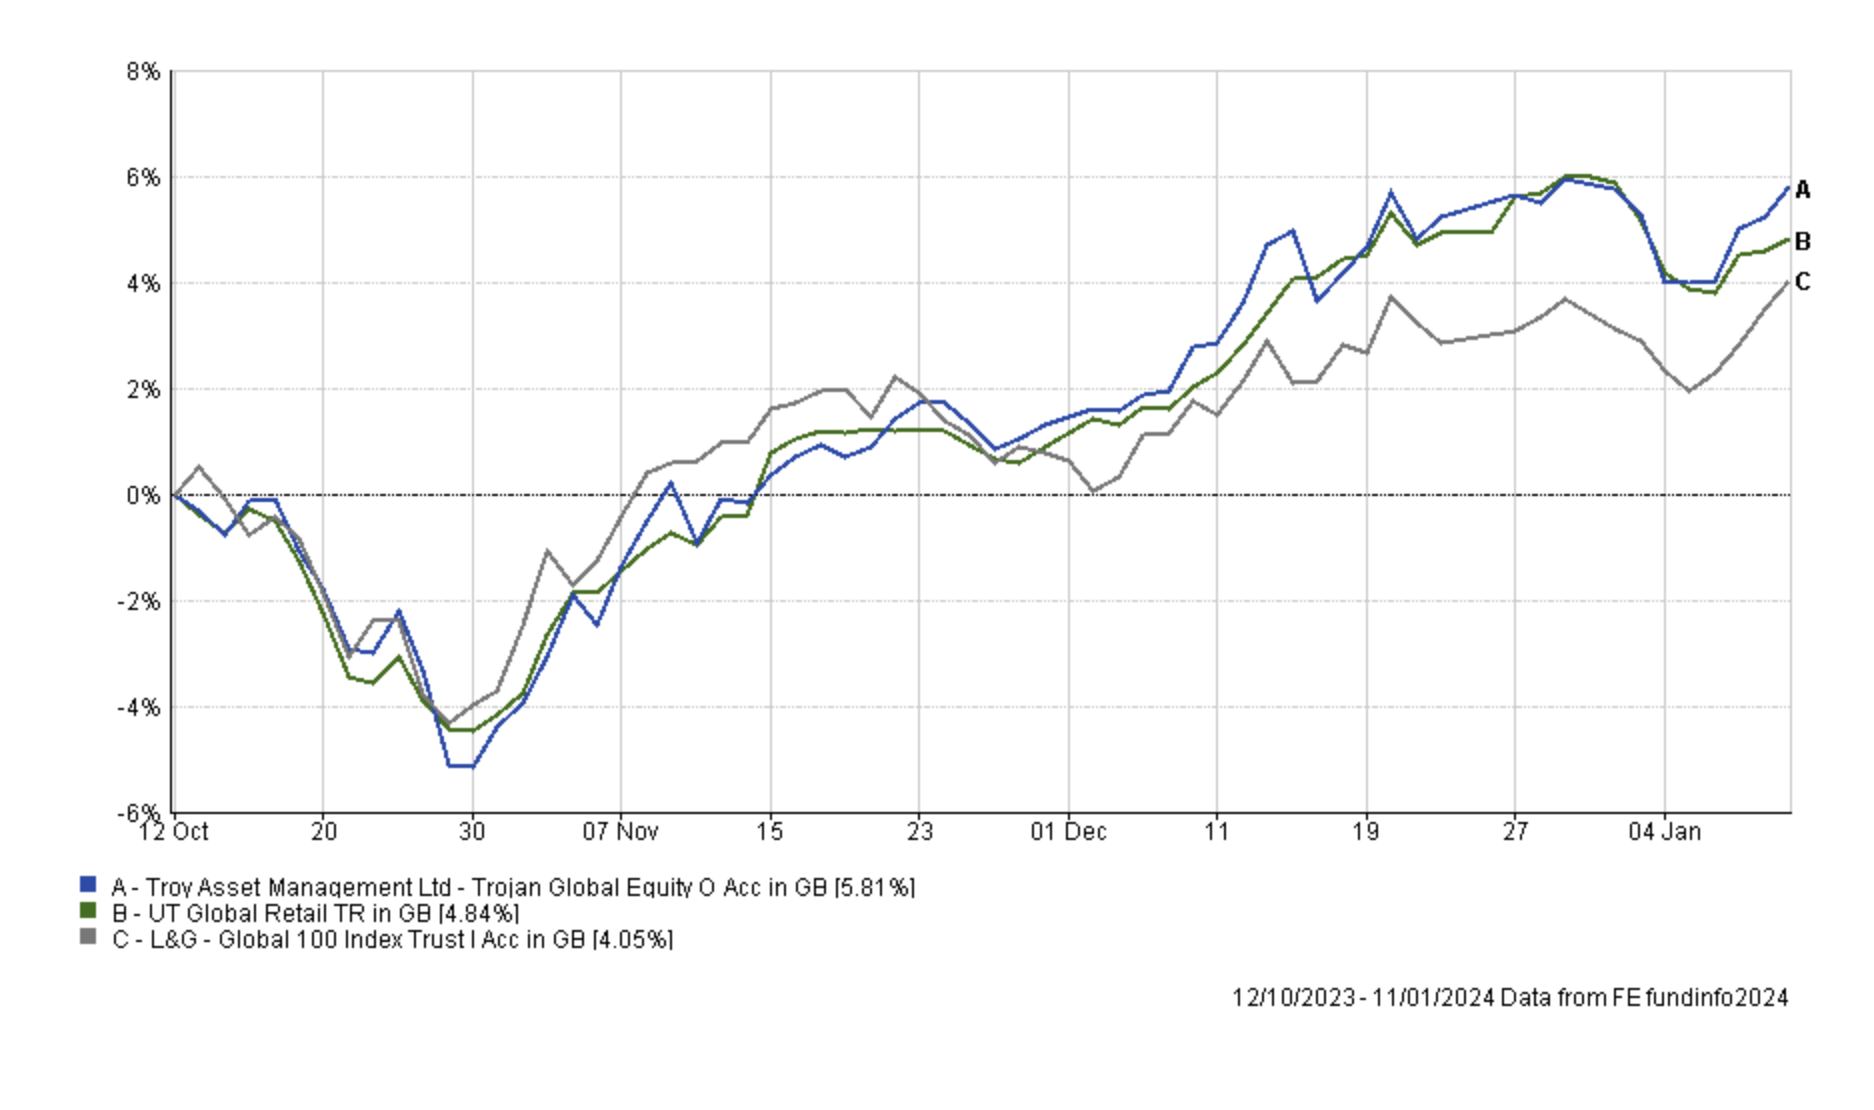
If we look at the performance of L&G Global 100 Index Trust, which resides in the global sector, it has lagged its sector average since I first invested in the fund back in October. However, Trojan Global Equity has been a stronger performer over the same period.
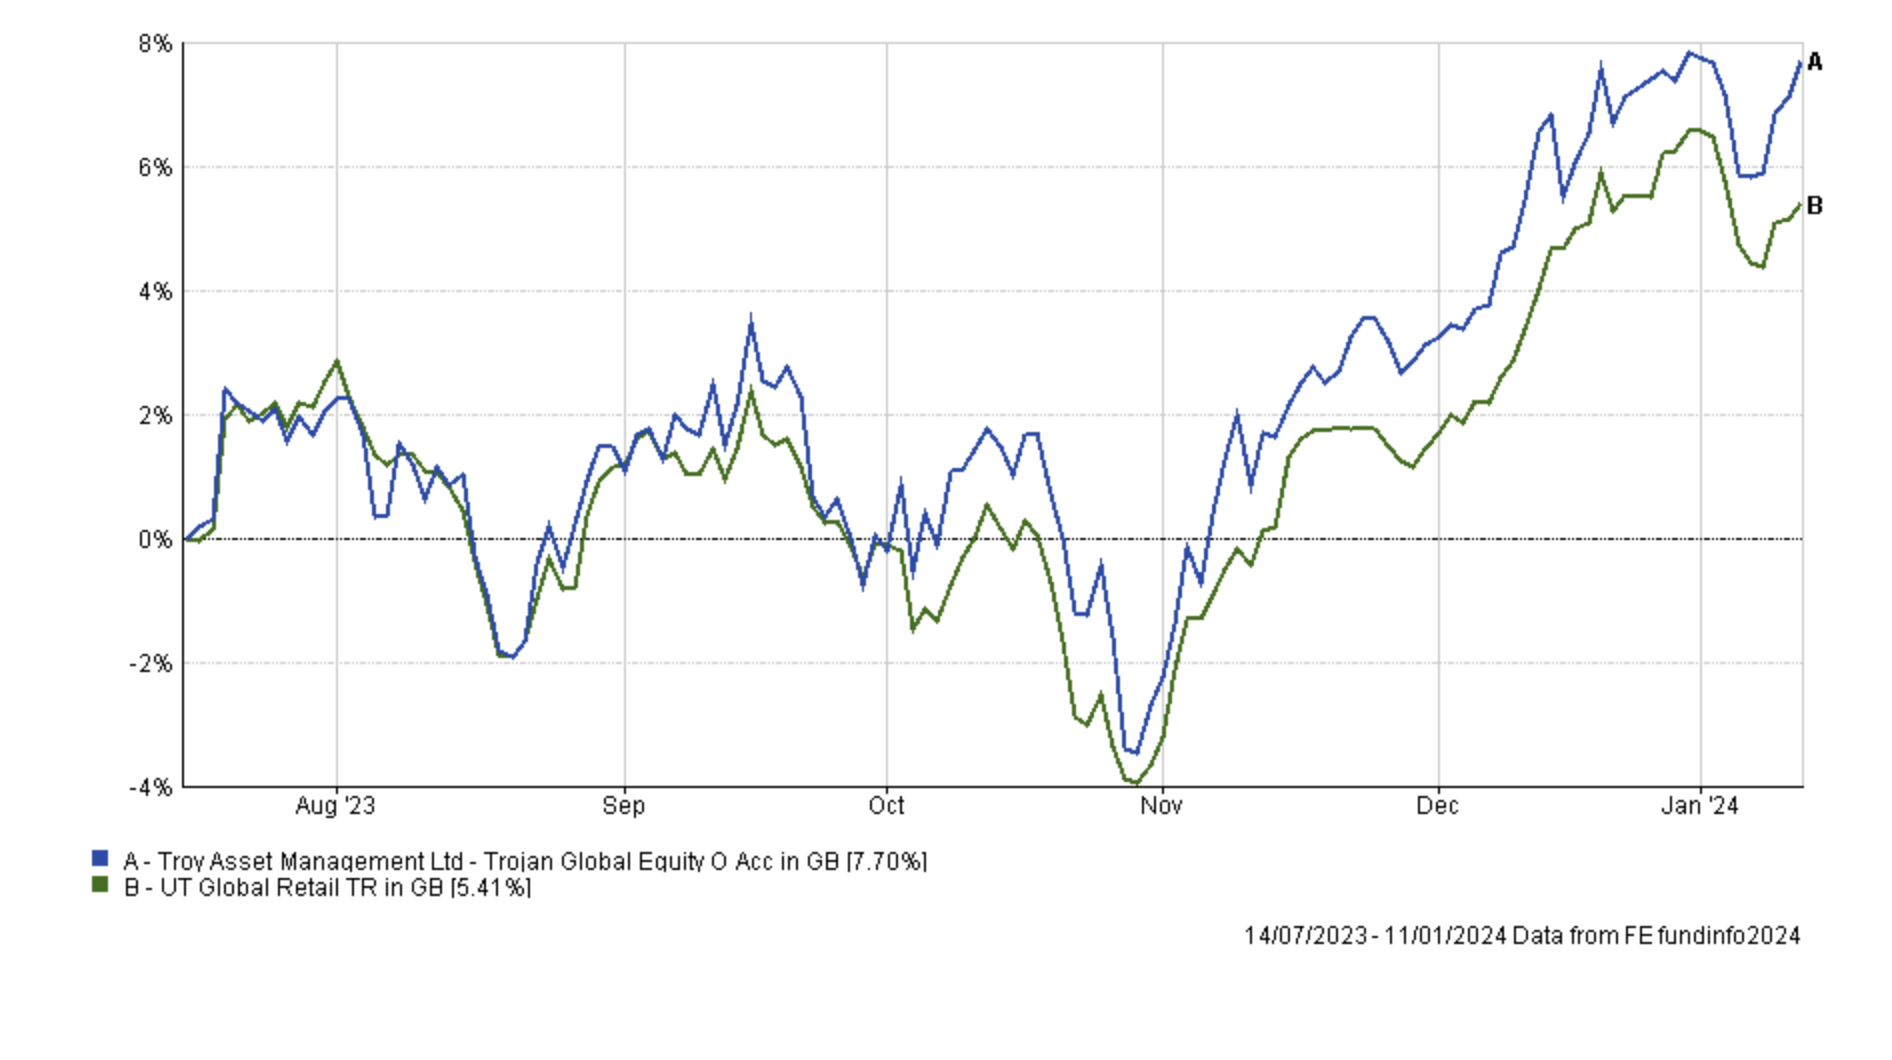
I have in fact owned Troy Trojan Global Equity since July and its performance versus the global sector average since that time has been good. It did experience a greater performance dip during the festive season. But again there has been an incredible rally following the new year, which at the time of writing is still in progress.
So, given the strong rally in US equity markets as I write this, it isn't the time to make wholesale changes to my equity allocation in these funds. That's because there is an increased chance that the market will move against me (i.e. continue higher) while I am out of the market and the fund switches are processed.
As can be seen by the earlier table showing the performance since my last review, Troy Asset Management Ltd Trojan Global Equity and L&G Global 100 Index Trust have performed particularly well, up 2.1% and 1.88% respectively. Fidelity American has lagged the other two. The 80-20 Investor algorithm and process allows for funds to be held for up to six months at a time, before reviewing them and all three of these funds have been within the BFBS or BOTB as recently as October/November. So there really isn't any need to panic, especially when they are rallying.
So rather than remove any of them entirely from my portfolio I will instead just reduce my holdings in L&G Global 100 Index Trust and Fidelity American in favour of other opportunities.
Fund switches
- 50% out of Fidelity American and 100% into T. Rowe Price US Large Cap Growth Equity
- 50% out of L&G Global 100 Index Trust and 100% into Fidelity UK Smaller Companies
The first switch is a like-for-like swap from one North American equity fund into another, although the latter does have more of a focus on technology stocks. By picking T. Rowe Price US Large Cap Growth Equity I am backing one of my portfolio's biggest 'winners' - but it is currently one of my smaller holdings. On the one hand this switch does increase the portfolio's susceptibility to a tech stock sell-off but the second switch counters this somewhat by reducing my overall US equity exposure in favour of UK equities.
With regard to the second switch I am increasing my UK equity exposure, more in line with the BOTB and have chosen Fidelity UK Smaller Companies from this month's BOTB selection. It is also a fund that has fared well in past Winter Portfolios.
These switches impact about 10% of my portfolio and affect the equity component only. The general theme is that while I could have made more changes I want to let current momentum trends run. My asset allocation remains largely the same as before (albeit with a larger UK equity exposure) which means that when compared to the latest BOTB I don't have any property equity exposure and a slightly lower emerging market equity exposure. So there are differences emerging which I can review going forward.
My portfolio
My portfolio now looks like this:
| Fund | Allocation | Risk | Sector | ISIN |
| abrdn High Yield Bond | 14.5 | Lower | Sterling High Yield |
GB00B79RR984
|
| BNY Mellon Multi-Asset Balanced | 8.5 | Medium | Mixed Investment 40-85% Shares | GB00B8K9JZ06 |
| Fidelity American | 5 | Medium | North America |
GB00B8GPC429
|
| Fidelity Index Japan | 5.5 | Medium | Japan |
GB00BHZK8872
|
| Fidelity UK Smaller Companies | 5 | Higher | UK Smaller Companies |
GB00B7VNMB18
|
| iShares Physical Gold ETC | 5 | Medium | Commodity & Energy ETF | IE00B4ND3602 |
| T. Rowe Price US Large Cap Growth Equity | 10.5 | Higher | North America |
GB00BD5FHW12
|
| L&G Global 100 Index Trust | 5 | Medium | Global |
GB00B0CNH056
|
| Liontrust India | 5.5 | Higher | India/Indian Subcontinent |
GB00B1L6DV51
|
| Schroder Strategic Credit | 8.5 | Lower | Sterling Strategic Bond | GB00BJZ2ZC09 |
| Thesis TM Tellworth UK Select | 6 | Lower | Targeted Absolute Return |
GB00BNY7YM73
|
| Troy Asset Management Ltd Trojan Global Equity | 11 | Medium | Global | GB00B0ZJ5S47 |
| WS Saracen Global Income & Growth* | 10 | Medium | Global Equity Income | GB00B5B35X02 |
My Portfolio asset mix
My portfolio asset mix has approximately 62% exposure to equities. Last month's figures are shown in brackets.
-
- UK Equities 8% (4%)
- North American Equities 25% (28%)
- Asian/Emerging Market Equities 6% (6%)
- Japanese Equities 6% (6%)
- European Equities 7% (7%)
- Chinese equities 0% (0%)
- Other equity 10% (11%)
- Commodities and energy 5% (5%)
- UK Fixed Interest 4% (4%)
- Global Fixed Interest 20% (20%)
- Cash 0% (0%)
- Alternative Investment Strategies 9% (9%)
- Property 0% (0%)
Damien's higher risk and lower risk portfolios
Using the logic described in my post: Update to Damien’s alternative risk portfolios I created hypothetical higher and lower risk versions of my portfolio below:
Lower risk
| Fund | Allocation % |
| abrdn High Yield Bond | 18 |
| BNY Mellon Multi-Asset Balanced | 11 |
| Fidelity American | 6 |
| Fidelity Index Japan | 7 |
| iShares Physical Gold ETC | 6 |
| L&G Global 100 Index Trust | 6 |
| Schroder Strategic Credit | 11 |
| Thesis TM Tellworth UK Select | 8 |
| Troy Asset Management Ltd Trojan Global Equity | 14 |
| WS Saracen Global Income & Growth | 13 |
Higher risk
| Fund | Allocation % |
| BNY Mellon Multi-Asset Balanced | 12 |
| Fidelity American | 7 |
| Fidelity Index Japan | 8 |
| Fidelity UK Smaller Companies | 7 |
| iShares Physical Gold ETC | 7 |
| T. Rowe Price US Large Cap Growth Equity | 15 |
| L&G Global 100 Index Trust | 7 |
| Liontrust India | 8 |
| Troy Asset Management Ltd Trojan Global Equity | 15 |
| WS Saracen Global Income & Growth | 14 |

£200 Pension Cashback Offer
Make a qualifying deposit or transfer a pension to our partner Interactive Investor.
- Deposit or transfer a pension of at least £20k and you could earn £200 cashback
- Terms and Fees apply, Capital at risk
- New & Existing customers opening a SIPP
- Offer ends 31st July 2026
Before starting your transfer, check you won't lose any valuable benefits (such as guaranteed annuity rates or a lower protected pension age) and find out what exit fees you might have to pay
