

The background to my portfolio
Back in March 2015 I decided to invest £50,000 of my own money using 80-20 Investor. The purpose was twofold, firstly to show how you can use 80-20 Investor to invest and outperform the market with only a few minutes effort every now and then. Secondly, no other investment commentator, journalist or research provider invests their own money for fear of failing. This is a sorry state of affairs and is precisely why I committed to openly running my own portfolio for 80-20 Investor members to see.
Since then I have periodically changed my portfolio using the fund suggestions provided by the 80-20 Investor algorithm and associated research. I always disclose the changes at the time they are made.
Performance update
As is usual in my portfolio reviews, the chart below shows how my portfolio has outperformed since I started the challenge in March 2015, which is five years ago. The green line is the performance of my portfolio while the red line is the benchmark showing the average return achieved by professional fund managers given the same asset mix. To accurately calculate this I have used the average return for each sector in which my portfolio invested. The blue line shows what the average multi-asset fund with comparable equity content achieved. In other words, the red line would show the extra performance added by just the asset mix of my portfolio (where I was invested i.e European equities etc) over picking a typical multi-asset fund (the blue line). While the green line (which is my actual performance) shows the impact of being in the right funds at the right time, as identified by the 80-20 Investor algorithm.
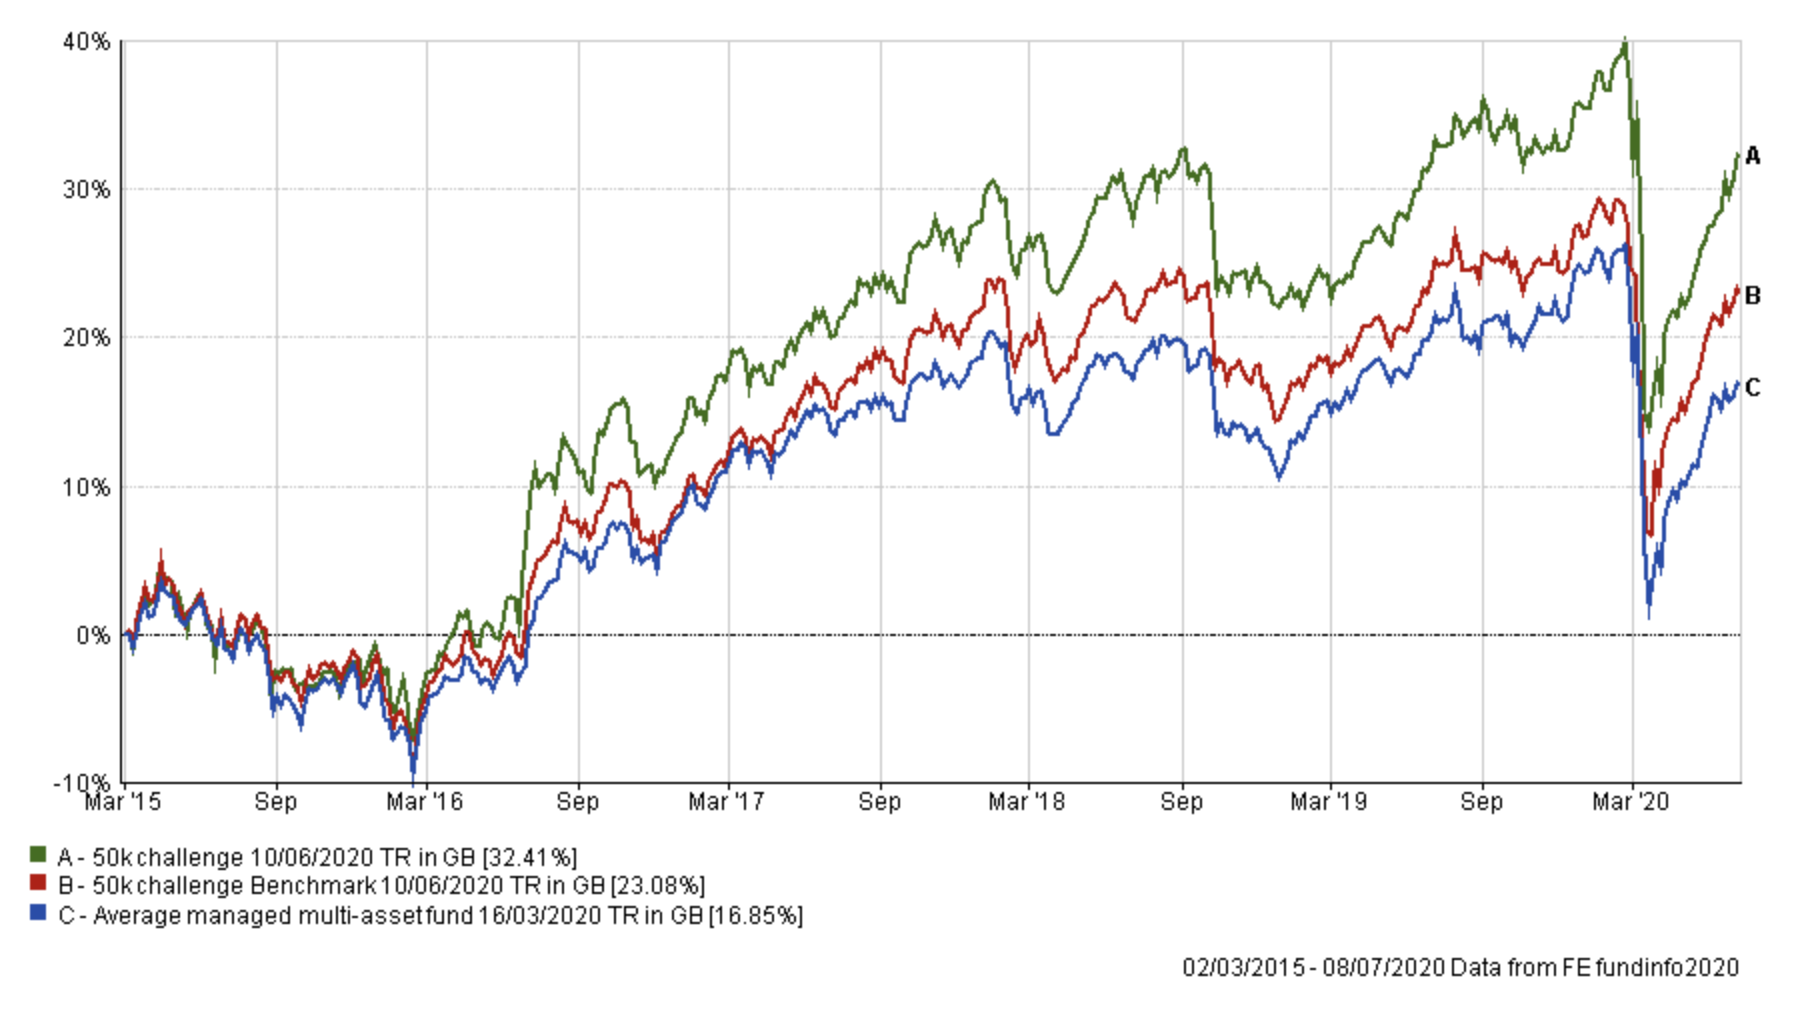
There are times when you position your portfolio and the market moves against you. But there are times when you position your portfolio and you hit a sweet spot and capture a developing trend beautifully.
Last month fell into the latter category. Looking at the chart above you will probably have noticed that my portfolio significantly extended its lead over its benchmarks during the last month. The chart below focuses on the performance of all three since my last portfolio review on June 10th.
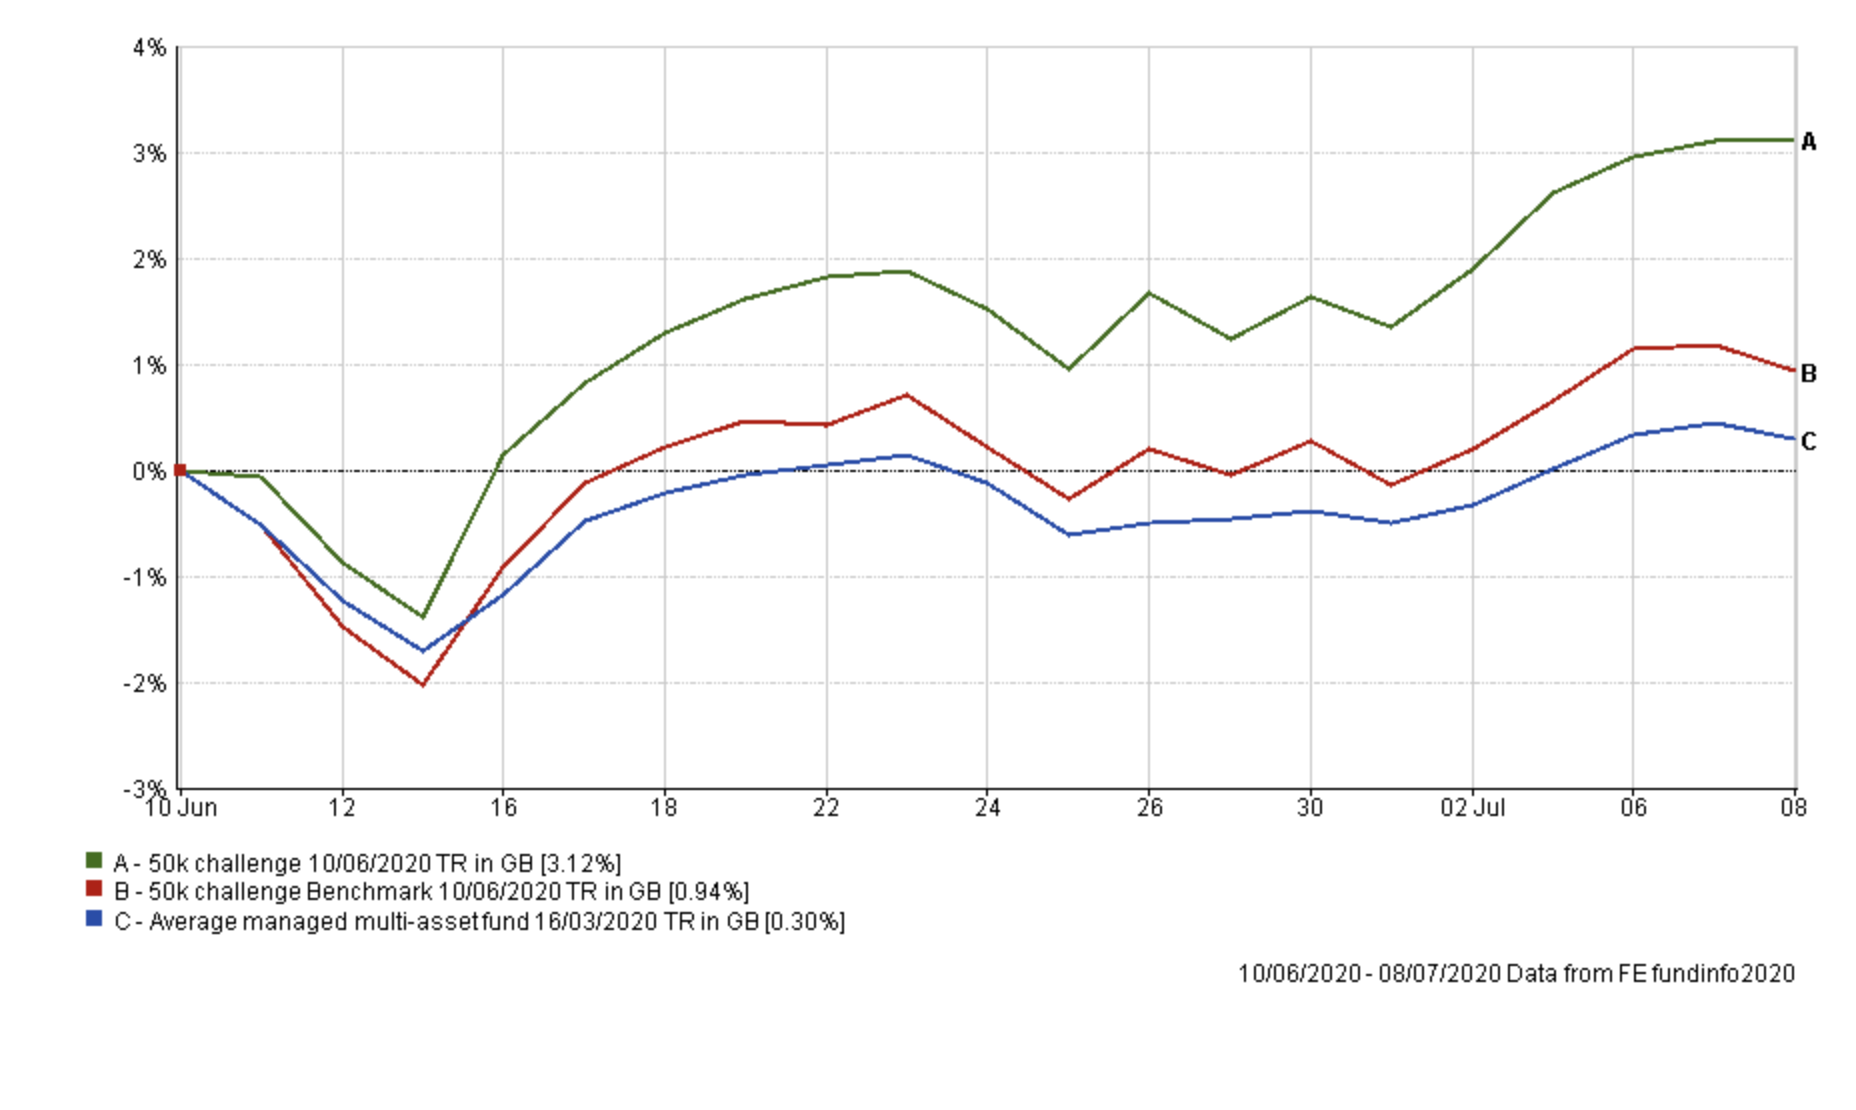
You can see how my portfolio has outperformed its benchmarks by as much as 2.82%. That is a significant amount over such a short period of time and probably one of the largest divergences over such a time frame since I’ve been running the portfolio. To emphasise the point further, only 8 out of the 430 professionally managed funds across the Mixed Investment 20-60% Shares and Mixed Investment 40-85% Shares sectors outperformed my portfolio over the last month.
So what drove this outperformance? The table below ranks the performance of the funds held within my portfolio, since last month’s review.
| Name | % return since June 10th |
| Baillie Gifford Long Term Global Growth Investment | 19.27 |
| Baillie Gifford Positive Change | 11.88 |
| Fidelity European | 3.02 |
| Schroder Global Healthcare | 2.84 |
| VT Gravis Clean Energy Income | 2.32 |
| Royal London UK Government Bond | 1.1 |
| Allianz Strategic Bond | 0.99 |
| Liontrust Sustainable Future Cautious Managed | 0.92 |
| Troy Asset Management Ltd Trojan Ethical | 0.89 |
| Premier Diversified Growth | -0.22 |
| Jupiter Japan Income | -2.06 |
Every fund, with the exception of Jupiter Japan Income and Premier Diversified Growth produced a positive return. The defensive elements of the portfolio have even performed well (namely Allianz Strategic Bond, Trojan Ethical, Royal London UK Government Bond) and are up around 1%.
But it’s the eye-watering gains from Baillie Gifford Long Term Global Growth Investment and Baillie Gifford Positive Change that really propelled the portfolio higher. Both have a US stock bias, so in a month where US tech stocks set new-all time highs we would expect to see strong returns from both funds, but 19.27% from Baillie Gifford Long Term Global Growth Investment is staggering. It will be interesting to see how long the US tech / Government Bond bias will continue to work so well for my portfolio. Technology stocks are becoming overcrowded because not only were they popular from a growth perspective but in the work-from-home COVID environment we find ourselves in they are also being seen as defensive plays.
The decision to increase my portfolio’s equity content from 45% to 52% last month was also rewarded.
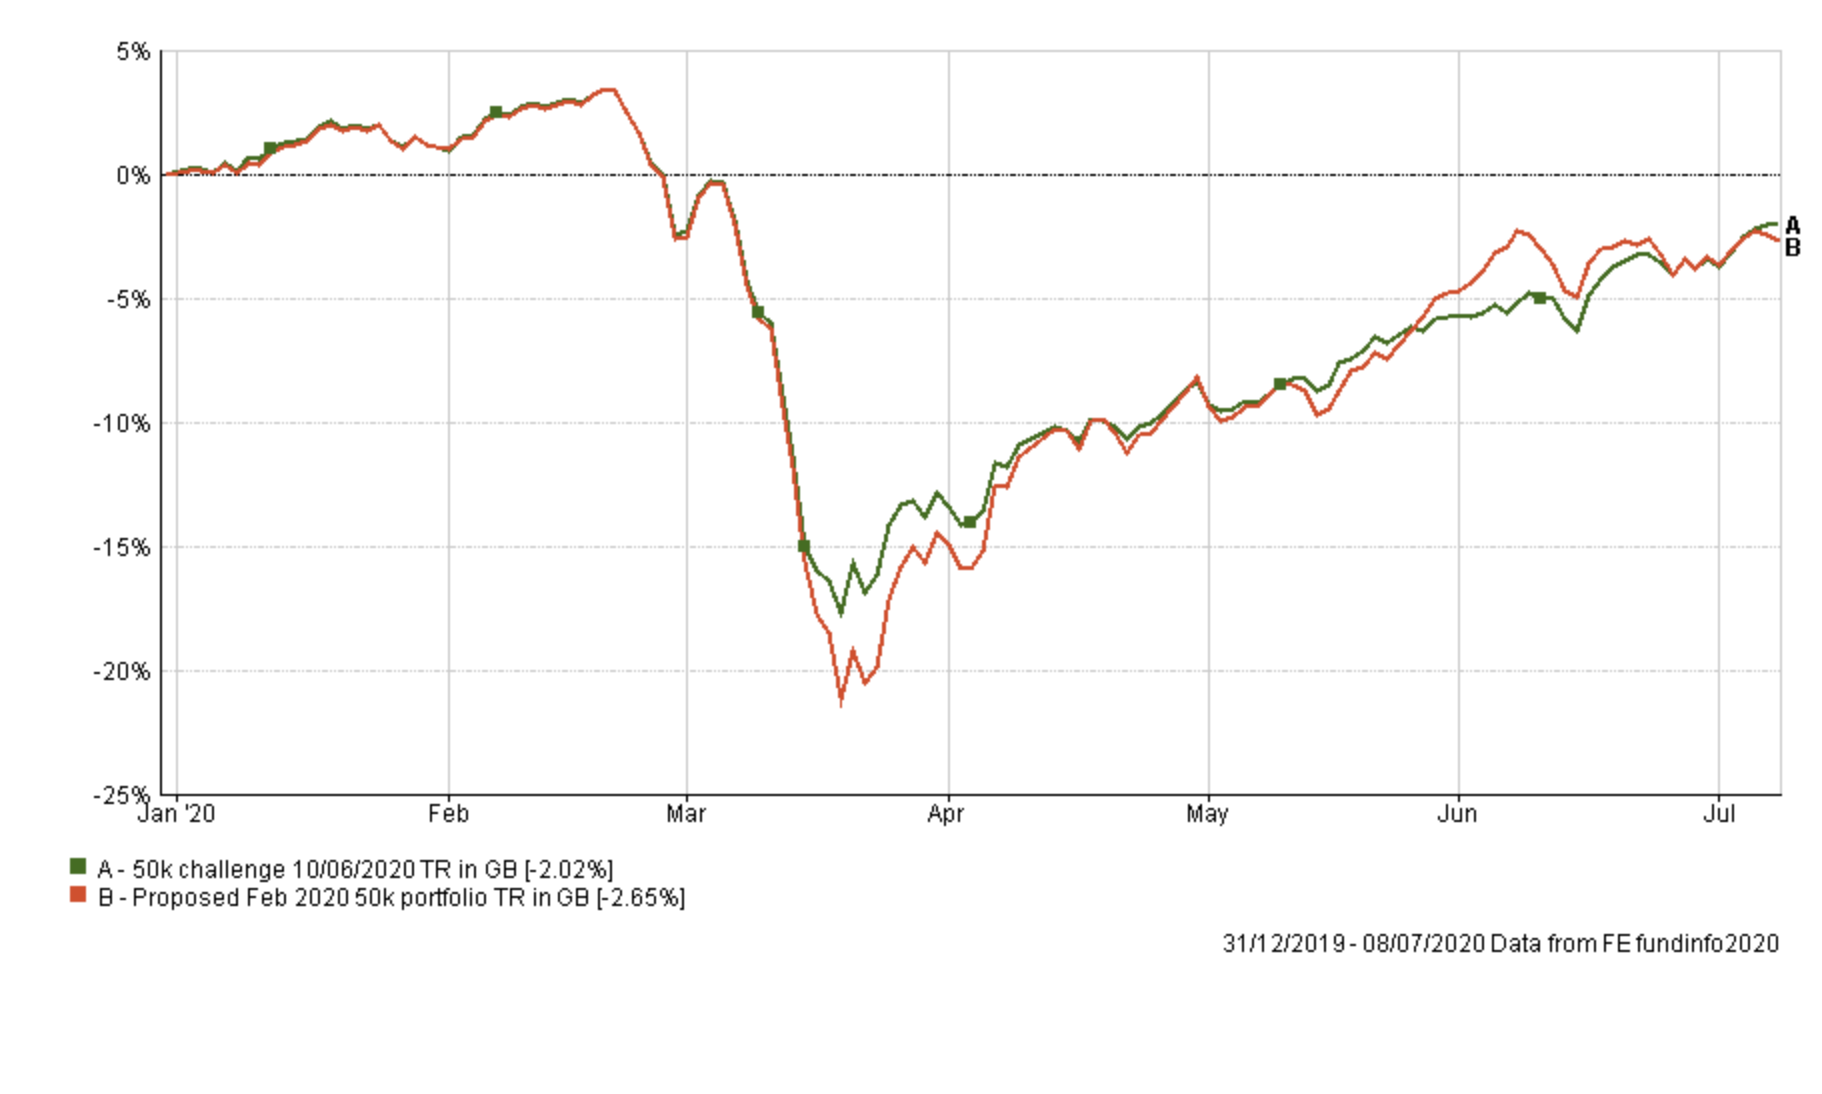
Last time I also carried out an interesting exercise where I looked at the performance of my portfolio since the start of the year (and across the recent sell-off) versus a hypothetical portfolio assuming that I did not make any changes since pre-Covid. Last time the evidence suggested that my portfolio tweaks had reduced the downside risks while capturing nearly all of the upside of the ‘do nothing’ portfolio which had a higher equity exposure. Interestingly in re-running the exercise you can see how my portfolio is now actually outperforming the ‘do nothing portfolio’ while taking a much lower level of investment risk
As is the routine in these portfolio reviews, the table below shows which funds within my portfolio are in the current BOTB or BFBS tables and which are not. Those funds in green are still in the BOTB while those in yellow are not in the BOTB but remain in the BFBS list. Meanwhile, any funds in red have dropped out of both shortlists.
| Name | Allocation % (rounded) | Risk | Sector | ISIN Code |
| Fidelity European | 5 | Medium | Europe Excluding UK | GB00BFRT3504 |
| Jupiter Japan Income | 6.5 | High | Japan | GB00B0HZTZ55 |
| Schroder Global Healthcare | 7.5 | Medium | Global | GB00B76V7Q08 |
| Baillie Gifford Long Term Global Growth Investment | 8 | High | Global | GB00BD5Z0Z54 |
| VT Gravis Clean Energy Income | 11 | Medium | Global | GB00BFN4H792 |
| Premier Diversified Growth | 9.5 | Medium | Mixed Investment 40-85% Shares | GB00B8BJV423 |
| Royal London UK Government Bond | 15 | Medium | UK Gilts | GB00B881TW52 |
| Allianz Strategic Bond | 17 | Low | Sterling Strategic Bond | GB00B06T9362 |
| Troy Asset Management Ltd Trojan Ethical | 10.5 | Medium | Flexible Investment | GB00BJP0XX17 |
| Baillie Gifford Positive Change | 5 | High | Global | GB00BYVGKV59 |
| Liontrust Sustainable Future Cautious Managed | 5 | Medium | Mixed Investment 40-85% Shares | GB00BMN90304 |
Interestingly the only real difference between this month and last month is that Schroder Global Healthcare has now fallen out of the 80-20 Investor tables while the Liontrust Sustainable Future Cautious Managed fund has fallen out of the BOTB but remains in the BFBS. Given the success of the portfolio over the last month, I am inclined to leave it mostly alone.
The reasons for retaining VT Gravis Clean Energy Income, Premier Diversified Growth and Fidelity European last month when they were also coloured red, largely holds true once again and in this strong market rebound it pays to remain invested in the market. In any event, all three funds remain on my watchlist.
However, I want to try something a little different with my portfolio. In recent weeks you will no doubt have enjoyed the research articles 'The best all-weather portfolios analysed' and 'Should you ever invest in gold? If so how much?'.
I have been asked by some of you how you might add some gold exposure to a portfolio so I have decided to introduce some direct exposure in my portfolio to demonstrate. Currently, the Trojan Ethical funds provide some exposure to gold via a 7% exposure to a physical gold ETF.
If you have looked at the ETF BFBS table recently you will have noticed that gold ETFs have been making an appearance. The one issue is that many of these are leveraged (the name tells you this) so it is best to use the BFBS ETF table as a guide to the type of commodity or asset you might be interested in and then look to see what your investment platform offers, which isn't leveraged.
Personally, I would never buy a leveraged ETF because of the high risk of losing money, and I would always prefer to own a physically-backed ETF where possible. My platform has one physical gold ETF, namely iShares Physical Gold ETC which I can invest in. Of course, like most platforms, it levies a transaction charge of £10 whenever you buy or sell an ETF whereas unit trust switches are free. But given that a physically-backed ETF is the best way to gain gold exposure (there really isn't much option in the unit trust universe beyond gold mining shares) I am willing to pay it.
My decision to invest 5% of my portfolio in a gold ETF is a longer-term play based upon the aforementioned research because gold has proved a great diversifier. It is for that reason that I don't mind paying the small transaction charge. The price of gold has hit an 8 year high which means that it is susceptible to a pullback but it's ability to diversify a portfolio would still justify its inclusion for now. I plan to take the 5% exposure from my holding in the VT Gravis Clean Energy Income fund as this itself is a commodity play. While the gold price has an equity-like volatility the ETF risk profile based upon the 80-20 Investor methodology would be determined as medium risk. So by making the switch I am not making a drastic change to asset or risk make-up of my portfolio. Unfortunately, because the switch is from a unit trust to an ETF I will have to sell part of the unit trust (the VT Gravis Clean Energy Income fund) within my ISA and wait for the proceeds to clear before buying the gold ETF. It's slightly cumbersome but that is the world we live in.
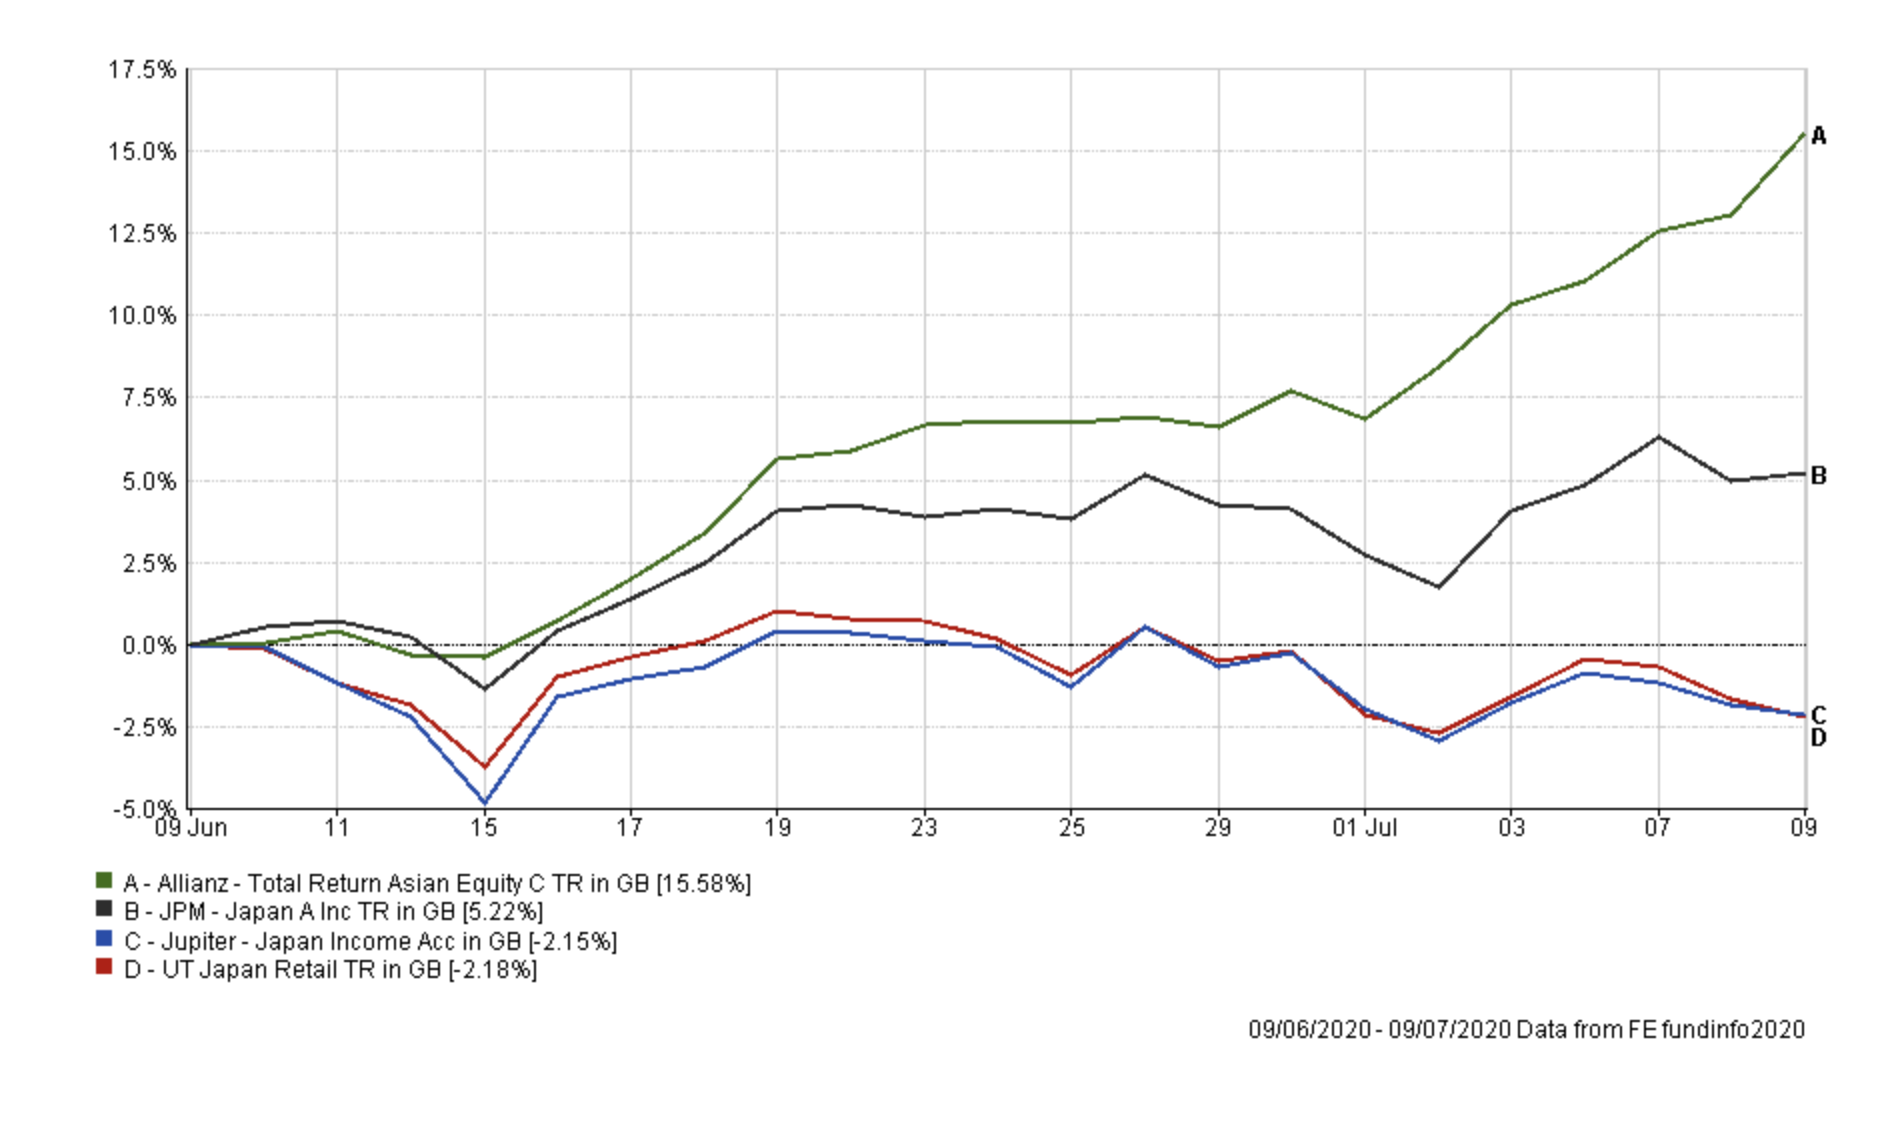
Finally, I plan to switch out of the Jupiter Japan Income fund. It has been out of the 80-20 Investor tables for some time but has continued to lag its peers over the last month as shown by the chart below. While not disastrous the fund is in danger of just being an expensive tracker. So I plan to broaden my Asian equity exposure and invest in the Allianz Total Return Asian Equity fund and the JPM Japan fund, both of which are in this month's BOTB. This Allianz fund has performed incredibly strongly as it has around 40% exposure to Chinese Equities, most of which are related to Chinese technology stocks. Again this is a very hot and crowded trade right now and there is obviously the risk that we could see a pullback but the fund will only make up around 3% of my portfolio. While there are risks I should also point out that the fund did hold up better than the Jupiter Japan Income fund during the worst of the coronavirus crisis.
In the next section, I list the of fund changes which I will implement.
Fund switches
- 50% out of VT Gravis Clean Energy Income and 100% into iShares Physical Gold ETC
- 100% out of Jupiter Japan Income and 50% into Allianz Total Return Asian Equity & 50% into JPM Japan
The fund changes only impact approximately 10% of my portfolio.
My portfolio now looks as shown in the table below. My portfolio now has the largest number of funds (at 13) that it has had for some time but given the market uncertainty I am happy with how diversified the portfolio is as a result. I will look to reduce the number of funds within the portfolio in the future.
| Name | Allocation % (rounded) | Risk | Sector | ISIN Code |
| Fidelity European | 5 | Medium | Europe Excluding UK | GB00BFRT3504 |
| Schroder Global Healthcare | 7.5 | Medium | Global | GB00B76V7Q08 |
| Baillie Gifford Long Term Global Growth Investment | 9 | High | Global | GB00BD5Z0Z54 |
| VT Gravis Clean Energy Income | 5.5 | Medium | Global | GB00BFN4H792 |
| Premier Diversified Growth | 9 | Medium | Mixed Investment 40-85% Shares | GB00B8BJV423 |
| Royal London UK Government Bond | 15 | Medium | UK Gilts | GB00B881TW52 |
| Allianz Strategic Bond | 16.5 | Low | Sterling Strategic Bond | GB00B06T9362 |
| Troy Asset Management Ltd Trojan Ethical | 10.5 | Medium | Flexible Investment | GB00BJP0XX17 |
| Baillie Gifford Positive Change | 5.5 | High | Global | GB00BYVGKV59 |
| Liontrust Sustainable Future Cautious Managed | 5 | Medium | Mixed Investment 40-85% Shares | GB00BMN90304 |
| iShares Physical Gold ETC | 5.5 | Medium | Commodity & Energy ETF | - |
| Allianz Total Return Asian Equity | 3 | Medium | Asia Pacific Excluding Japan | GB00B1FRQV53 |
| JPM Japan | 3 | Medium | Japan | GB00B1XMTP77 |
My Portfolio asset mix
My portfolio asset mix is as shown below (the previous asset mix is in brackets). My equity exposure is now approximately 48%, which is still less than I had before the coronavirus sell-off. It is also around 5% lower than my portfolio last month but interestingly in line with the BOTB for July. Although the equity content has reduced the volatility in the price of gold is often equity-like which is why the risk profile of my portfolio remains largely the same.
-
- UK Equities 5% (5%)
- North American Equities 20% (21%)
- Global Fixed Interest 23% (23%)
- Japanese Equities 4% (6%)
- European Equities 11% (11%)
- UK Fixed Interest 0% (0%)
- UK Gilt 13% (13%)
- Cash 4% (4%)
- Alternative Investment Strategies 7% (8%)
- Asian Equities 3% (0%)
- Emerging Market Equities 3% (3%)
- Commodities and energy 7% (6%)
- Property 0% (0%)
Damien's higher risk and lower risk portfolios
Using the logic described in my post: Update to Damien’s alternative risk portfolios I created hypothetical higher and lower risk versions of my portfolio below:
Higher risk
| Name | Allocation % |
| Fidelity European | 6 |
| Schroder Global Healthcare | 9 |
| Baillie Gifford Long Term Global Growth Investment | 9.5 |
| VT Gravis Clean Energy Income | 7 |
| Premier Diversified Growth | 11.5 |
| Royal London UK Government Bond | 18 |
| Troy Asset Management Ltd Trojan Ethical | 13 |
| Baillie Gifford Positive Change | 6 |
| Liontrust Sustainable Future Cautious Managed | 6 |
| iShares Physical Gold ETC | 6 |
| Allianz Total Return Asian Equity | 4 |
| JPM Japan | 4 |
Lower risk
| Fund | Allocation % |
| Fidelity European | 6 |
| Schroder Global Healthcare | 8 |
| VT Gravis Clean Energy Income | 7 |
| Premier Diversified Growth | 11 |
| Royal London UK Government Bond | 17.5 |
| Allianz Strategic Bond | 19.5 |
| Troy Asset Management Ltd Trojan Ethical | 12 |
| Liontrust Sustainable Future Cautious Managed | 6 |
| iShares Physical Gold ETC | 6 |
| Allianz Total Return Asian Equity | 3.5 |
| JPM Japan | 3.5 |

£200 Pension Cashback Offer
Make a qualifying deposit or transfer a pension to our partner Interactive Investor.
- Deposit or transfer a pension of at least £20k and you could earn £200 cashback
- Terms and Fees apply, Capital at risk
- New & Existing customers opening a SIPP
- Offer ends 31st July 2026
Before starting your transfer, check you won't lose any valuable benefits (such as guaranteed annuity rates or a lower protected pension age) and find out what exit fees you might have to pay
