

The background to my portfolio
Back in March 2015 I decided to invest £50,000 of my own money using 80-20 Investor. The purpose was twofold, firstly to show how you can use 80-20 Investor to invest and outperform the market with only a few minutes effort every now and then. Secondly, no other investment commentator, journalist or research provider invests their own money for fear of failing. This is a sorry state of affairs and is precisely why I committed to openly running my own portfolio for 80-20 Investor members to see.
Since then I have periodically changed my portfolio using the fund suggestions provided by the 80-20 Investor algorithm and associated research. I always disclose the changes at the time they are made.
Performance update
As is usual in my portfolio reviews, the chart below shows how my portfolio has outperformed since I started the challenge in March 2015. The green line is the performance of my portfolio while the red line is the benchmark showing the average return achieved by professional fund managers given the same asset mix. To accurately calculate this I have used the average return for each sector in which my portfolio invested. The blue line shows what the average multi-asset fund with comparable equity content achieved. In other words, the red line would show the extra performance added by just the asset mix of my portfolio (where I was invested i.e European equities etc) over picking a typical multi-asset fund (the blue line). While the green line (which is my actual performance) shows the impact of being in the right funds at the right time, as identified by the 80-20 Investor algorithm.
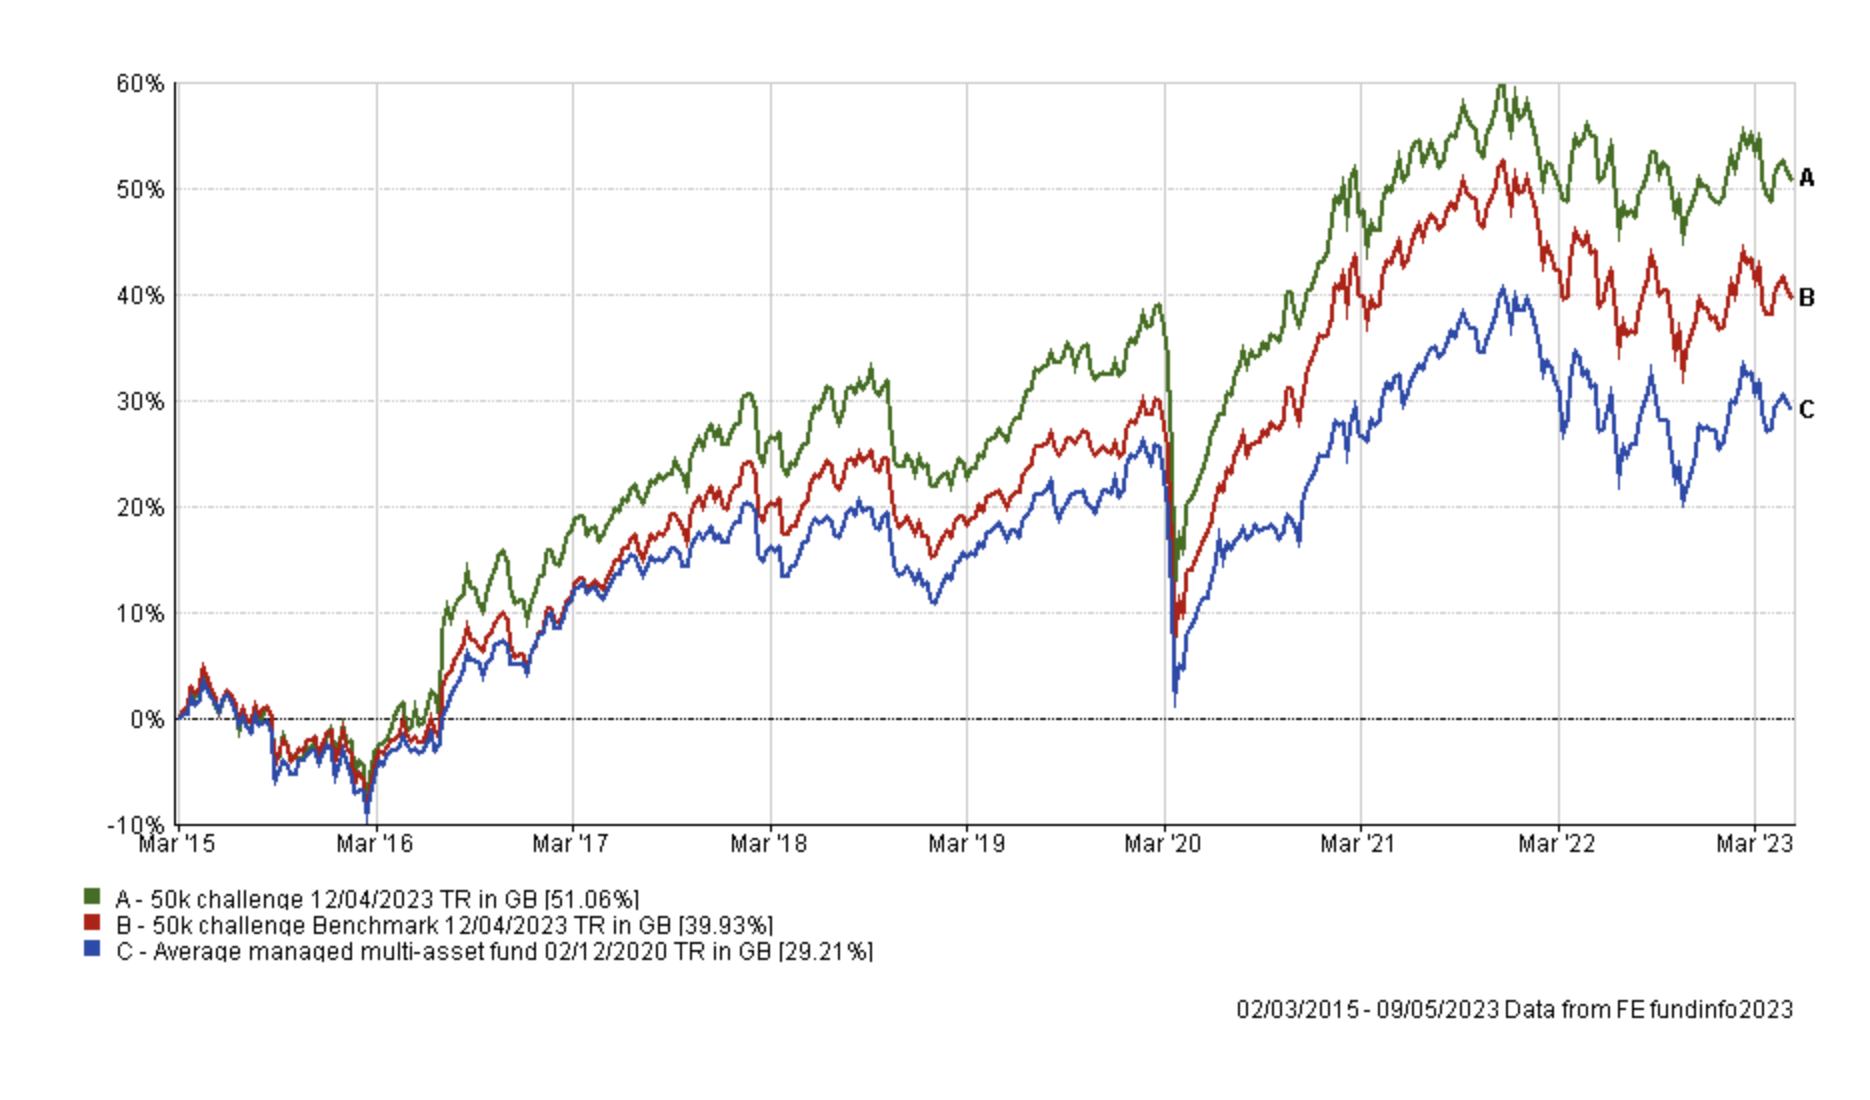
As the chart above shows, my portfolio continues to outperform its benchmarks over the last 8 years. My portfolio also rebounded from a disappointing March 2023 and has since performed in line with its benchmark but with less volatility.
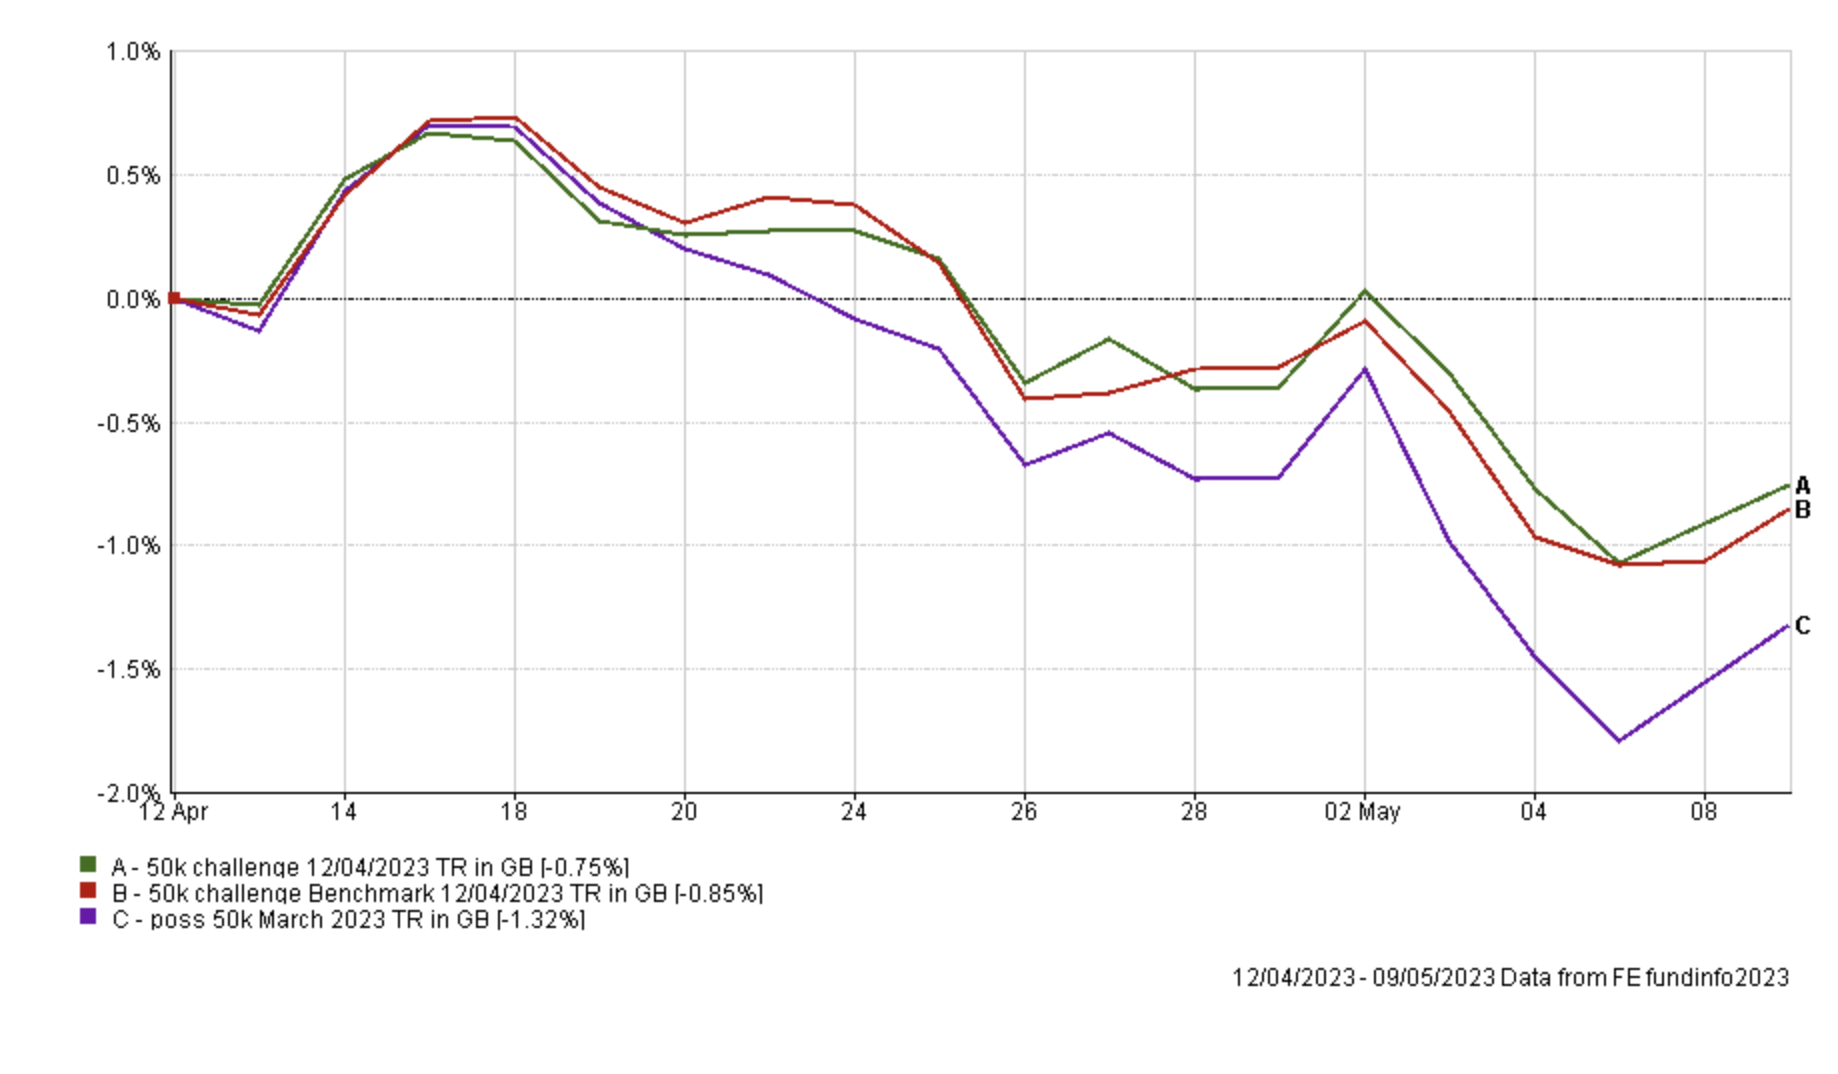
Interestingly, last time I made a number of changes to my portfolio to reduce its exposure to banking stocks. The chart below shows how my portfolio would have fared over the last month had I not made the changes (the purple line). You can see that making the changes gave a significant performance boost to my portfolio, which is obviously a great result.
The table below shows the individual performance of each fund in my portfolio between the 4th April (when I carried out my last review) up until 9th May. The standout performers were AXA Framlington UK Equity Income and CT European Select which were the new additions to my portfolio last time. They were then followed by Thesis TM Tellworth UK Select and BNY Mellon Global Income. At the other end of the scale the pound's continued strength against the US dollar once again hurt those funds with exposure to US bonds and equities. Invesco Asian Equity Income (UK) was the biggest underperformer.
|
Fund |
Performance since last review on 4th April (up to 9th May) |
| AXA Framlington UK Equity Income | 1.56 |
| CT European Select | 1.35 |
| Thesis TM Tellworth UK Select | 0.89 |
| BNY Mellon Global Income | 0.58 |
| abrdn High Yield Bond | 0.37 |
| iShares Physical Gold ETC | 0.22 |
| Jupiter Merlin Balanced Portfolio | -0.39 |
| M&G Global Dividend | -0.56 |
| TB Saracen Global Income & Growth | -1.15 |
| Invesco Global Bond (UK) | -1.5 |
| Jupiter Global Value Equity | -1.71 |
| Invesco Asian Equity Income (UK) | -2.96 |
Before I get into any fund changes I will make this month, as usual the table below shows which funds within my portfolio are in the current BOTB or BFBS tables and which are not. Those funds in blue are still in the BOTB while those in orange are not in the BOTB but remain in the BFBS list. Meanwhile, any funds in red have dropped out of both shortlists.
| Fund | Allocation | Risk | Sector | ISIN |
| abrdn High Yield Bond | 9 | Low | Sterling High Yield | GB00B79RR984 |
| AXA Framlington UK Equity Income | 5 | Medium | UK Equity Income | GB00B7KBNV36 |
| BNY Mellon Global Income | 6.5 | Medium | Global Equity Income | GB00B7XK5M25 |
| Cash | 7 | Low | ||
| CT European Select | 8.5 | High | Europe Excluding UK | GB00B8BC5H23 |
| Invesco Asian Equity Income (UK) | 5 | High | Asia Pacific Excluding Japan | GB00B4JR4R48 |
| Invesco Global Bond (UK) | 9 | Low | Global Bonds | GB00B3RW7B97 |
| iShares Physical Gold ETC | 5 | Medium | Commodity & Energy ETF | IE00B4ND3602 |
| Jupiter Global Value Equity | 10.5 | Medium | Global | GB00BF5DRF26 |
| Jupiter Merlin Balanced Portfolio | 12.5 | Medium | Mixed Investment 40-85% Shares | GB0031845141 |
| M&G Global Dividend | 7 | Medium | Global Equity Income | GB00B46J9127 |
| TB Saracen Global Income & Growth | 9.5 | Medium | Global Equity Income | GB00B5B35X02 |
| Thesis TM Tellworth UK Select | 5.5 | Low | Targeted Absolute Return | GB00BNY7YM73 |
The following funds have fallen out of the BOTB and BFBS tables and are coloured in red.
- Thesis TM Tellworth UK Select
- Jupiter Merlin Balanced Portfolio
- Jupiter Global Value Equity
- Invesco Global Bond (UK)
- BNY Mellon Global Income
I am happy with the current performance of my portfolio as a whole so I won't make drastic changes and remove all of the five funds listed above. Last month, I also placed three of the above funds on my watchlist namely Thesis TM Tellworth UK Select, Jupiter Merlin Balanced Portfolio and Invesco Global Bond (UK).
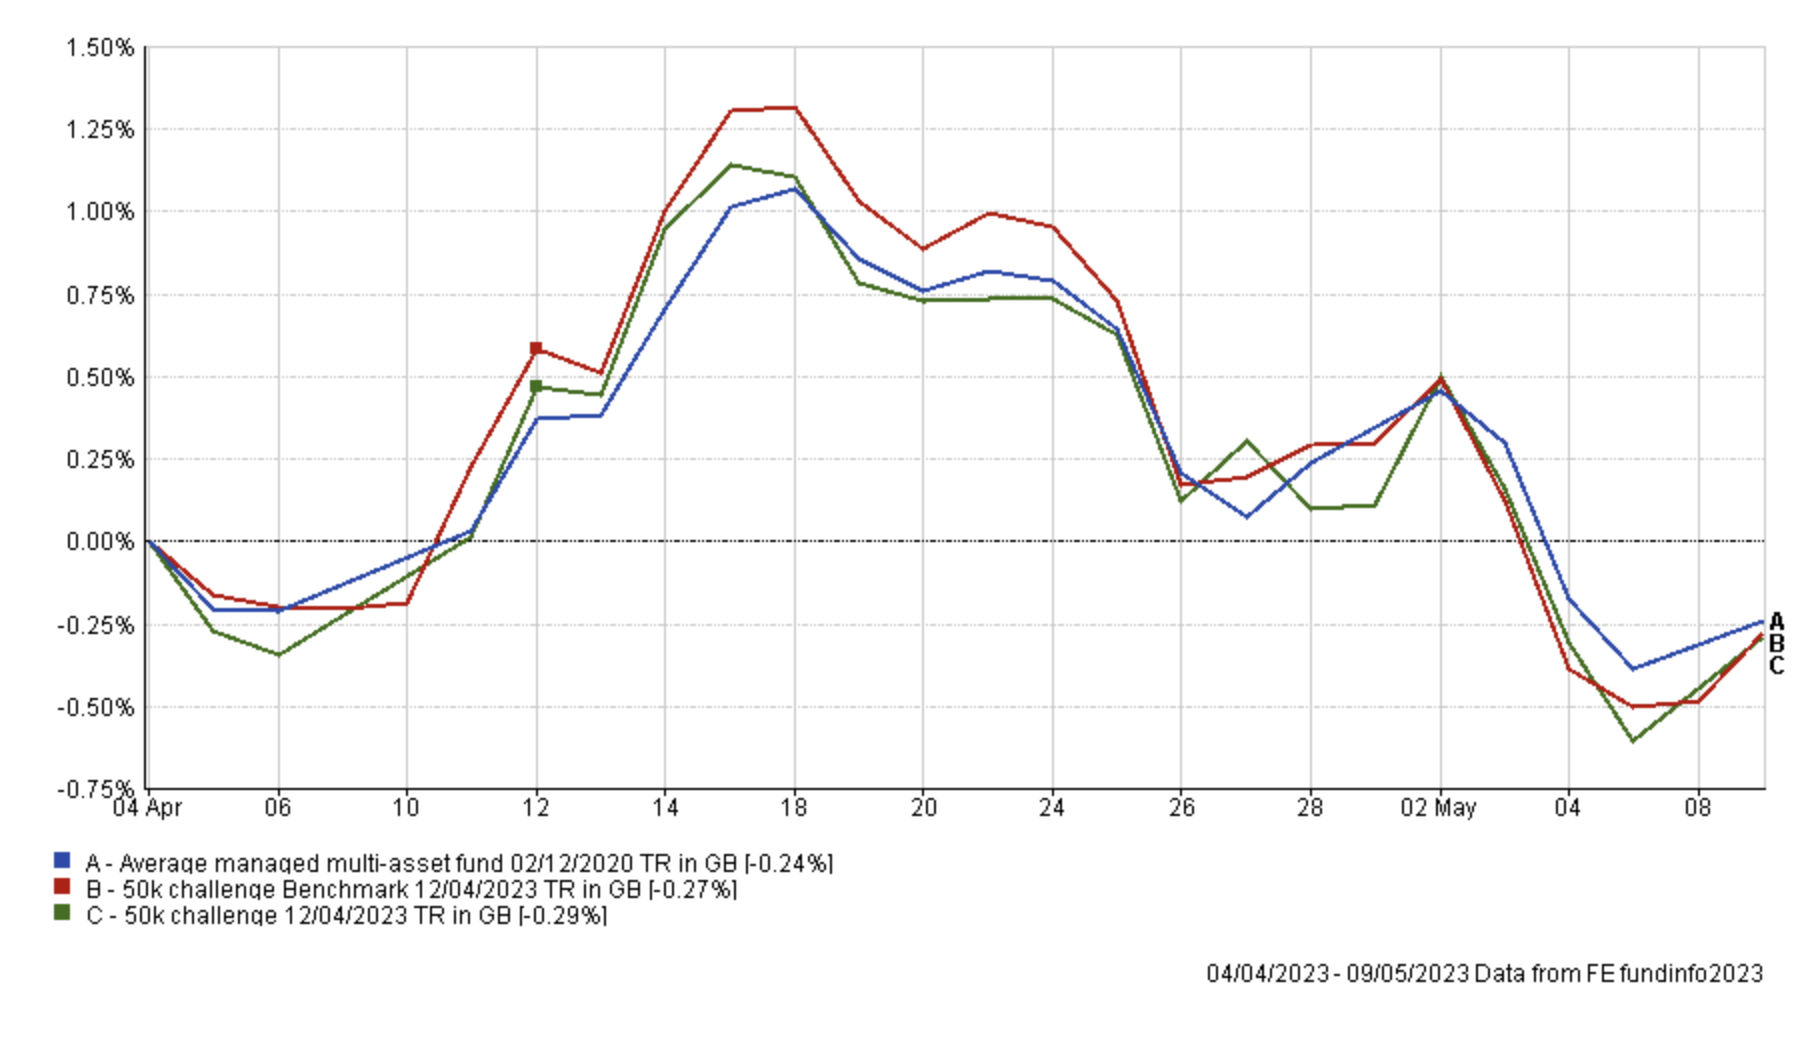
Of the three, Thesis TM Tellworth UK Select has turned the corner since my last review with it not only being one of the top performers in its sector but also across the entire bond/low risk space. While it is not a bond fund I make the comparison because when looking for low risk alternatives its recent performance stands out. While one month's performance isn't usually an overriding factor but as the chart below shows the performance versus the average from alternative sectors is significant.
So for now the fund remains on my watchlist with a further stay of execution.
Similarly, BNY Mellon Global Income was among the top performing equity funds within my portfolio over the last month and was in the BOTB as recently as April. So for now, I will maintain the fund within my portfolio and will review its inclusion next time.
That leads me onto the remaining funds in red, Jupiter Merlin Balanced Portfolio, Jupiter Global Value Equity and Invesco Global Bond (UK). All three happen to be among the largest holdings within my portfolio so have a significant influence on its overall performance, given that they account for almost one-third of the portfolio's assets.
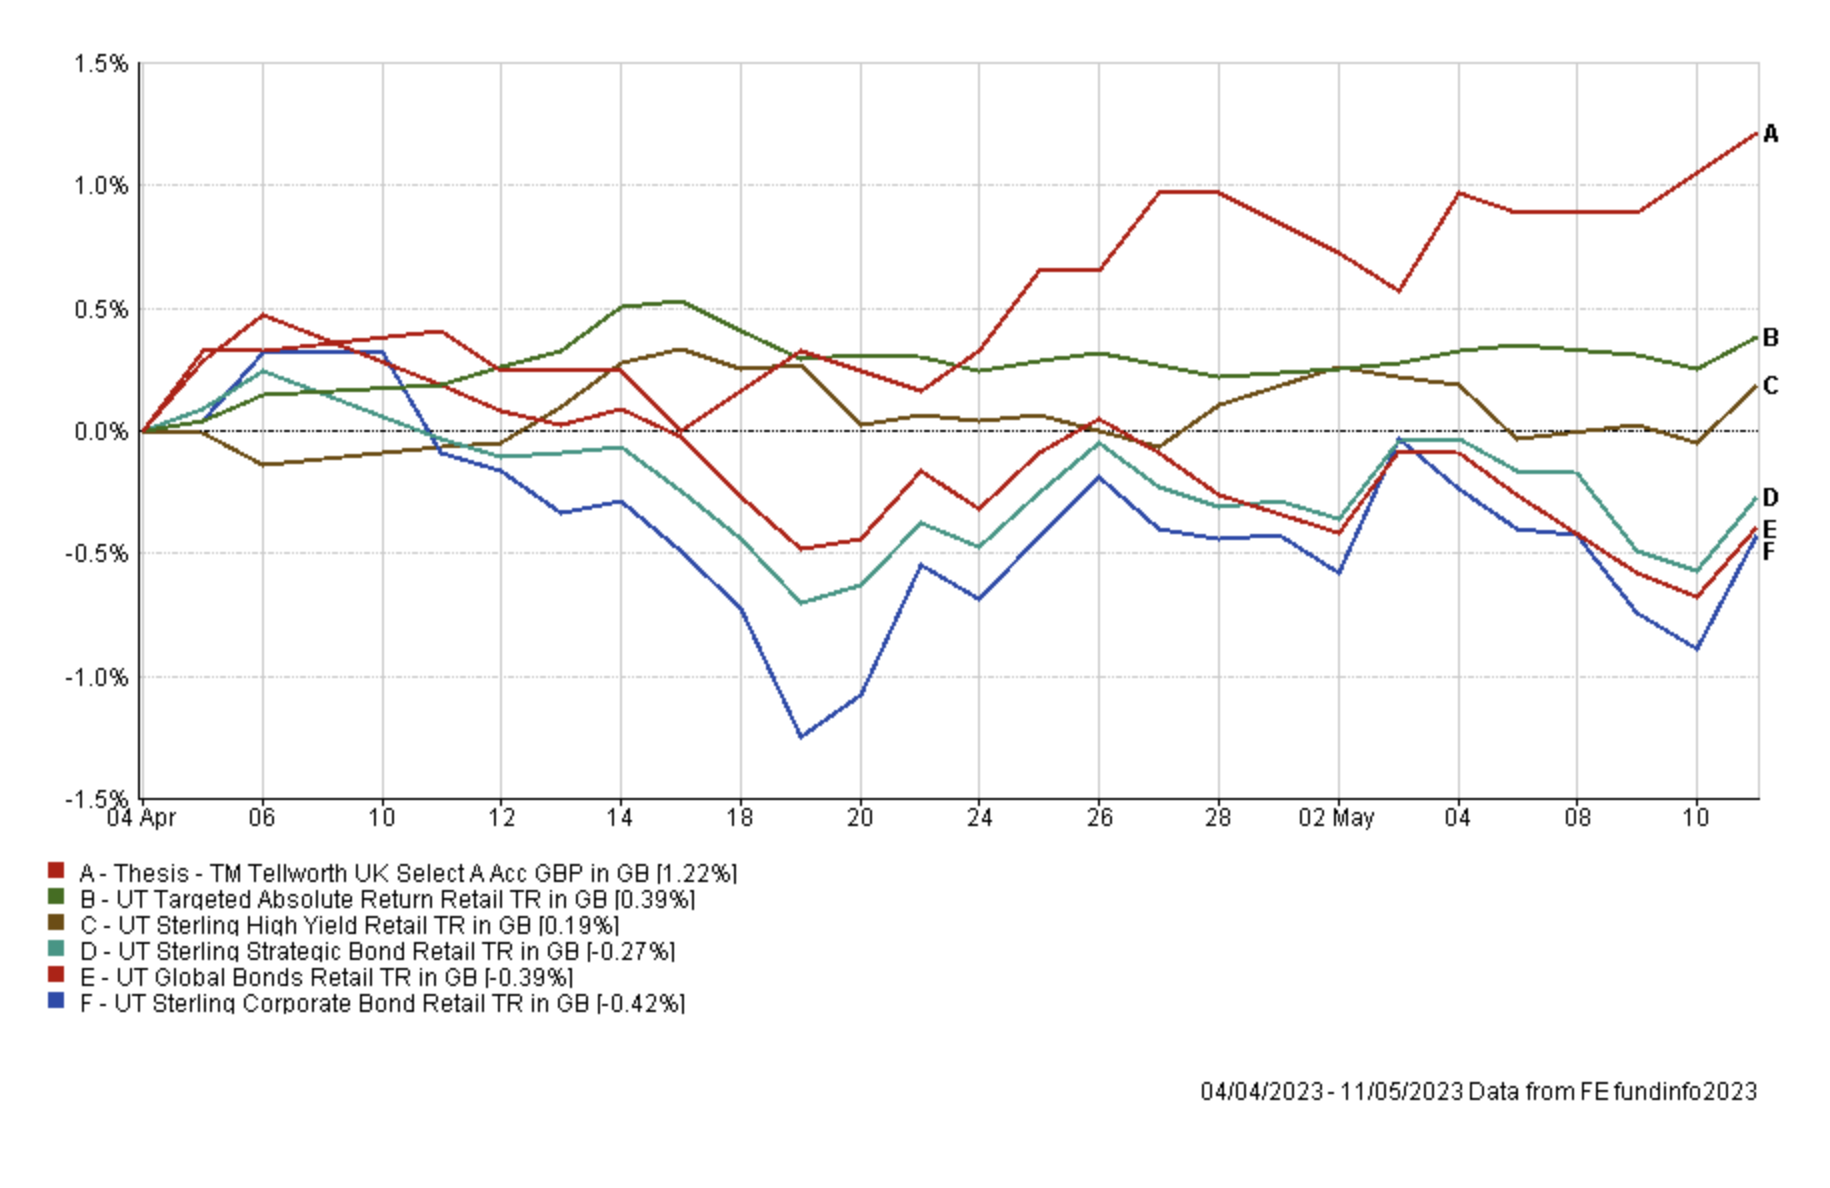
Jupiter Merlin Balanced Portfolio and Invesco Global Bond (UK) were among the top performers in my portfolio back in March but have struggled versus their respective peer groups since then. The Invesco Global Bond (UK) in particular has had a tough time of late, partly as a result of the weak US dollar. The chart below shows the performance of the fund (the black line) versus its sector average (the blue line) and the other bond fund within my portfolio (the pink line)
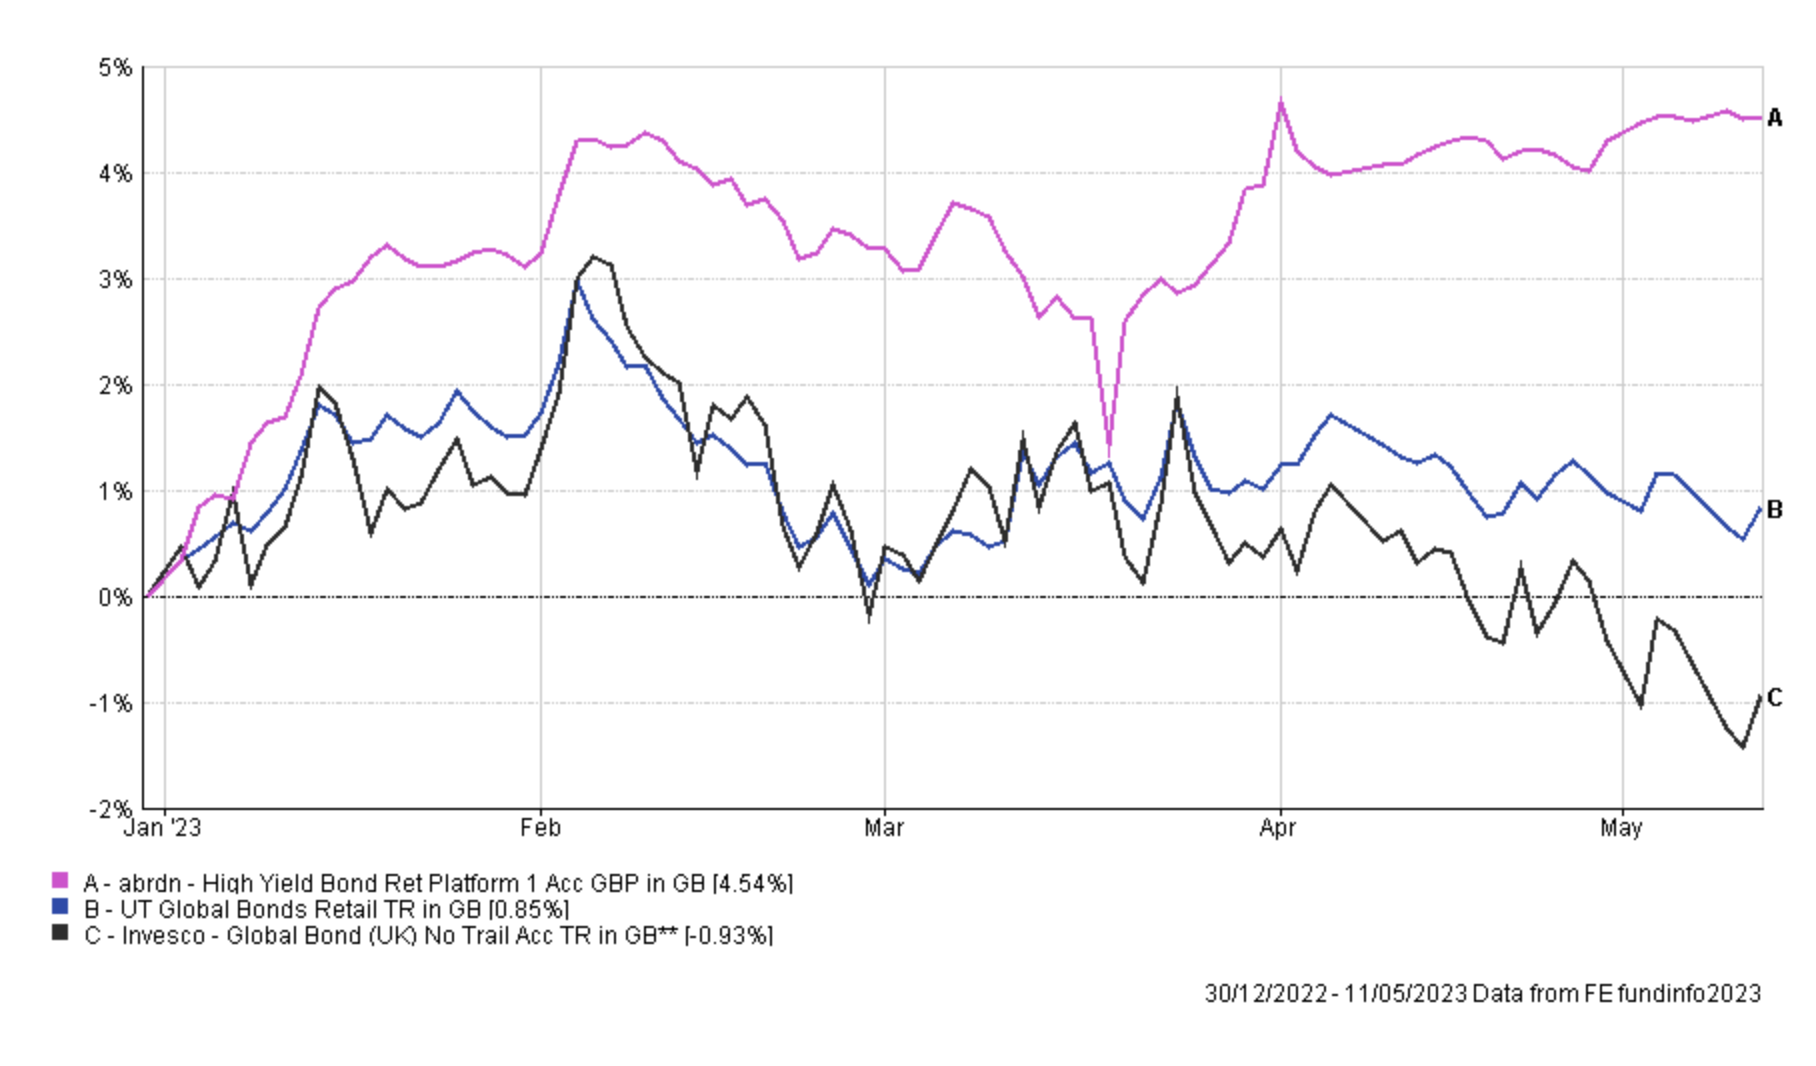
I will begin reducing my exposure to the Invesco fund and place the proceeds into my existing abrdn High Yield Bond, so essentially backing one of my recent winners.
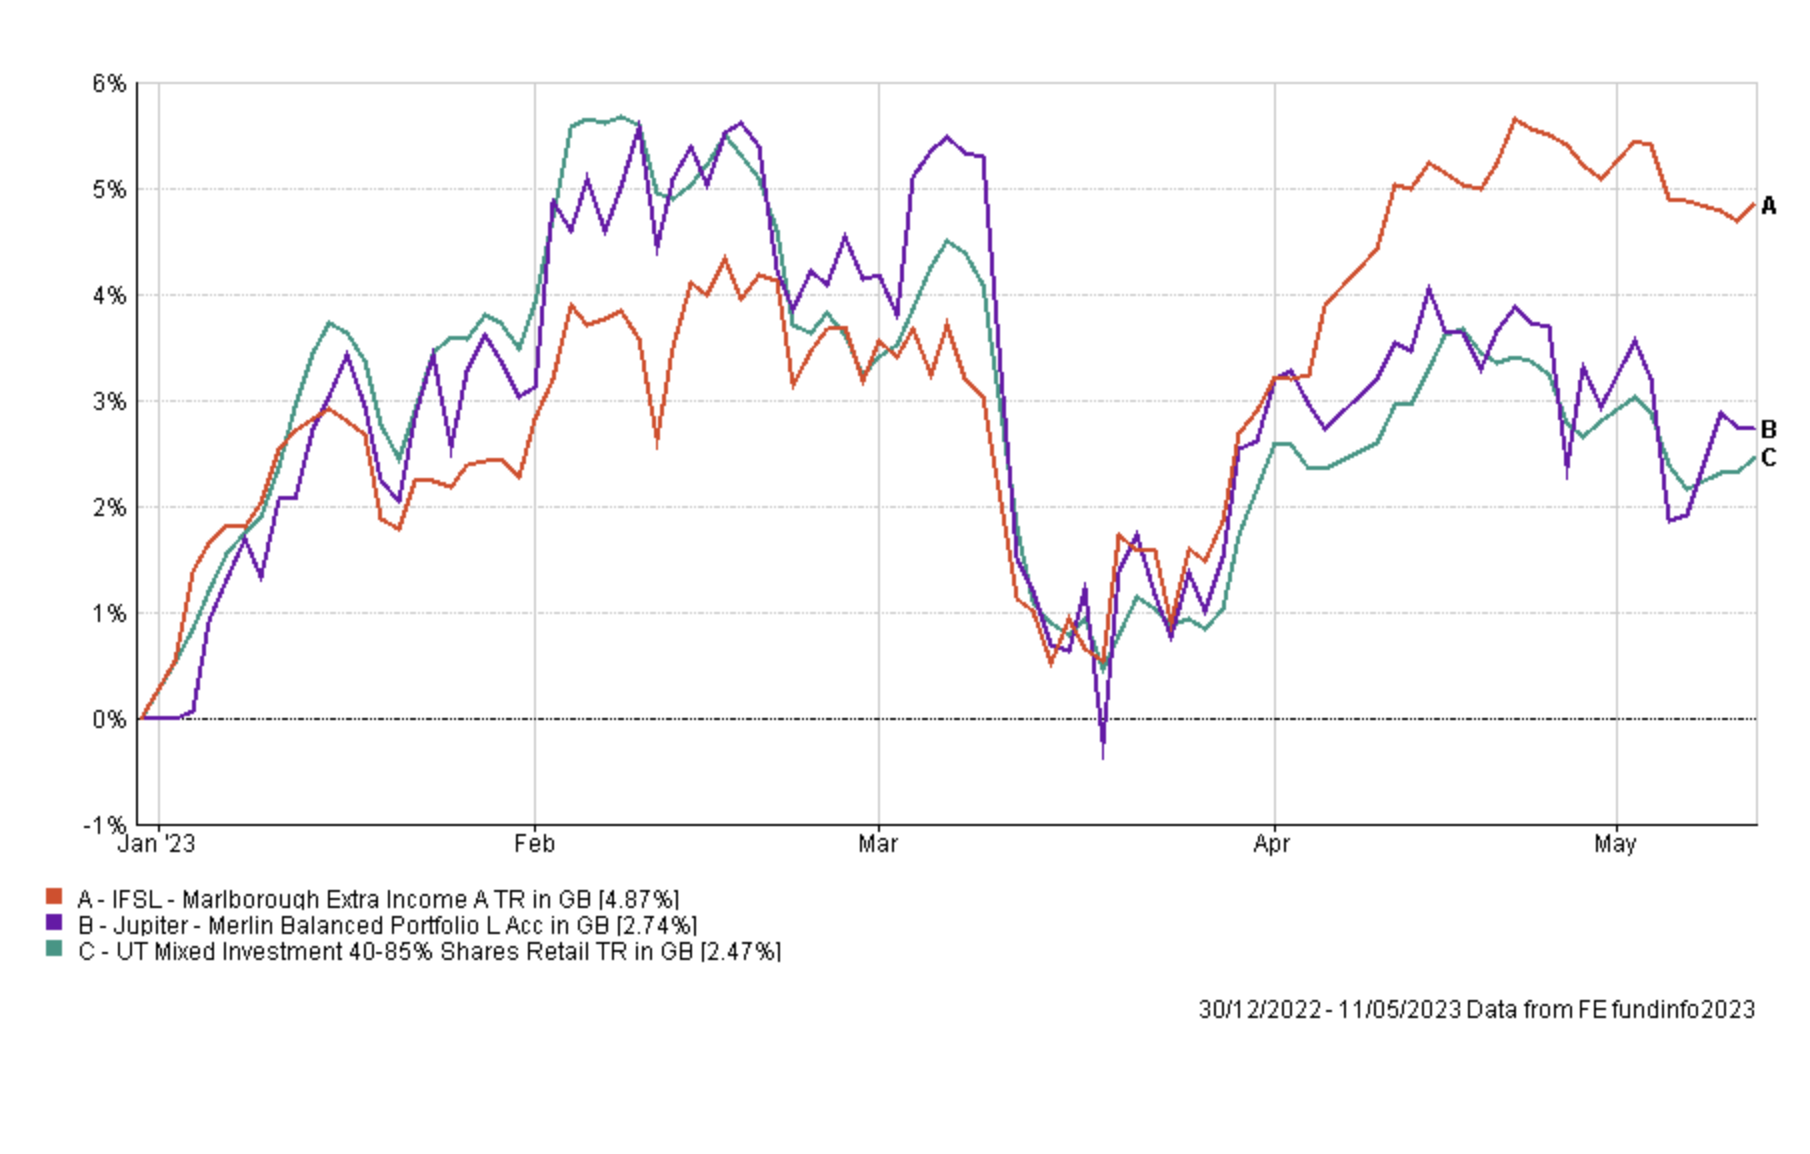
I plan to use a similar tactic with the Jupiter Merlin Balanced Portfolio, thus reducing my exposure to the fund in favour of another from the same sector which is in the BOTB, namely IFSL Marlborough Extra Income. The chart below shows the recent divergence in performance of these two funds and the lower level of volatility of IFSL Marlborough Extra Income.
The last of the funds that has fallen out of the BOTB and BFBS tables is Jupiter Global Value Equity. While last month the fund was in the BOTB its recent performance, especially during the banking crisis, has been underwhelming and has fallen behind the average of its peers.
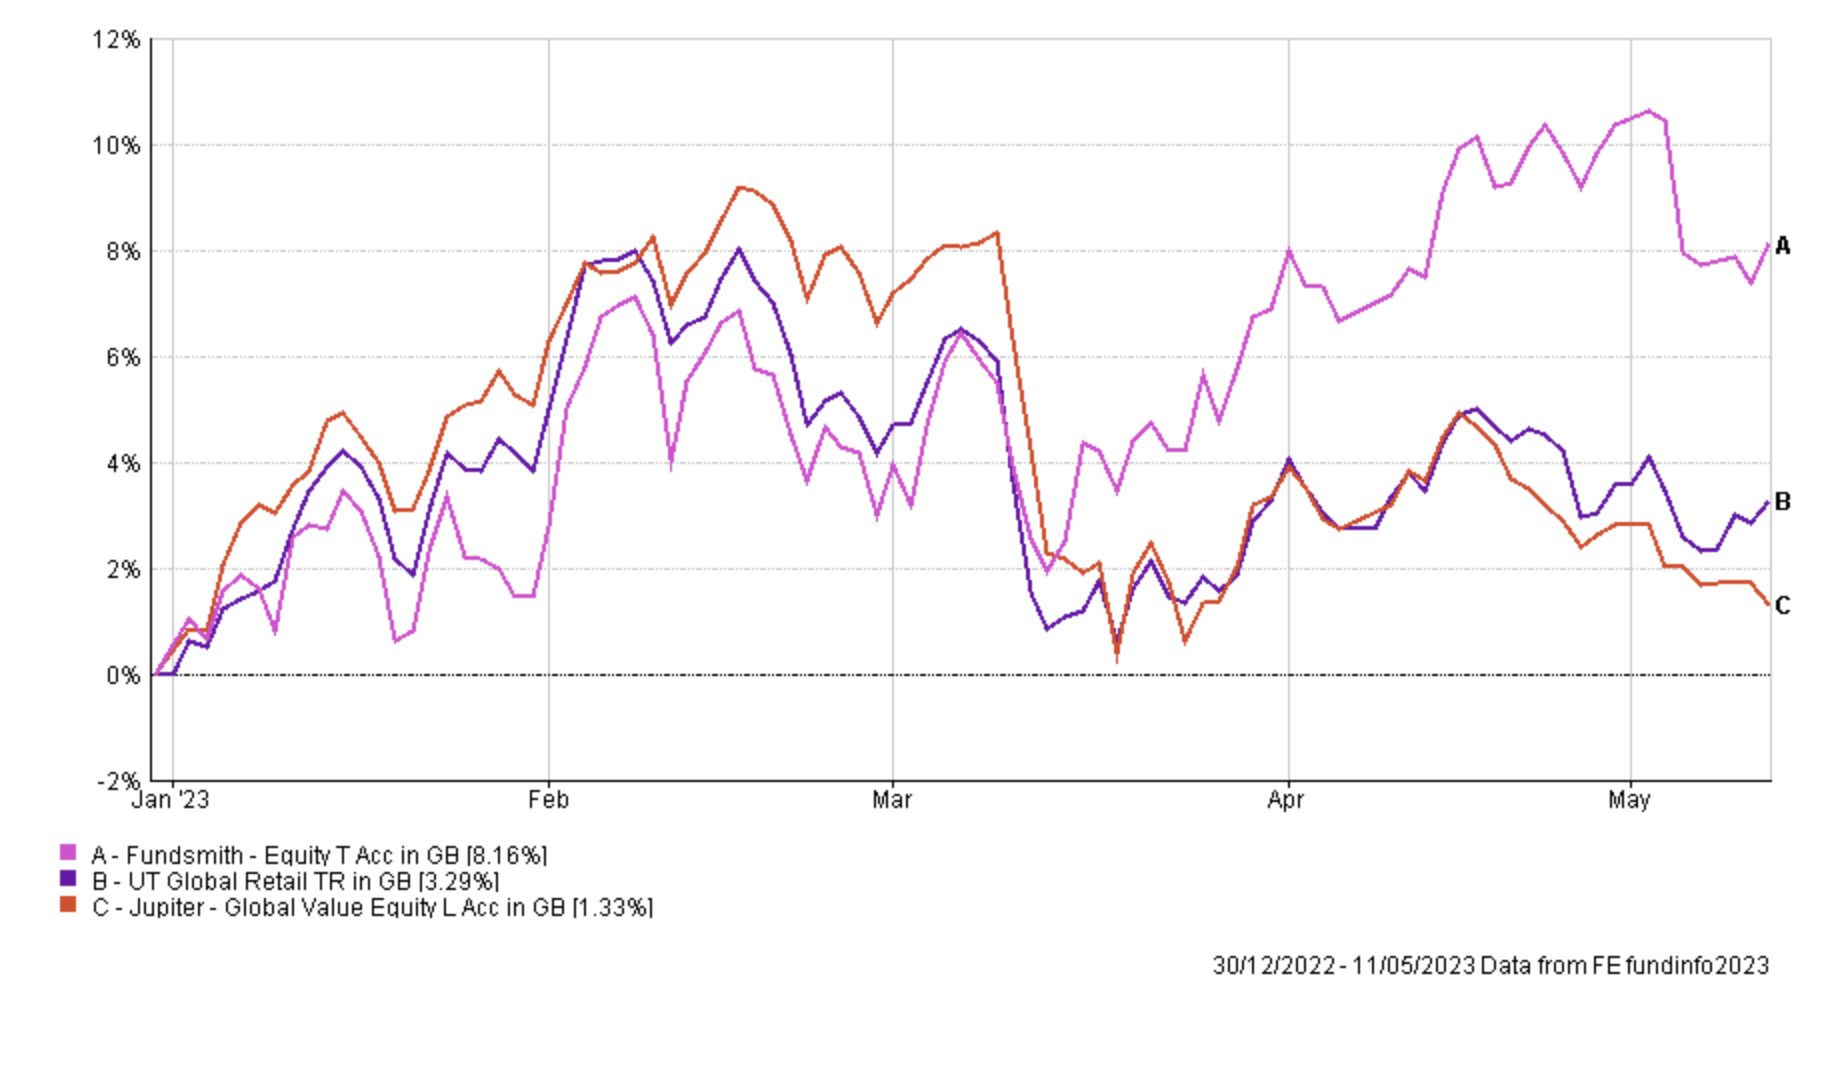
So by removing this fund I am also further reducing the portfolio's exposure to the risks associated with a renewed escalation in the banking crisis. On the chart above you will also see that I've added the Fundsmith Equity fund, which is a fund within this month's BOTB from the same sector. I plan to replace the Jupiter fund with the Fundsmith fund which also happens to perform better in the 'recession stress test' in the 80-20 Investor stress test tool. A potential recession remains a risk that continues to dog markets and while it is not a key driver for my decisions it is worth noting. The switch also increases my portfolio's US equity exposure above that of the BOTB and this is something I will review in the future.
The remaining funds within my portfolio are still in the BOTB or BFBS tables so for now I will maintain them in my portfolio. So in summary, the planned transactions impact around 20% of my portfolio and are mostly like-for-like swaps for funds that are in the same sector which are also in May's BOTB
Fund switches
- 50% out of Jupiter Merlin Balanced Portfolio and 100% into IFSL Marlborough Extra Income
- 100% out of Jupiter Global Value Equity and 100% into Fundsmith Equity
- 33% out of Invesco Global Bond (UK) and 100% into abrdn High Yield Bond
The fund changes increase the number of holdings within my portfolio by one but I will look to reduce this in the future. The switches also slightly increase my portfolio's equity exposure to 62% which is more in line with the BOTB.
My portfolio
My portfolio now looks like this:
| Fund | Allocation | Risk | Sector | ISIN |
| abrdn High Yield Bond | 12 | Low | Sterling High Yield | GB00B79RR984 |
| AXA Framlington UK Equity Income | 5 | Medium | UK Equity Income | GB00B7KBNV36 |
| BNY Mellon Global Income | 6.5 | Medium | Global Equity Income | GB00B7XK5M25 |
| Cash | 7 | Low | ||
| CT European Select | 8.5 | High | Europe Excluding UK | GB0001529345 |
| Fundsmith Equity | 10 | Medium | Global | GB00B4Q5X527 |
| IFSL Marlborough Extra Income | 6.5 | Medium | Mixed Investment 40-85% Shares | GB0005662894 |
| Invesco Asian Equity Income (UK) | 5 | High | Asia Pacific Excluding Japan | GB00B4JR4R48 |
| Invesco Global Bond (UK) | 6 | Low | Global Bonds | GB00B3RW7B97 |
| iShares Physical Gold ETC | 5 | Medium | Commodity & Energy ETF | IE00B4ND3602 |
| Jupiter Merlin Balanced Portfolio | 6.5 | Medium | Mixed Investment 40-85% Shares | GB0031845141 |
| M&G Global Dividend | 7 | Medium | Global Equity Income | GB00B46J9127 |
| TB Saracen Global Income & Growth | 9.5 | Medium | Global Equity Income | GB00B5B35X02 |
| Thesis TM Tellworth UK Select | 5.5 | Low | Targeted Absolute Return | GB00BNY7YM73 |
My Portfolio asset mix
My portfolio asset mix has around 62% exposure to equities. Last month's figures are shown in brackets.
-
- UK Equities 19% (19%)
- North American Equities 17% (13%)
- Asian/Emerging Market Equities 4% (5%)
- Japanese Equities 0% (0%)
- European Equities 19% (19%)
- Chinese equities 0% (0%)
- Other equity 3% (4%)
- Commodities and energy 5% (5%)
- UK Fixed Interest 0% (0%)
- Global Fixed Interest 17% (17%)
- Cash 7% (7%)
- Alternative Investment Strategies 9% (11%)
- Property 0% (0%)
Damien's higher risk and lower risk portfolios
Using the logic described in my post: Update to Damien’s alternative risk portfolios I created hypothetical higher and lower risk versions of my portfolio below:
Lower risk
| Fund | Allocation % |
| abrdn High Yield Bond | 14 |
| AXA Framlington UK Equity Income | 6 |
| BNY Mellon Global Income | 8 |
| Cash | 8 |
| Fundsmith Equity | 11 |
| IFSL Marlborough Extra Income | 8 |
| Invesco Global Bond (UK) | 7 |
| iShares Physical Gold ETC | 6 |
| Jupiter Merlin Balanced Portfolio | 8 |
| M&G Global Dividend | 8 |
| TB Saracen Global Income & Growth | 10 |
| Thesis TM Tellworth UK Select | 6 |
Higher risk
| Fund | Allocation % |
| AXA Framlington UK Equity Income | 8 |
| BNY Mellon Global Income | 10 |
| CT European Select | 12 |
| Fundsmith Equity | 14 |
| IFSL Marlborough Extra Income | 9 |
| Invesco Asian Equity Income (UK) | 7 |
| iShares Physical Gold ETC | 7 |
| Jupiter Merlin Balanced Portfolio | 9 |
| M&G Global Dividend | 10 |
| TB Saracen Global Income & Growth | 14 |

Book a free financial review
Looking to ensure your finances are on track? Our partner Unbiased will arrange for a qualified, FCA-regulated adviser to contact you
- Discuss your financial situation
- Identify what steps, if any, you should take
- Free and without obligation
