

The background to my portfolio
Back in March 2015 I decided to invest £50,000 of my own money using 80-20 Investor. The purpose was twofold, firstly to show how you can use 80-20 Investor to invest and outperform the market with only a few minutes effort every now and then. Secondly, no other investment commentator, journalist or research provider invests their own money for fear of failing. This is a sorry state of affairs and is precisely why I committed to openly running my own portfolio for 80-20 Investor members to see.
Since then I have periodically changed my portfolio using the fund suggestions provided by the 80-20 Investor algorithm and associated research. I always disclose the changes at the time they are made.
Performance update
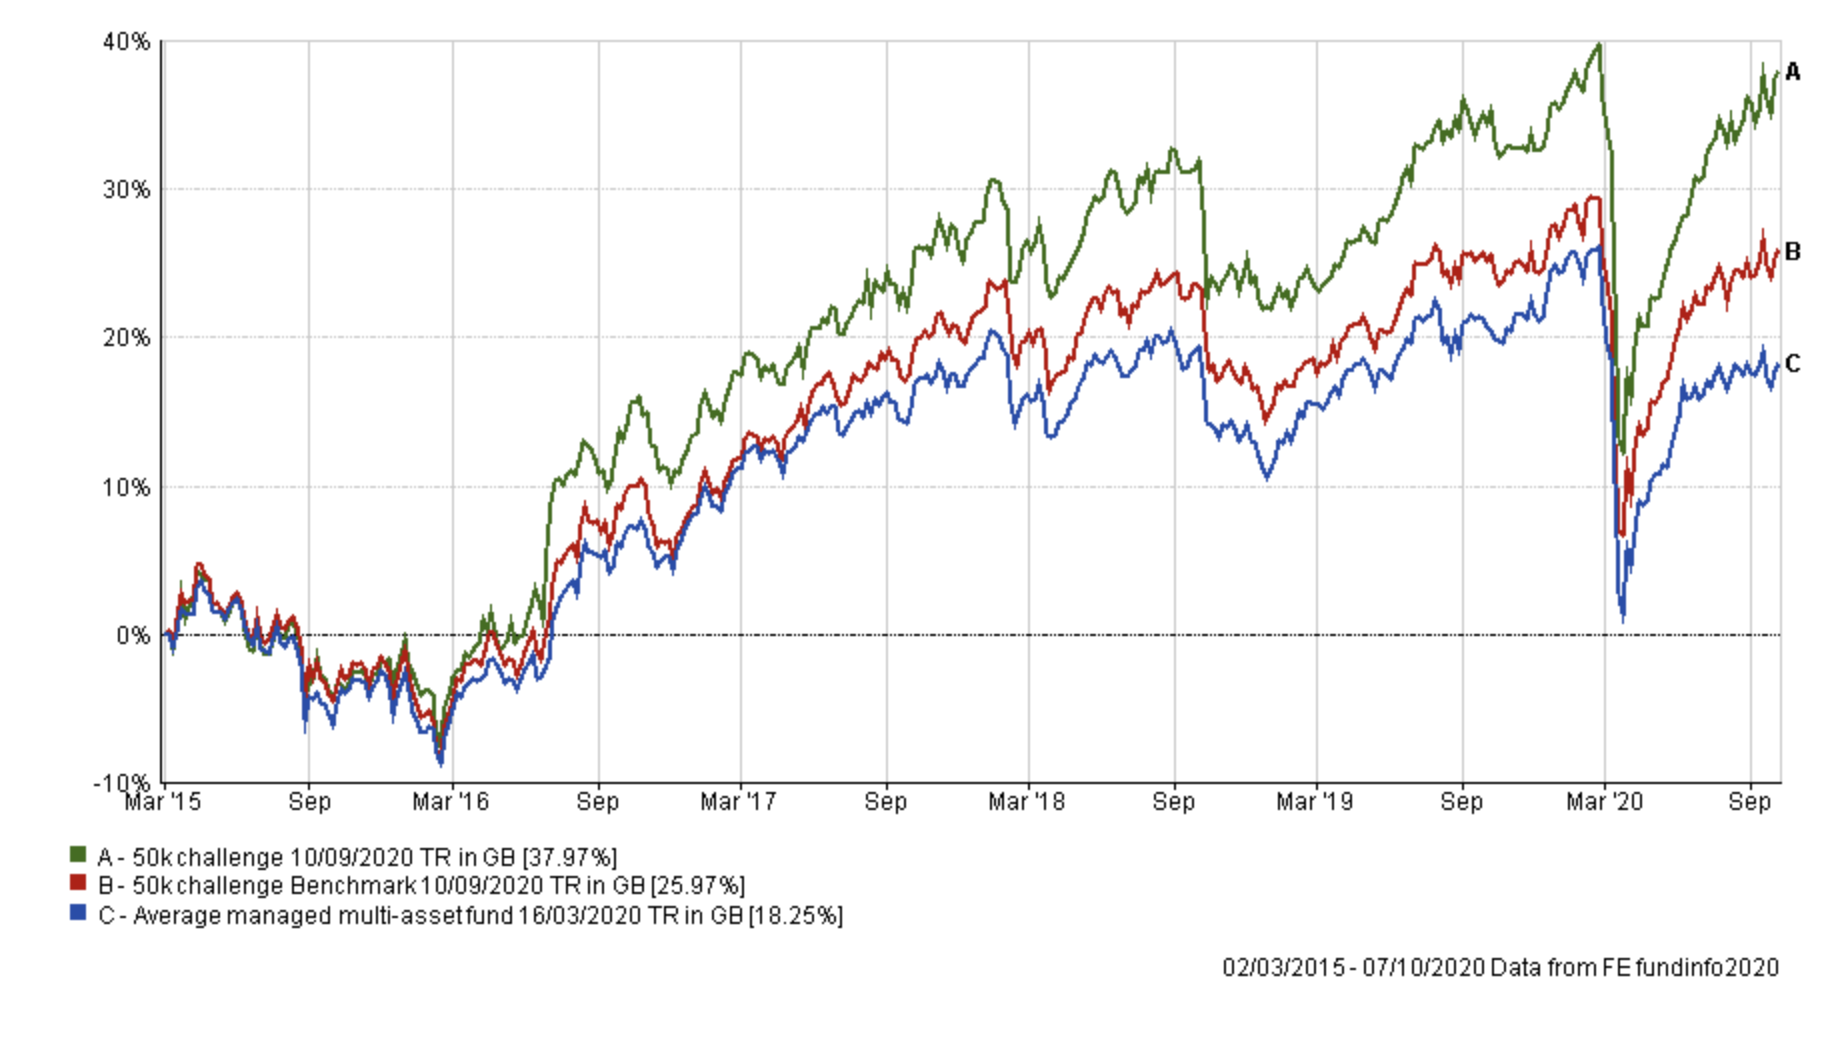
As is usual in my portfolio reviews, the chart below shows how my portfolio has outperformed since I started the challenge in March 2015, which is over five years ago. The green line is the performance of my portfolio while the red line is the benchmark showing the average return achieved by professional fund managers given the same asset mix. To accurately calculate this I have used the average return for each sector in which my portfolio invested. The blue line shows what the average multi-asset fund with comparable equity content achieved. In other words, the red line would show the extra performance added by just the asset mix of my portfolio (where I was invested i.e European equities etc) over picking a typical multi-asset fund (the blue line). While the green line (which is my actual performance) shows the impact of being in the right funds at the right time, as identified by the 80-20 Investor algorithm.
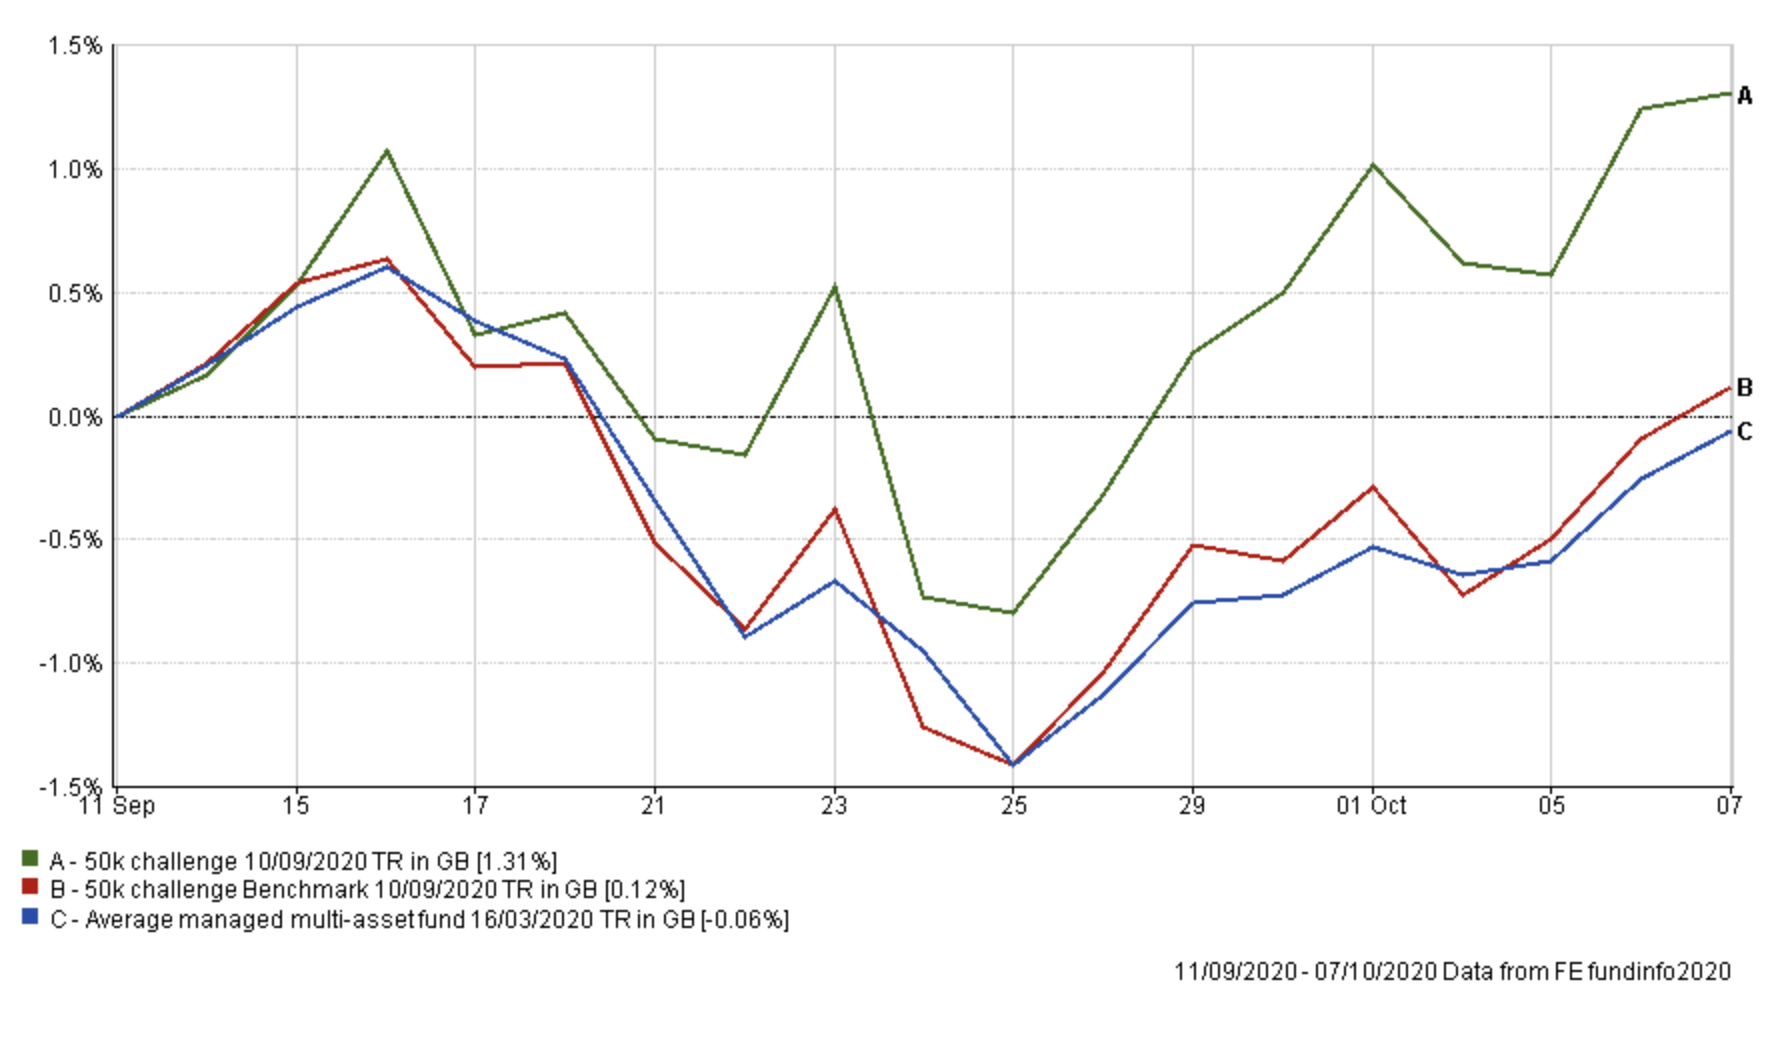
You can see how my portfolio has rebounded to once again extend its lead over its benchmarks since my last portfolio review. The chart below shows the portfolio's performance since my last review.
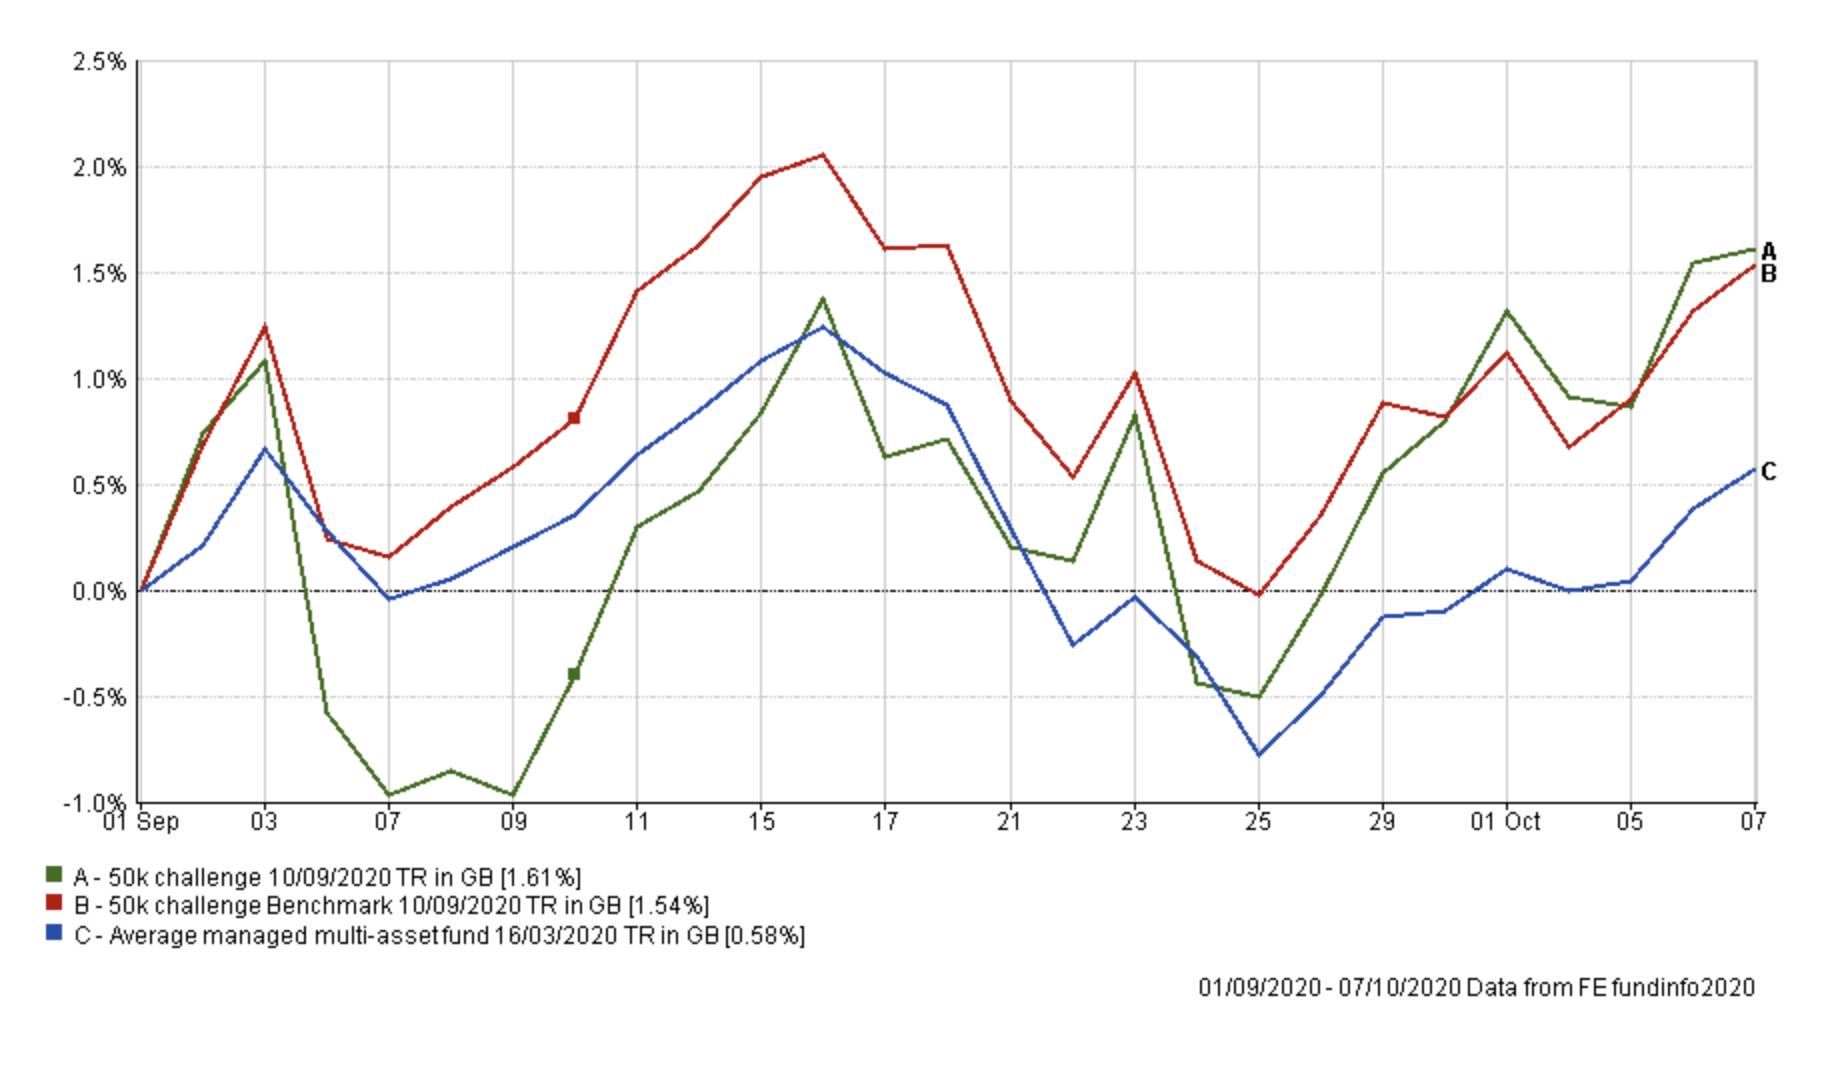
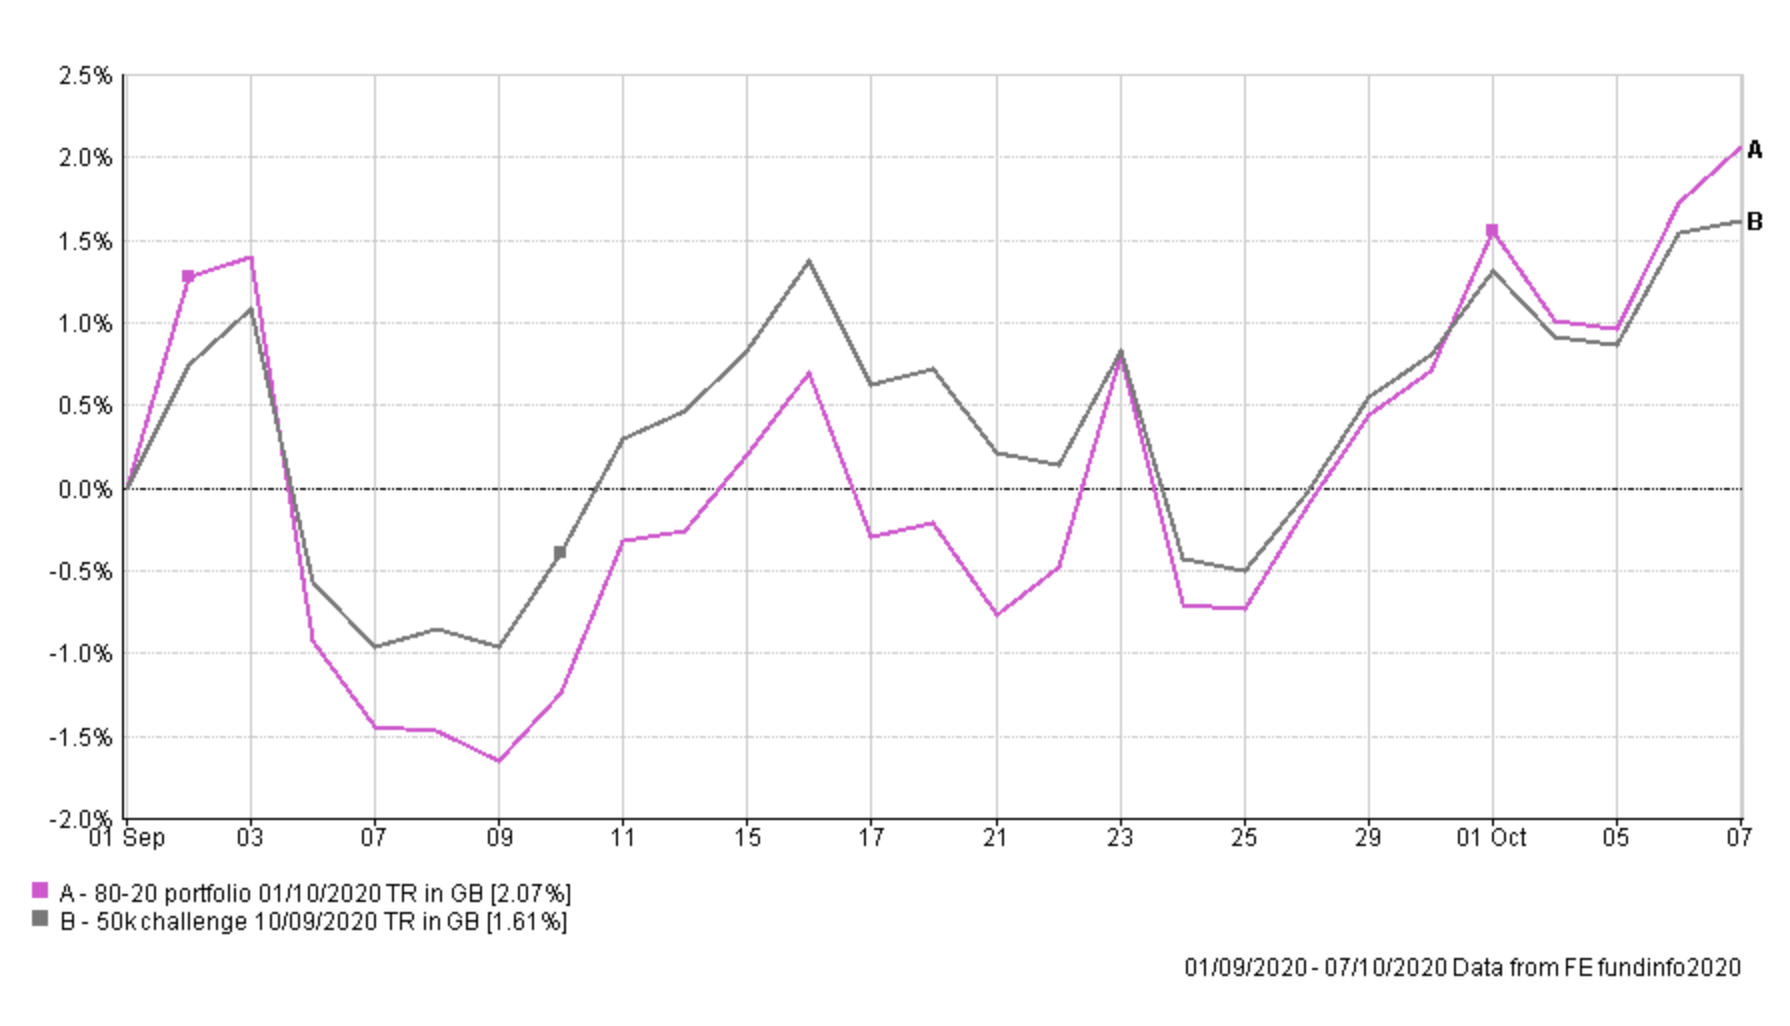
If you recall, my portfolio had a dip in performance at the start of September when technology stocks stumbled. The chart below shows the performance since the start of September to highlight how my portfolio recouped the losses it made during the tech sell-off.
Last time I wrote about how the sell-off highlighted certain correlations within my portfolio, particularly in the funds that at the time were proving a drag on my portfolio. However, the 80-20 Investor algorithm screening process still highlighted the momentum that the aforementioned funds had, despite the pullback. I raised the question as to whether the pullback would be short-lived or whether we were seeing the beginning of a significant change in the direction of markets? I decided to not alter my portfolio and wait for the storm to pass. It turned out to be a short-lived storm which explains the rebound in my portfolio. Of course, that is not to say that there won't be a repeat, especially with the US election coming up and a second coronavirus wave underway.
In any event, as is the routine in my portfolio reviews, the table below shows which funds within my portfolio are in the current BOTB or BFBS tables and which are not. Those funds in green are still in the BOTB while those in orange are not in the BOTB but remain in the BFBS list. Meanwhile, any funds in red have dropped out of both shortlists.
| Name | Allocation % (rounded) | Risk | Sector | ISIN Code |
| Baillie Gifford European | 5 | High | Europe Excluding UK | GB0006058258 |
| Schroder Global Healthcare | 7.5 | Medium | Global | GB00B76V7Q08 |
| Baillie Gifford Long Term Global Growth Investment | 9 | High | Global | GB00BD5Z0Z54 |
| VT Gravis Clean Energy Income | 5.5 | Medium | Global | GB00BFN4H792 |
| Premier Diversified Growth | 9 | Medium | Mixed Investment 40-85% Shares | GB00B8BJV423 |
| Royal London UK Government Bond | 15 | Medium | UK Gilts | GB00B881TW52 |
| Allianz Strategic Bond | 16.5 | Low | Sterling Strategic Bond | GB00B06T9362 |
| Troy Asset Management Ltd Trojan Ethical | 10.5 | Medium | Flexible Investment | GB00BJP0XX17 |
| Baillie Gifford Positive Change | 5.5 | High | Global | GB00BYVGKV59 |
| Liontrust Sustainable Future Cautious Managed | 5 | Medium | Mixed Investment 40-85% Shares | GB00BMN90304 |
| iShares Physical Gold ETC | 5.5 | Medium | Commodity & Energy ETF | - |
| Allianz Total Return Asian Equity | 3 | Medium | Asia Pacific Excluding Japan | GB00B1FRQV53 |
| JPM Japan | 3 | Medium | Japan | GB00B1XMTP77 |
If you are observant you might notice that the above table (and colour coding) remains identical to that published in September's portfolio review. That is to say that the 5 funds that did not make it into September's BOTB or BFBS tables have not made it into October's either.
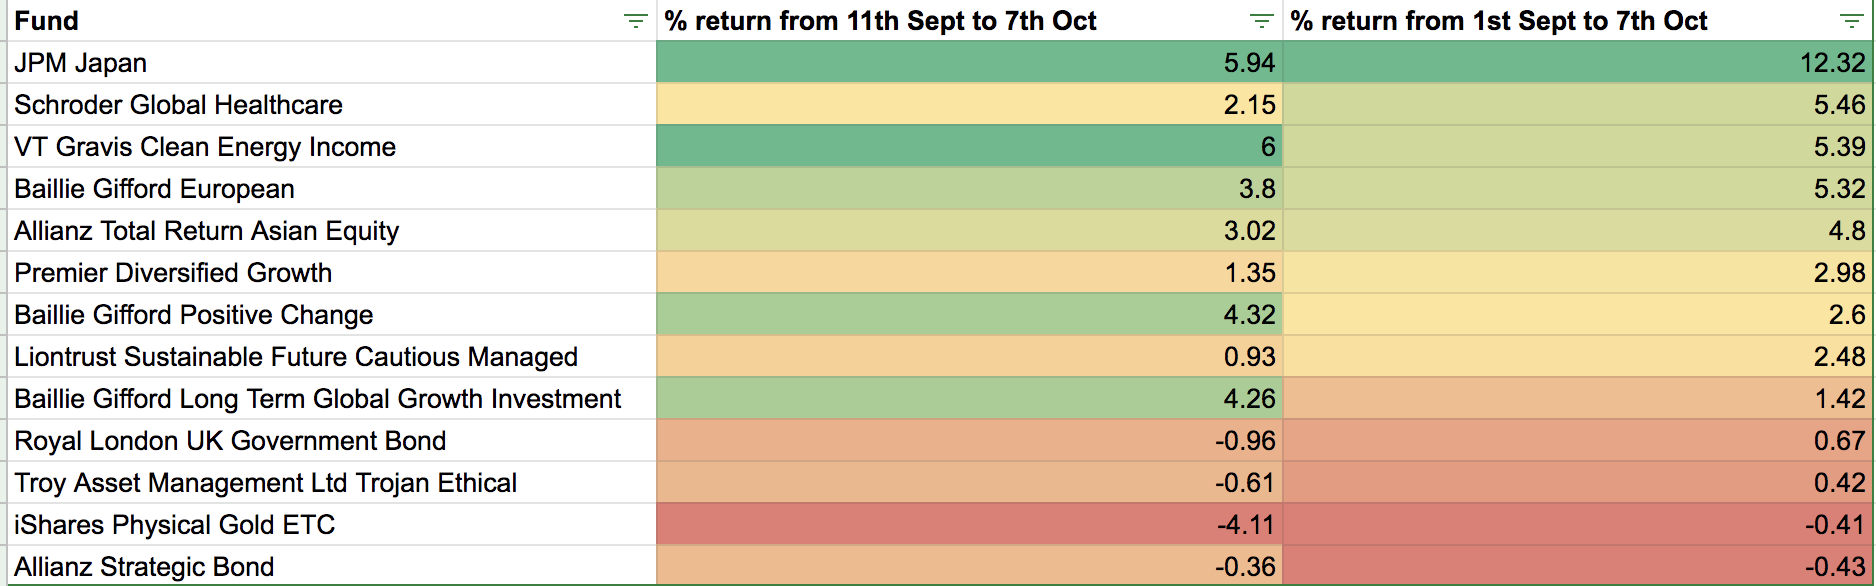
Yet once again, if you look at the performance of these 5 funds they have been among the best performers since the start of September. In fact, VT Gravis Clean Energy Income was the best performing fund during the period, which is interesting as it was the one fund I was looking to remove last time around. But in light of my research article 'Ethical funds: do they now deserve a place in your portfolio?' it shouldn't be surprising.
It means that as I review my portfolio this month there is a sense of déjà vu about proceedings. Go back to September's review and the position is almost the same. I have the same funds highlighted by the 80-20 Investor algorithm as having medium term momentum, while the same 5 funds are omitted. But yet again these 5 have been among the strongest performers over the short term.
We are also once again seeing what we saw heading into September, strength in equity funds especially those exposed to technology stocks (such as Baillie Gifford Long Term Global Growth Investment) while gilts and bonds lag. Also, the equity content of my portfolio sits at 48%, while the BOTB sits at 60% with its asset mix almost unchanged. There is also heightened volatility in equity markets, as illustrated in the earlier performance charts. It definitely feels like we've been here before.
With potential market-moving events on the horizon (Brexit talks and the US election being two such events) I am once again loathed to make any changes, due to the increased volatility we are experiencing. The trends that threatened my portfolio at the start of September subsided, which meant that holding my nerve paid dividends. Of course, there is no telling what will happen in the coming weeks. But as I wrote last month "with volatility still elevated swapping funds for whatever reason during a period such as this would be akin to disembarking one ship and boarding another out in a stormy sea. There is no telling whether the outcome would be positive or a complete disaster, as markets could move for or against you very quickly".
Also I would normally consider increasing the equity exposure of my own portfolio to be more in line with the BOTB (now at 60% versus 48% for my portfolio), perhaps looking to reduce my exposure to technology stocks which have had a fantastic run. But with my portfolio's concentrated exposure to US equities and technology stocks I think it prudent to offset this by again maintaining my portfolio's overall equity exposure as it is for now (i.e. lower than that of the BOTB's 60% right now). That means maintaining my gilt exposure too, but as my recent research piece identified it is a good diversifier for my US tech holdings. As the chart below shows, having a lower equity exposure than the BOTB over the last two months has not hindered my £50k portfolio.
With a sense of déjà vu it therefore seems that the most sensible choice is to follow the course of action that proved successful last time around, which is to do nothing for now.
My Portfolio asset mix
My portfolio asset mix is as shown below which is now around 48% equities which is still 5% less than I had before the coronavirus sell-off. Also the asset mix remains unchanged from last month (shown in brackets):
-
- UK Equities 5% (5%)
- North American Equities 20% (20%)
- Global Fixed Interest 23% (23%)
- Japanese Equities 4% (4%)
- European Equities 11% (11%)
- UK Fixed Interest 0% (0%)
- UK Gilt 13% (13%)
- Cash 4% (4%)
- Alternative Investment Strategies 7% (7%)
- Asian Equities 3% (3%)
- Emerging Market Equities 3% (3%)
- Commodities and energy 7% (7%)
- Property 0% (0%)
Damien's higher risk and lower risk portfolios
Using the logic described in my post: Update to Damien’s alternative risk portfolios I created hypothetical higher and lower risk versions of my portfolio below:
Higher risk
| Name | Allocation % |
| Baillie Gifford European | 6 |
| Schroder Global Healthcare | 9 |
| Baillie Gifford Long Term Global Growth Investment | 9.5 |
| VT Gravis Clean Energy Income | 7 |
| Premier Diversified Growth | 11.5 |
| Royal London UK Government Bond | 18 |
| Troy Asset Management Ltd Trojan Ethical | 13 |
| Baillie Gifford Positive Change | 6 |
| Liontrust Sustainable Future Cautious Managed | 6 |
| iShares Physical Gold ETC | 6 |
| Allianz Total Return Asian Equity | 4 |
| JPM Japan | 4 |
Lower risk
| Fund | Allocation % |
| Schroder Global Healthcare | 9.5 |
| VT Gravis Clean Energy Income | 7 |
| Premier Diversified Growth | 11 |
| Royal London UK Government Bond | 18.5 |
| Allianz Strategic Bond | 20.5 |
| Troy Asset Management Ltd Trojan Ethical | 13 |
| Liontrust Sustainable Future Cautious Managed | 6 |
| iShares Physical Gold ETC | 6.5 |
| Allianz Total Return Asian Equity | 4 |
| JPM Japan | 4 |

£200 Pension Cashback Offer
Make a qualifying deposit or transfer a pension to our partner Interactive Investor.
- Deposit or transfer a pension of at least £20k and you could earn £200 cashback
- Terms and Fees apply, Capital at risk
- New & Existing customers opening a SIPP
- Offer ends 31st July 2026
Before starting your transfer, check you won't lose any valuable benefits (such as guaranteed annuity rates or a lower protected pension age) and find out what exit fees you might have to pay
