


Is it any wonder then that the average managed fund manager is sitting on a loss since I started the exercise in March? So how have I fared?
Outperforming 87% of fund managers
The chart below gives you a warts and all summary of how my portfolio (the blue line) has outperformed the market (the black line) and the average fund manager (red & green lines). Click the image to enlarge it. The comparable managed funds reside in the two Mixed Investments sectors shown. My portfolio's asset mix would usually lie somewhere between the two of these sectors.
As you can see, not only have I outperformed the market and the typical fund manager but I'm sitting on a profit despite all those aforementioned market events! In fact my portfolio has outperformed 87% of fund managers. Yet I don't have an army of analysts or millions of pounds to spend on research. I've just spent a few minutes of my time every month reviewing my funds using 80-20 Investor.
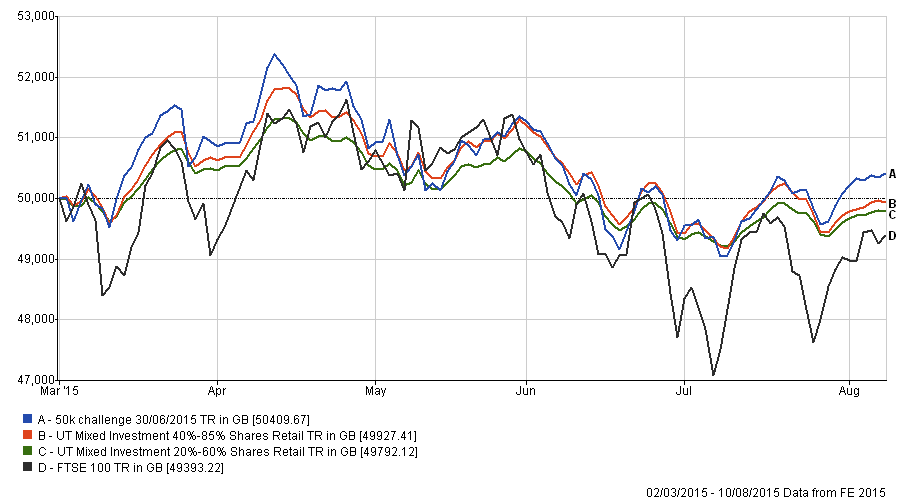
Don't forget that my portfolio's result is net of all charges, including investment platform charges. The figures for the average fund managers and the FTSE 100 don't take into account investment platform charges. Or in other words the chart above overstates the returns achieved by the market and the typical fund manager. So I'm even giving them a head start.
Yet as I always say, humility is important and this is a long term project so we don't want to obsess over short term wins.
The glass didn't break
There is a valuable lesson to be learned from the portfolios performance so far. You may recall that when the Greek debt crisis erupted I wrote a piece titled The best strategy in a stock market crash – Stick or Twist? The findings suggested that often in a market sell off the best thing to do is stay invested.
Also you may recall that at the height of the crisis I wrote in one of my weekly notes (you can read it in full here) that investment markets can be like trying to catch a falling glass. Often no matter what you do you will make things worse with a knee-jerk reaction. Therefore I chose to watch and see if the glass would smash and then make changes once the dust settled. The results above highlight why I took that view and how it has helped me outperform the market and the majority of fund managers.
Changes
Now you may be thinking 'if it's not broke then don't try to fix it' but after a few months of minor tinkering I plan to overhaul the portfolio. Emotionally it is difficult to follow that course of action but following a proven process (such as 80-20 Investor) maximises returns over the long term. We must always bear in mind that this is a long term project.
So what changes do I plan to make? Currently the portfolio looks like this:
- 7IM - Balanced - 13.5%
- Fidelity - Multi Asset Defensive - 15%
- Henderson - UK Smaller Companies - 8.75%
- JPM - Cautious Managed - 15%
- Jupiter - European - 15%
- M&G - Japan - 16%
- Old Mutual - UK Mid Cap - 13.75
- Cash - 3%
The recent strong performance has been driven a lot by my Japanese exposure as well as by my UK Smaller companies exposure. So it may seem strange that I am looking to scale back both of these parts of my portfolio. However, sticking to a process sometimes means selling your winners. Remember the famous investment phrase.... 'nobody ever lost money taking a profit'.
In light of the latest 80-20 Investor Best of the Best Selection I am altering my portfolio's asset allocation to follow it. You can see my analysis of the 80-20 Investor's asset mix here. Principally that means reducing my Japanese exposure in favour of US equities, while also increasing my exposure to Global bonds.
So below is a list of each of my switches
- Switch Fidelity Multi Asset Defensive to Aberdeen High Yield Bond
- Switch Henderson UK Smaller Companies to Unicorn UK Income
- Keep JPM Cautious Managed
- Switch Jupiter European to FP Argonaut Enhanced European Income
- Switch half of my holding in M&G Japan into AXA Framlington American Growth
- Keep other 50% of M&G Japan
- Keep Old Mutual UK Mid Cap
- Split the Cash & 7IM Balanced across all the other 7 holdings equally.
So my NEW portfolio becomes:
- Aberdeen High Yield Bond - 17% (LOW RISK)
- JPM Cautious Managed - 17.5% (LOW RISK)
- Unicorn UK Income - 11% (MEDIUM RISK)
- Old Mutual UK Mid Cap - 16% (MEDIUM RISK)
- FP Argonaut European Enhanced Income - 17.5% (MEDIUM RISK)
- AXA Framlington American Growth - 10.5% (HIGH RISK)
- M&G Japan - 10.5% (HIGH RISK)
Overview
To emulate the 80-20 Investor Best of the Best Selection I need to reduce the portfolio's Japanese equity exposure and boost its exposure to global bonds and US equities. Emotionally at the moment investing in US equities is a tough call. There are a number of reasons why the outlook may be bleak for US equites in the short term, including an impending interest rate rise. But as I've mentioned it is important to stick to a process. Often it is our most uncomfortable investment decisions which are our most profitable ones. Let's hope this is one such instance.
As highlighted in my analysis of the 80-20 Investor's Best of the Best Selection first year part of the outperformance it achieved was a result of the asset mix. However, most of the outperformance was generated by the the actual funds selected. That is why all the fund replacements for my portfolio are from this month's Best of the Best Selection. In some cases, such as with Jupiter European, I have replaced the fund with a fund from the same sector.
However, overall I have also slightly reduced the risk level of the portfolio, for example Jupiter European was a high risk fund while FP Argonaut European Enhanced Income fund is medium risk as defined by the 80-20 investor algorithm.
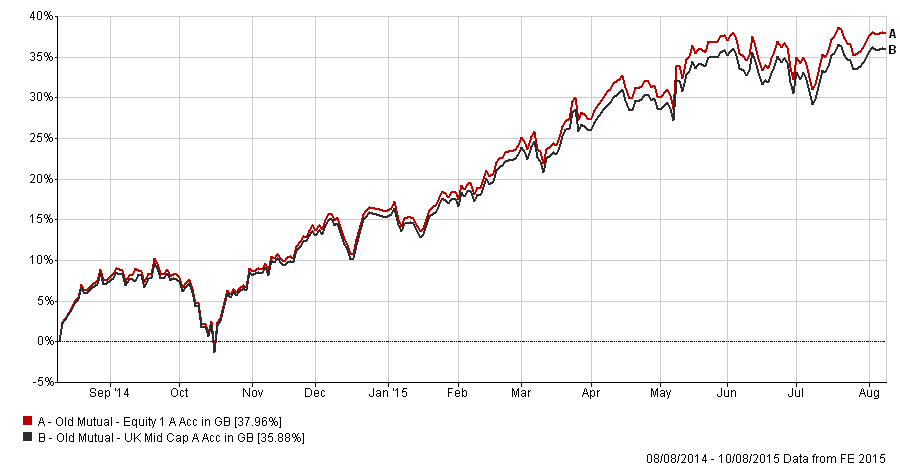
There are 3 funds which I have kept. Firstly the JPM Cautious Managed fund because it remains in the 80-20 Investor Best of the Best Selection. I have also kept the Old Mutual UK Mid Cap fund as the investment platform I use does not offer the Old Mutual Equity fund from this month's 80-20 Investor Best of the Best Selection. However, as shown in the chart below, which shows the performance of the two funds over the last year, the UK Mid Cap fund is the same thing in all but name.
Finally I have reduced my M&G Japan exposure by 50% and have kept the fund despite it not featuring in this month's Best of the Best Selection. I will keep this under review for now but I have kept the fund because it is a member of my 7 funds for consistent returns.
Photo by David Castillo Dominici. via freedigitalphotos.net
The material in any email, the MonetotheMasses.com website, associated pages / channels / accounts and any other correspondence are for general information only and do not constitute investment, tax, legal or other form of advice. You should not rely on this information to make (or refrain from making) any decisions. Always obtain independent, professional advice for your own particular situation. See full Terms & Conditions and Privacy Policy
Neither MoneytotheMasses.com/80-20 Investor nor its content providers are responsible for any damages or losses arising from any use of this information. Past performance is no guarantee of future results.
Funds invest in shares, bonds, and other financial instruments and are by their nature speculative and can be volatile. You should never invest more than you can safely afford to lose. The value of your investment can go down as well as up so you may get back less than you originally invested.
Information provided by MoneytotheMasses.com/80-20 Investor is for general information only and not intended to be relied upon by readers in making (or not making) specific investment decisions.
Appropriate independent advice should be obtained before making any such decisions. Leadenhall Learning (owner of MoneytotheMasses.com/80-20 Investor) and its staff do not accept liability for any loss suffered by readers as a result of any such decisions.
The tables and graphs are derived from data supplied by Trustnet. All rights Reserved.

£200 Pension Cashback Offer
Make a qualifying deposit or transfer a pension to our partner Interactive Investor.
- Deposit or transfer a pension of at least £20k and you could earn £200 cashback
- Terms and Fees apply, Capital at risk
- New & Existing customers opening a SIPP
- Offer ends 31st July 2026
Before starting your transfer, check you won't lose any valuable benefits (such as guaranteed annuity rates or a lower protected pension age) and find out what exit fees you might have to pay
