

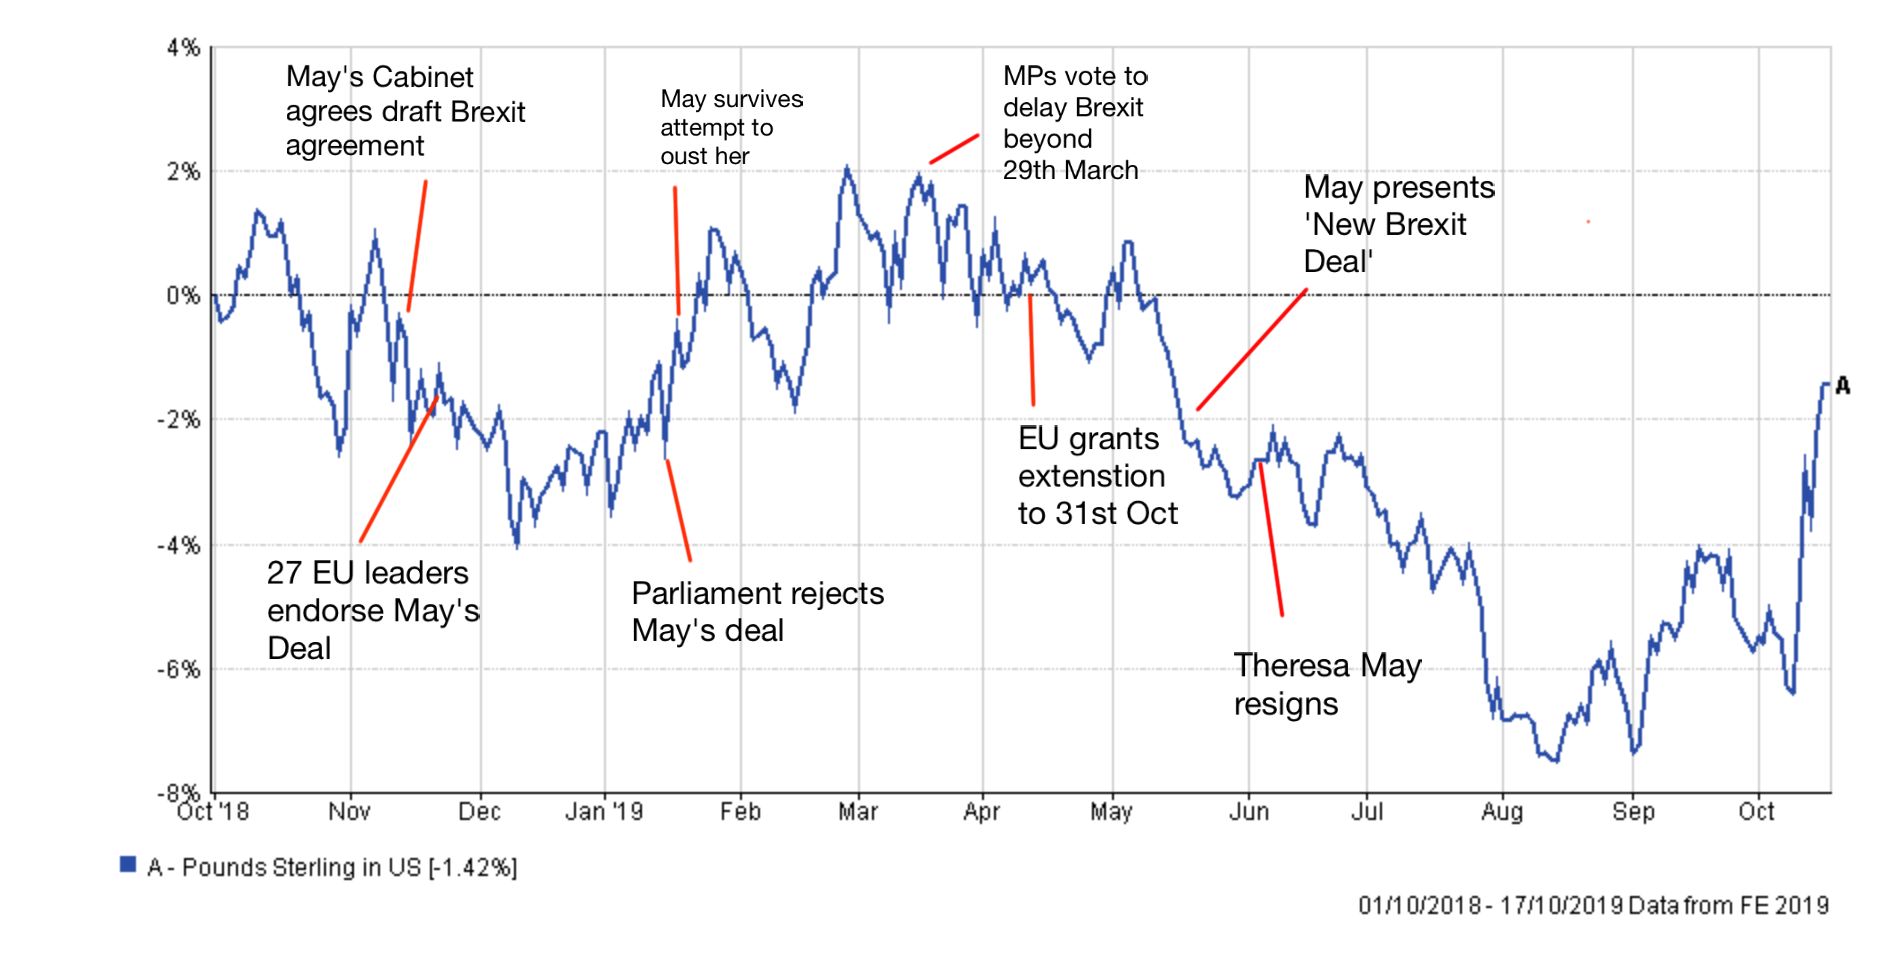
Since the Brexit referendum back in 2016 the pound has tumbled in value, by as much as 18.4% as shown in the chart below (click to enlarge). The chart shows the GBP/USD exchange rate which ranged from $1.47, just ahead of the Brexit referendum on the left-hand side, to $1.20 which we've seen in recent months.

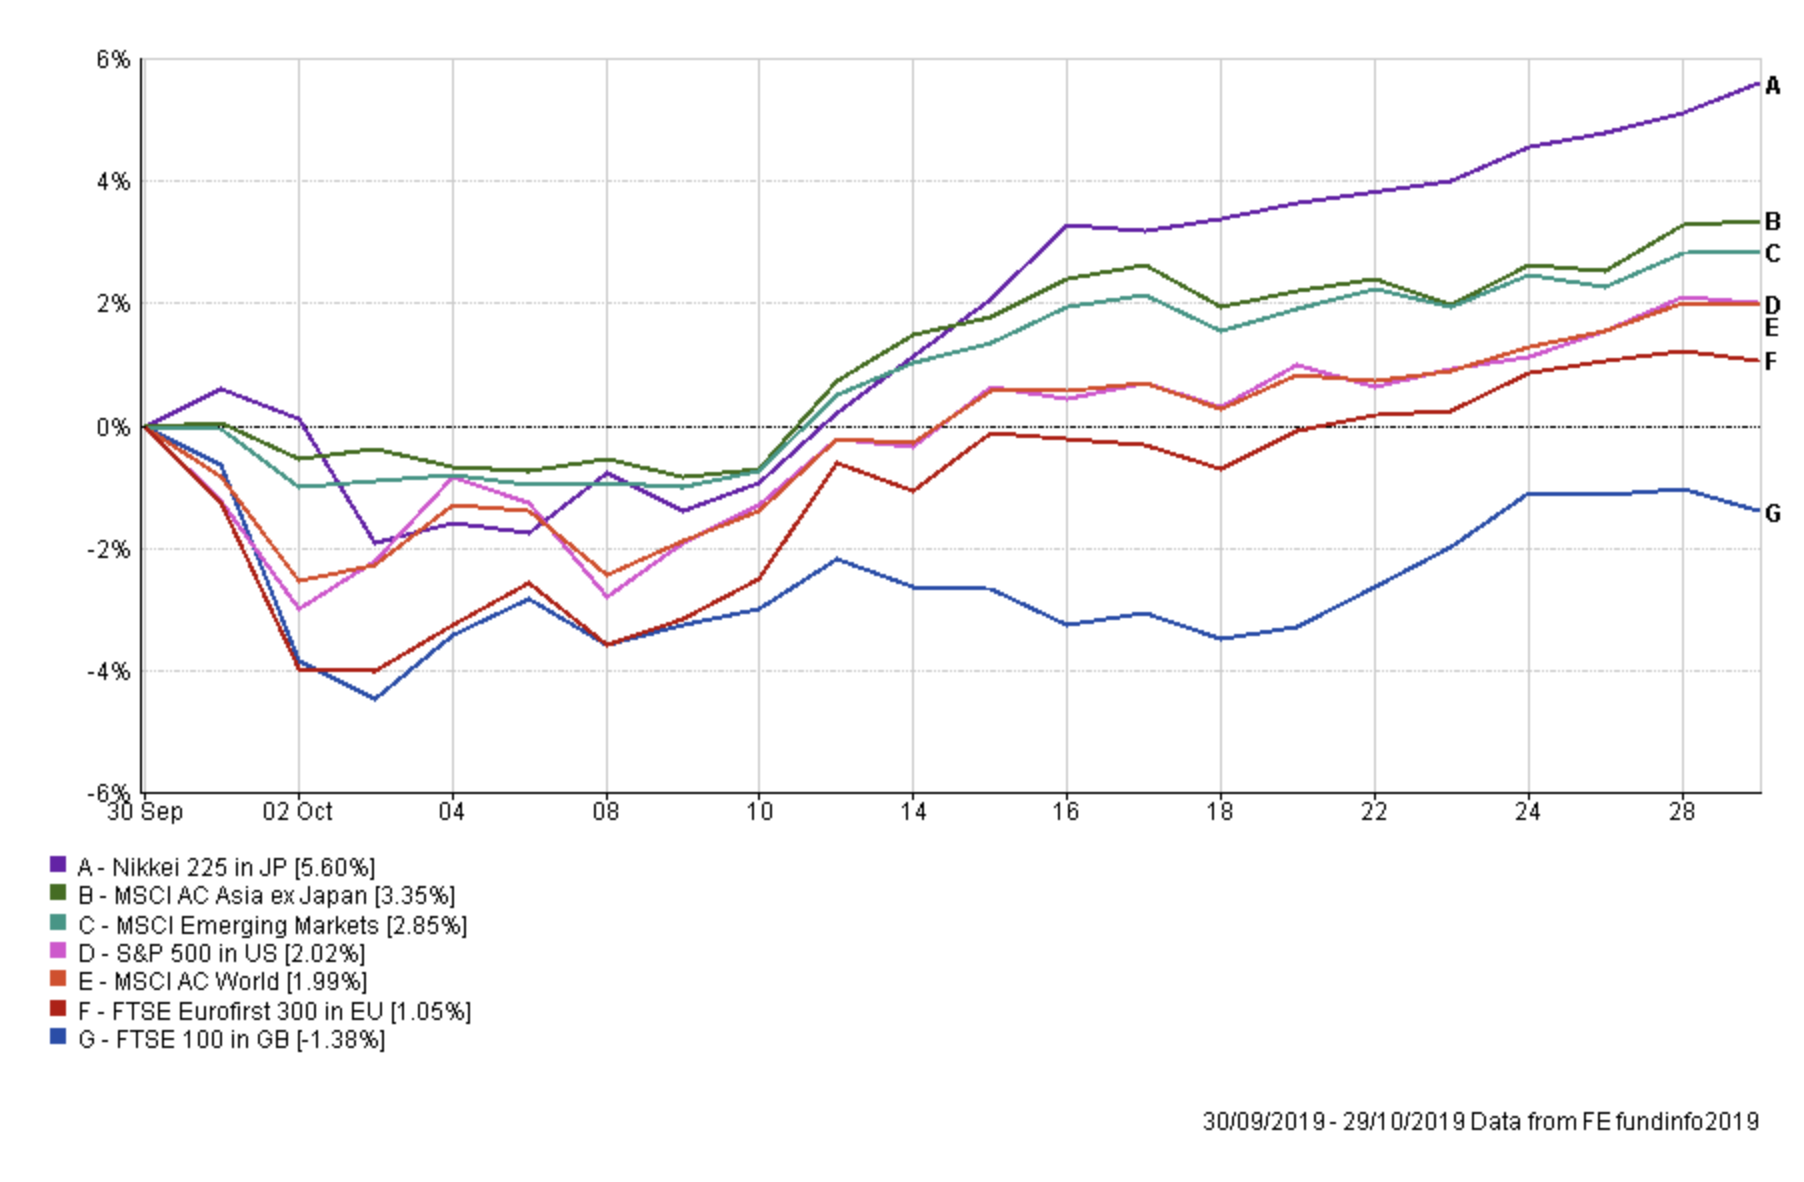
While the pound strengthened into April 2018, generally speaking, UK investors have benefited from the weaker pound over the course of the last three years. But in the course of the last month we've seen the pound strengthen aggressively as Boris Johnson secured a new Brexit deal with the European Union. The first chart below shows the price movements of key stock market indices during October in local currency terms.
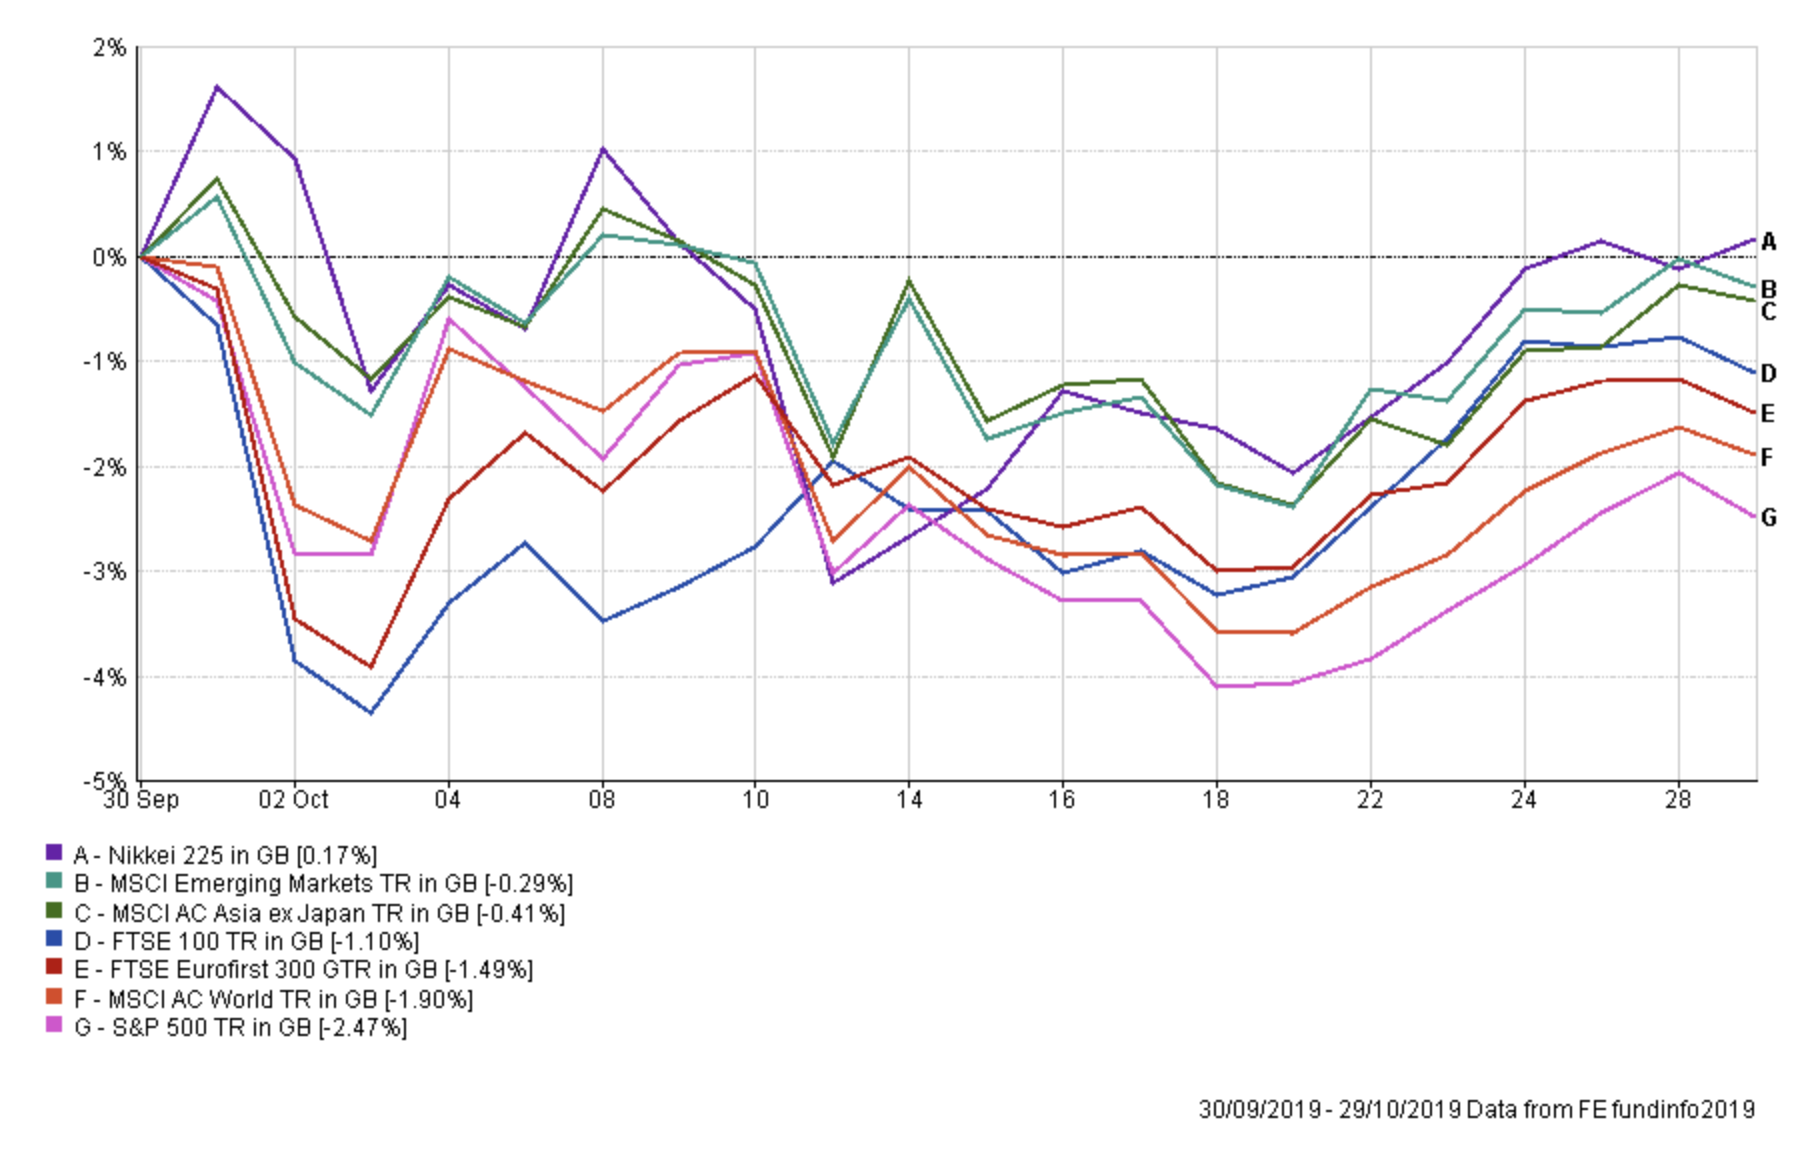
The second chart below shows the impact of taking into account the appreciation of the pound. Or in other words, this is what UK investors experienced i.e losses across the board despite stock markets rallying strongly.
What to do about a problem like the pound
It raises the question of how best to mitigate a continued rally in the value of the pound on a portfolio. In 2016, months after the UK referendum, I produced a research piece called 'Currency hedging: What to do about a problem like the pound'. The strategies discussed in that piece are as relevant now as they were then, including investing in UK focused smaller companies funds. I recommend that you read the article in full.
However, this research article (as well as the article from 2016) are not recommendations to hedge your portfolio against a continued strengthening in the pound. Indeed, the chart below produced in a recent 80-20 Investor weekly newsletter shows just how the volatility in the value of the pound has picked up over the course of the last year as we enter the latter stages of the Brexit saga. As I write this it looks like the UK is headed for another General Election. Trying to predict the future direction of the pound versus any currency is risky and inadvisable. There is no certainty that the pound will continue to strengthen, it could indeed weaken. However, I want to explore how you might go about protecting your portfolio from a strengthening in the pound. A question that a number of you have asked.
In the original aforementioned research piece, I explain how to hedge your portfolio's currency exposure. In particular, I state...
"...another way of mitigating [the pound's] influence on your returns, without going native as described, is to hedge your portfolio. The simplest way to do that is to buy hedged funds.
However a lot of funds don't offer a hedged version of their fund, or if they do then UK platforms don't give access to it. Then of course there is the issue of funds that do hedge all or part of their currency exposure but you have no way of knowing.
Ask most professional fund commentators and they wouldn't be able to tell you whether a fund is currency hedged or not. As a rule most funds investing outside of the UK don't hedge currency risk, especially global funds, because the cost of hedging out multiple currencies becomes too prohibitive. So you tend to only see it in funds with a single geographical focus. The issue is muddied further as there is no easy way to see whether a fund is currency hedged. The fund manager seldom even mentions it on their fund factsheets. Historically the only way to find out is to call up the fund house and ask if they hedge out currency risk, which isn't feasible when there are around 2,000 funds available to the UK investor."
I then go on to explain how to use the period across the Brexit referendum when the pound weakened drastically to see which funds may be hedging and which weren't. I also state that
..."if you want to reduce your exposure to a weak pound versus the dollar then use your platform (Hargreaves Lansdown etc) to chart a fund's performance over the Brexit vote period. Then chose one where there wasn't a spike in returns coinciding with sterling's collapse. One thing to bear in mind is that just because you put out the GBP/USD fire another might spring up elsewhere in terms of the GBP/yen exchange rate."
The problem for investors wanting to take a similar approach today is that looking at the referendum period from three years ago has its limitations as funds could have changed their investment strategy (i.e begun hedging). Fortunately, the aggressive strengthening in the pound during October 2019 gives more recent data from which to draw more accurate and relevant conclusions.
2019 hedging / unhedged fund analysis
Even more fortunate for 80-20 Investor members is that I've now carried out this fund-by-fund analysis for them on key unit trust equity sectors which have overseas exposure, namely:
- Global (equities)
- Global Bonds
- European ex UK (equities)
- Japan (equities)
- North American (equities)
For each sector, I've analysed every fund and every share class for each fund. Given the number of funds the research took a week to complete. Below you can download excel spreadsheets for each of the above sectors.
Each spreadsheet shows how each fund behaved in percentage terms between 9th October 2019 and 21st October 2019, a period when the pound rallied more than 5% against the US dollar and more than 4% against the euro.
It follows that a fund (from the North American sector for example) which is unhedged would have tumbled in value as the pound rallied aggressively against the dollar. That's because any US assets (priced in US dollars) would be worth less in sterling terms when converted back into pounds. Conversely, a fund which was hedged would not have been impacted by the rally in the pound and instead just enjoyed the rally in US equity markets.
If you open the North American spreadsheet you will see that it is ordered with those funds that performed the best, during the aforementioned period, at the top and those that performed the worst at the bottom. You will see that those funds that are labelled as 'Hedged' (some of these labels I've added manually) tend to be at the top and are coloured green. Admittedly, you won't be able to buy all of these from your platform. Those funds that performed worst are at the bottom (along with the US dollar itself) and coloured red. As you can see the colour scale is 'sliding' in a similar way to other 80-20 Investor heatmaps.
So you can see quickly those funds that performed best over the period in question. Of course just because a fund performed well over the period doesn't automatically mean it is currency hedged. There could be other investment factors in play. So I have also analysed the correlation between the movement in the value of the pound and each fund.
As a reminder, correlation is a statistical measure that shows whether two things follow each other or not. You can work out whether two things are correlated by working out what is known as the correlation coefficient. It is complicated to work out but it is very easy to use. The correlation figure can range between -1 and 1. A figure of 1 would suggest that the two objects follow each other while a score of -1 suggests that as one rises the other falls and vice versa. A score of 0 means that the two assets are not correlated. In the North American spreadsheet the correlation is between each fund and the weakness of the pound, so as the pound strengthens a negative correlation means that the fund tends to move in the opposite direction, hence why it would be coloured green. Those that have a high positive correlation are coloured red (as they do well when the pound falls in value vs the dollar).
You can filter and order the data how you want to (i.e. alphabetical by fund name). If you are looking at a fund and both columns suggest that it could have a currency hedge of some kind in place then make sure you check with the fund's factsheet for more details and confirmation. The aim of the data is to help investors short cut their research by focusing and digging deeper on a shortlist that they create. It is not a definitive declaration of hedging positions.
When it comes to the Global sector and Global bond sectors I have highlighted the correlation to the US dollar but bear in mind some funds may be more European focused, which is usually obvious from their names. With the European sector and the Japan sector, I have looked at the correlation with the euro and yen respectively.
Remember, the downside to currency hedging is that it costs the fund managers money to implement so it drags on your returns. For those investors who in the short term want a cheap tracker fund that hedges out the currency exposure to a given market then you can buy ETFs that do this. Here is a list of some from ishares.
Currency exposure spreadsheets
Click the links to download the relevant spreadsheets:
Where there were multiple share classes for one fund I only show share classes that behaved differently. If they didn't then I just included the main share class to keep things simple.
The material in any email, the MonetotheMasses.com website, associated pages / channels / accounts and any other correspondence are for general information only and do not constitute investment, tax, legal or other form of advice. You should not rely on this information to make (or refrain from making) any decisions. Always obtain independent, professional advice for your own particular situation. See full Terms & Conditions and Privacy Policy
Neither MoneytotheMasses.com/80-20 Investor nor its content providers are responsible for any damages or losses arising from any use of this information. Past performance is no guarantee of future results.
Funds invest in shares, bonds, and other financial instruments and are by their nature speculative and can be volatile. You should never invest more than you can safely afford to lose. The value of your investment can go down as well as up so you may get back less than you originally invested.
Information provided by MoneytotheMasses.com/80-20 Investor is for general information only and not intended to be relied upon by readers in making (or not making) specific investment decisions.
Appropriate independent advice should be obtained before making any such decisions. Leadenhall Learning (owner of MoneytotheMasses.com/80-20 Investor) and its staff do not accept liability for any loss suffered by readers as a result of any such decisions.
The tables and graphs are derived from data supplied by Trustnet. All rights Reserved.

£200 Pension Cashback Offer
Make a qualifying deposit or transfer a pension to our partner Interactive Investor.
- Deposit or transfer a pension of at least £20k and you could earn £200 cashback
- Terms and Fees apply, Capital at risk
- New & Existing customers opening a SIPP
- Offer ends 31st July 2026
Before starting your transfer, check you won't lose any valuable benefits (such as guaranteed annuity rates or a lower protected pension age) and find out what exit fees you might have to pay
