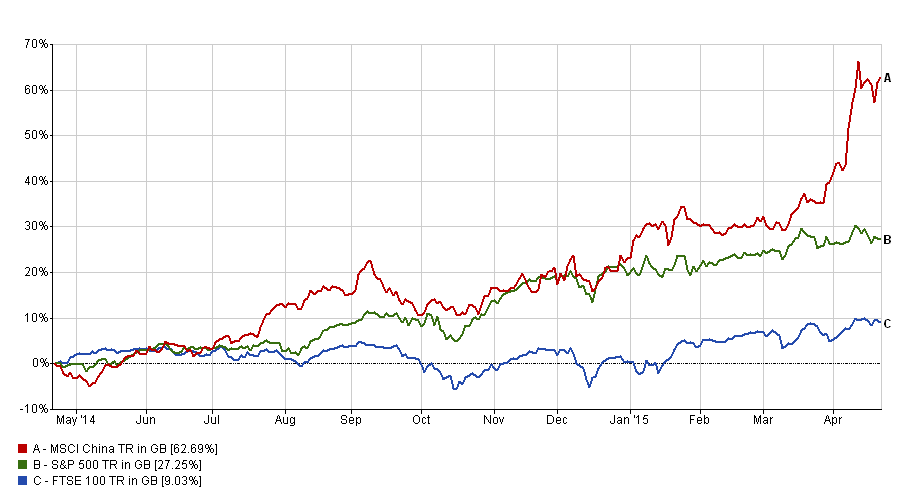
To give you a sense of the strength of the recent rally in Chinese equities the chart below compares the returns a UK investor would have achieved had they invested in Chinese equities versus those in the US and the UK over the last year.
Now there is a reason why I have benchmarked it against the US stock market. Firstly because the US stock market was the best performing market in 2014.
Secondly, in order to illustrate how severe the rally in Chinese equities has been. The size of the rally actually distorts the vertical scale on the chart. So much so that the incredible 15% return from the S&P 500 in the last 6 weeks of 2014 is barely noticeable!
What is driving the rally in Chinese equitiesThe chart below shows the performance of the MSCI China Index over the last 3 years.
Full article available exclusively to 80-20 Investor members.
To read the complete article, sign up for a free trial or log in below.
Start a free trial Already have an account? Log in


